Upgrade to Pro — share decks privately, control downloads, hide ads and more …

ICEC 2019 SAVE: What Worked to Shift Consumption?

ICEC 2019 SAVE: What Worked to Shift Consumption?

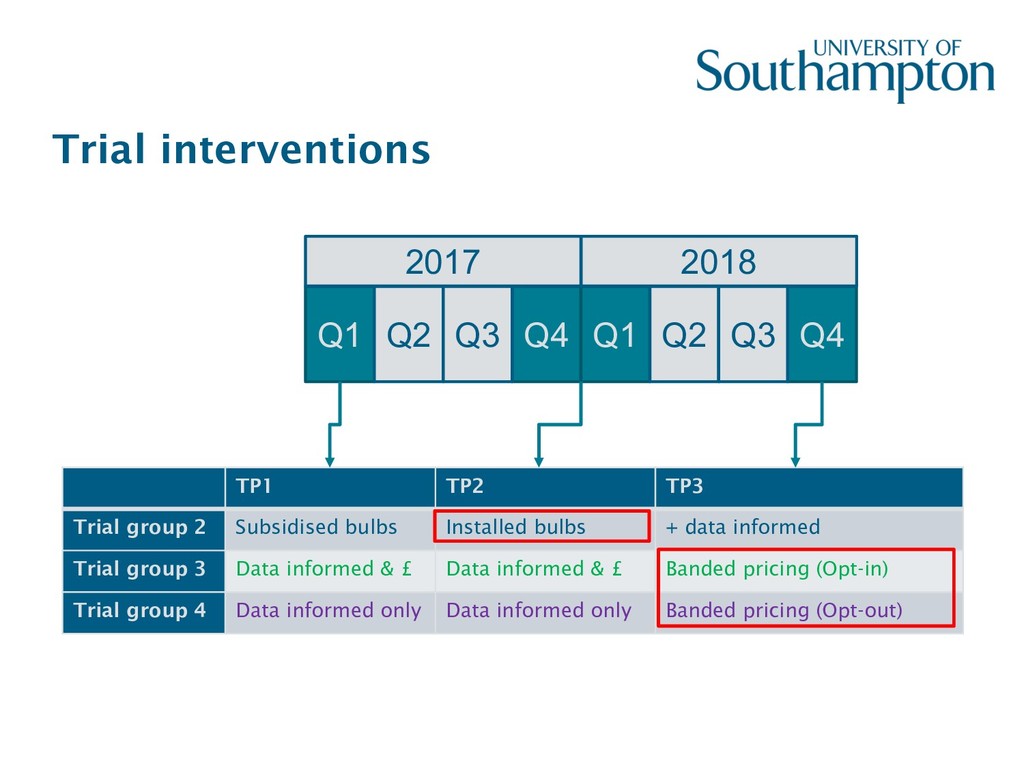
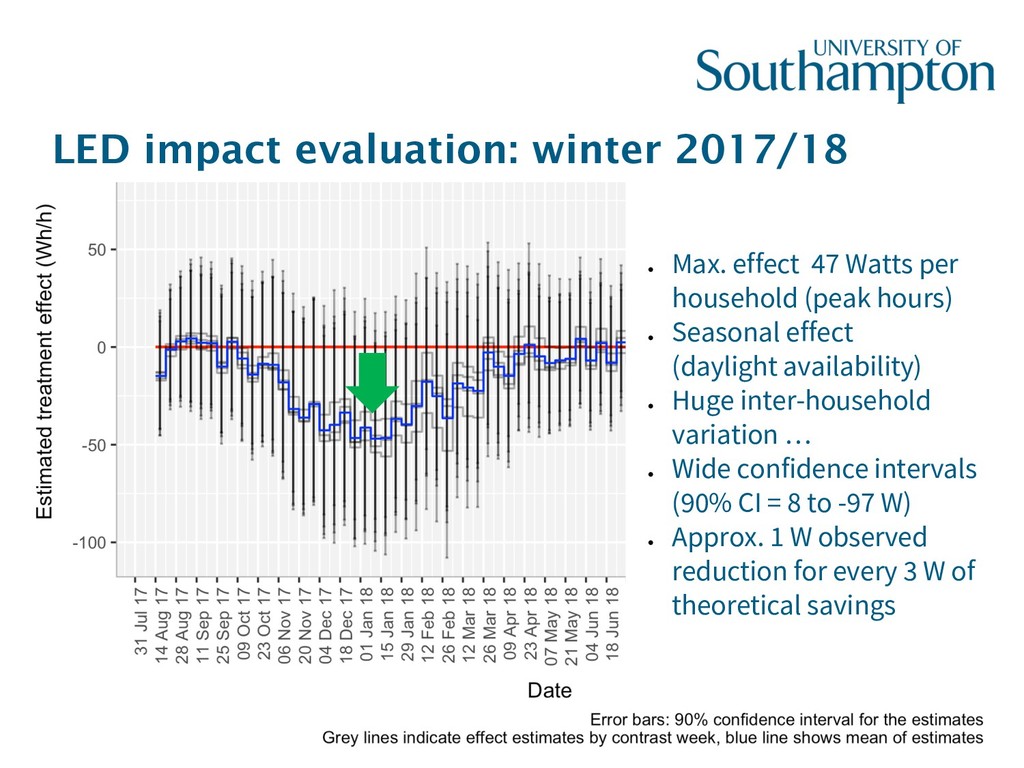
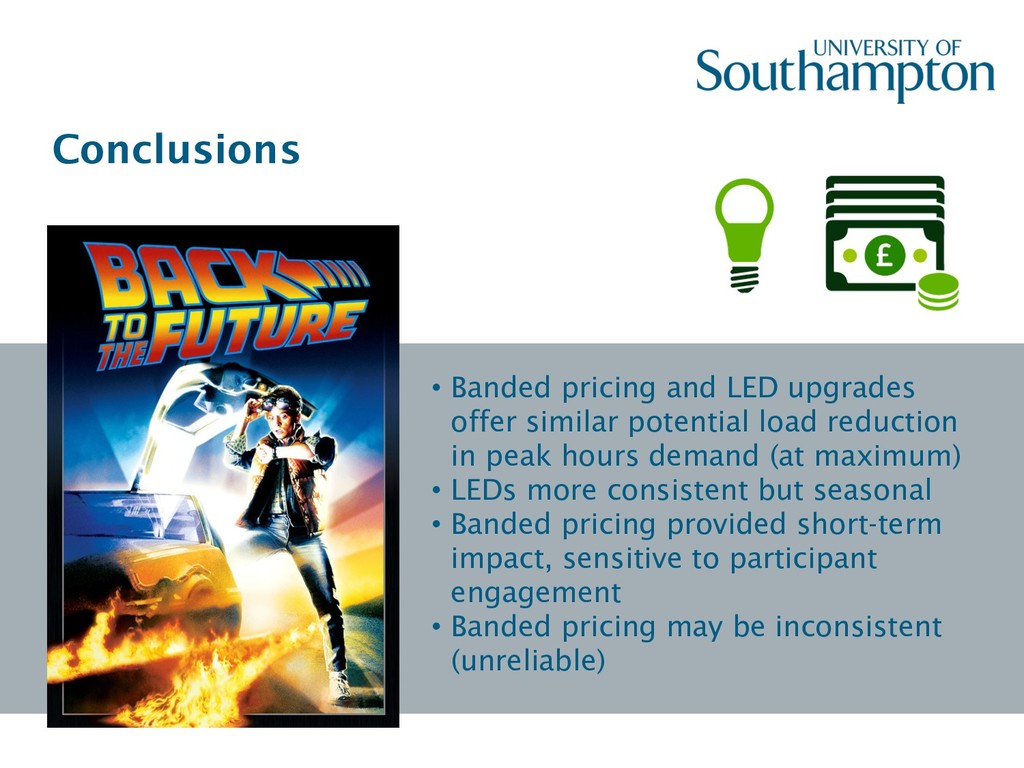
Presentation on Solent Achieving Value from Efficiency (SAVE) project results given at the International Conference on Energy and Cities 2019. Comparing LED and banded tariff (peak rebate) trial results. What on earth does this all have to do with a time machine from a classic 80s movie?

Thomas Rushby

July 10, 2019
Tweet

More Decks by Thomas Rushby

Other Decks in Research

Transcript

  1. What Works to Shift Consumption? Results from Large Scale Demand

    Response Trial International Conference on Energy and Cities Southampton - 10th July 2019 Tom Rushby* | Ben Anderson | Patrick James | AbuBakr Bahaj Engineering & Environment (Energy & Climate Change)
  2. The problem 00:00 04:00 08:00 12:00 16:00 20:00 00:00 Load

    (kVA) Time of Day 2030 Low 2030 Central 2030 High Transformer Rating Weekday transformer load profile growth scenarios to 2030. Adapted from EA Technology [1] Distribution network operators face challenges in the transition to a low carbon energy system: • Load growth from • Electric vehicles • Electrification of heat • Intermittent distributed generation (e.g. PV) These low carbon technologies put pressure on existing low voltage network assets.
  3. Project aims • Investigate what works to reduce domestic demand

    during peak hours? • Use findings to help DNOs to better model domestic demand (and demand response) and inform investment decisions • Provide statistically robust evidence
  4. How? A large-scale randomised control trial Geographical location of SAVE

    project trial participants • Statistical power analysis to estimate required sample size • N ~ 4,000 households (1,000 per group) • Random, stratified sample in ‘Solent’ area • Random allocation to treatment groups • Household surveys to evaluate sample
  5. Trial interventions Q1 Q2 Q4 Q3 Q1 Q2 Q4 Q3

    2017 2018 TP1 TP2 TP3 Trial group 2 Subsidised bulbs Installed bulbs + data informed Trial group 3 Data informed & £ Data informed & £ Banded pricing (Opt-in) Trial group 4 Data informed only Data informed only Banded pricing (Opt-out)
  6. LED installations 76% uptake Average of 7 bulbs replaced per

    household 176 Watts/household theoretical max. reduction
  7. • Max. effect 47 Watts per household (peak hours) •

    Seasonal effect (daylight availability) • Huge inter-household variation … • Wide confidence intervals (90% CI = 8 to -97 W) • Approx. 1 W observed reduction for every 3 W of theoretical savings LED impact evaluation: winter 2017/18
  8. Banded pricing Peak-hours consumption threshold Paid for every hour with

    consumption under threshold Weekly text message balance updates
  9. Banded pricing Two treatment groups: Opt-in (top) Opt-out (bottom) 38%

    of group 98% of group Max. effect = 17W Max. effect = 44W
  10. Conclusions • Banded pricing and LED upgrades offer similar potential

    load reduction in peak hours demand (at maximum) • LEDs more consistent but seasonal • Banded pricing provided short-term impact, sensitive to participant engagement • Banded pricing may be inconsistent (unreliable)