Presentation on the design and evaluation of the Solent Achieving Value from Efficiency (SAVE) project trials. The presentation was delivered at the project closedown event at Central Hall, Westminster on 6th June 2019.
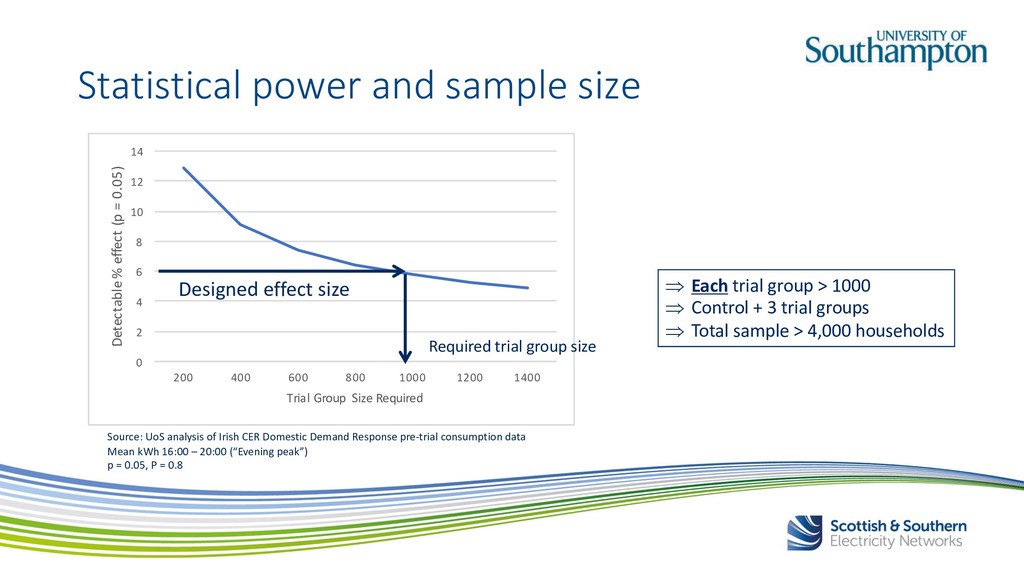
600 800 1000 1200 1400 Detectable % effect (p = 0.05) Trial Group Size Required Designed effect size Required trial group size Source: UoS analysis of Irish CER Domestic Demand Response pre-trial consumption data Mean kWh 16:00 – 20:00 (“Evening peak”) p = 0.05, P = 0.8 Þ Each trial group > 1000 Þ Control + 3 trial groups Þ Total sample > 4,000 households Statistical power and sample size
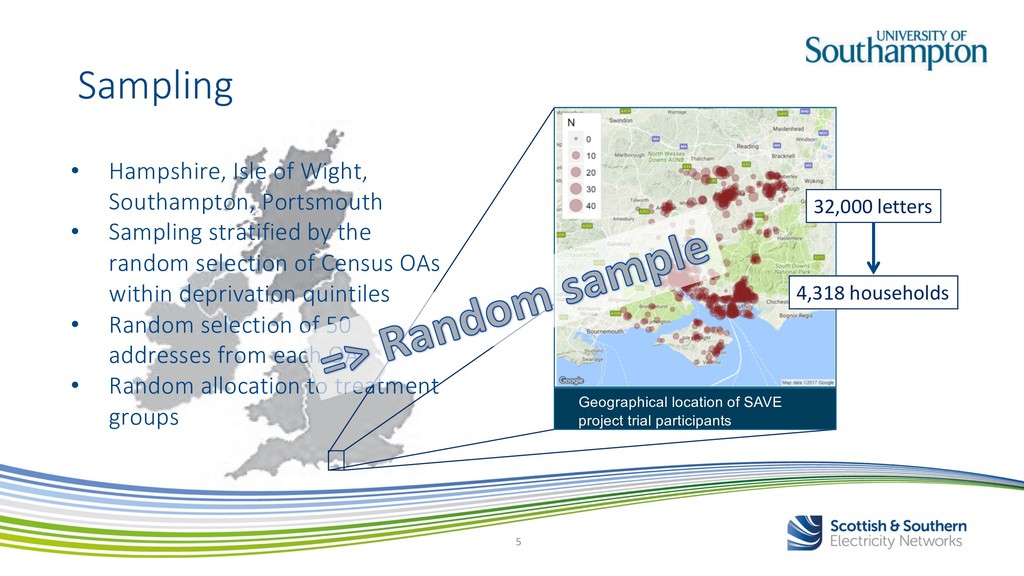
Isle of Wight, Southampton, Portsmouth • Sampling stratified by the random selection of Census OAs within deprivation quintiles • Random selection of 50 addresses from each OA • Random allocation to treatment groups Sampling 4,318 households 32,000 letters
Intervals Source: UoS analysis of SAVE vs Understanding Society Wave 4 sample for South East England (weighted for non-response) Recruitment outcomes: representative?
Confidence Intervals Source: UoS analysis of SAVE vs Understanding Society Wave 4 sample for South East England (weighted for non-response) Recruitment outcomes: biased?
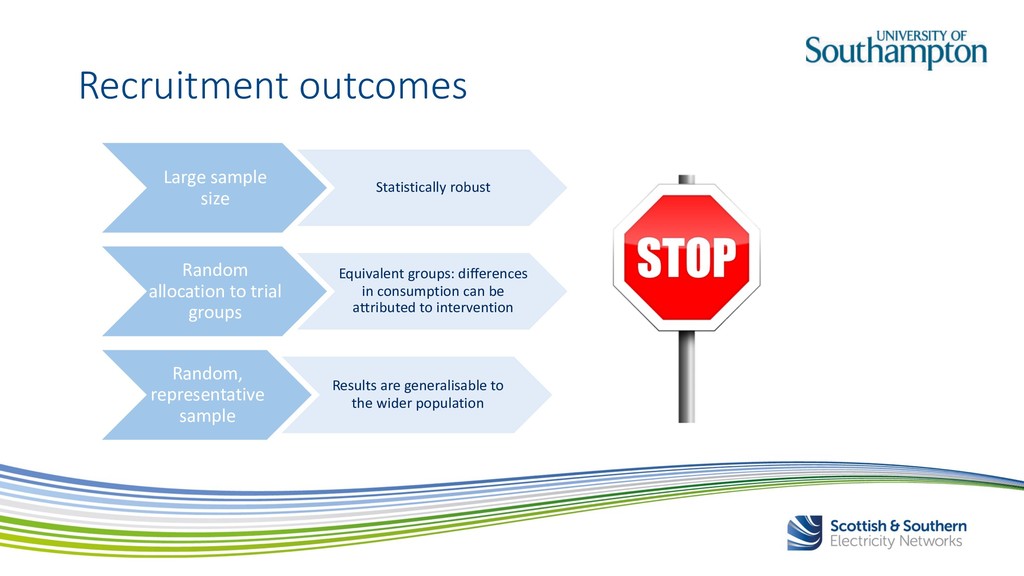
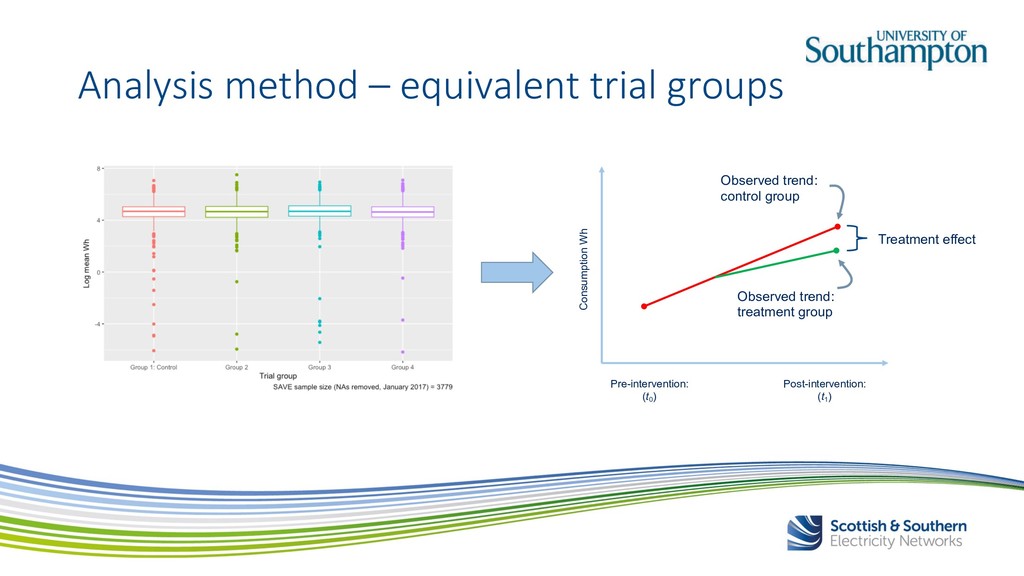
Equivalent groups: differences in consumption can be attributed to intervention Random, representative sample Results are generalisable to the wider population Recruitment outcomes
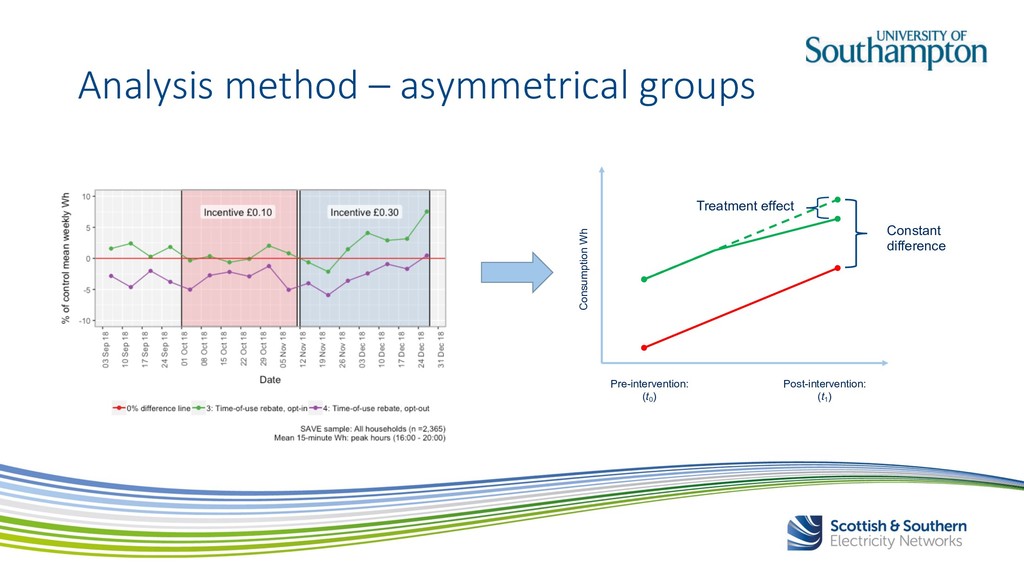
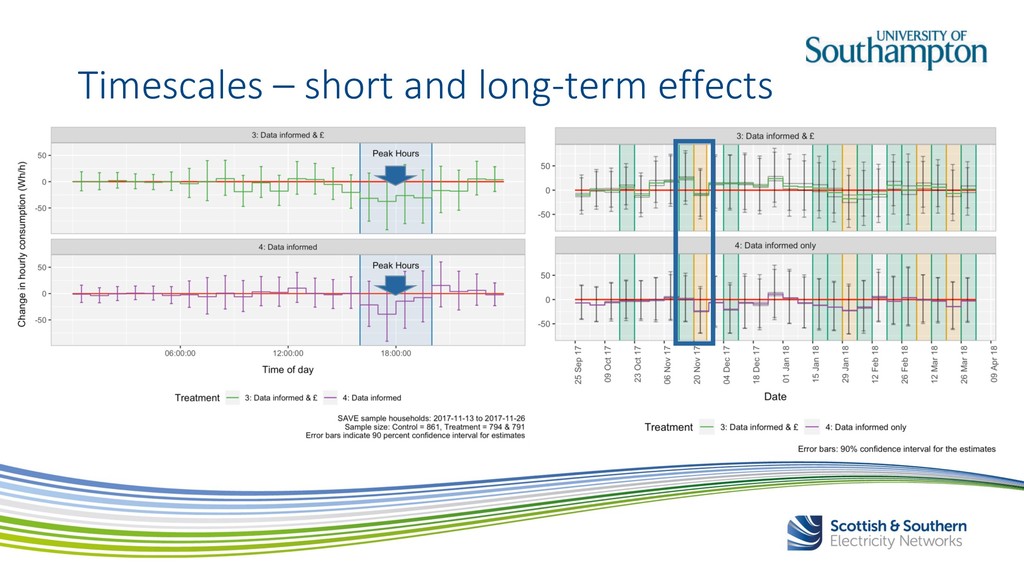
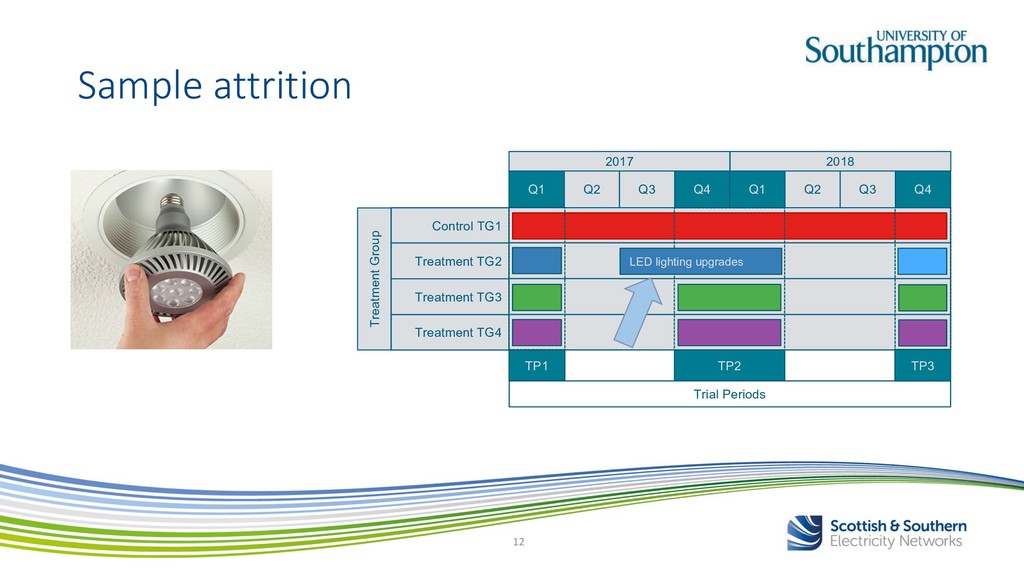
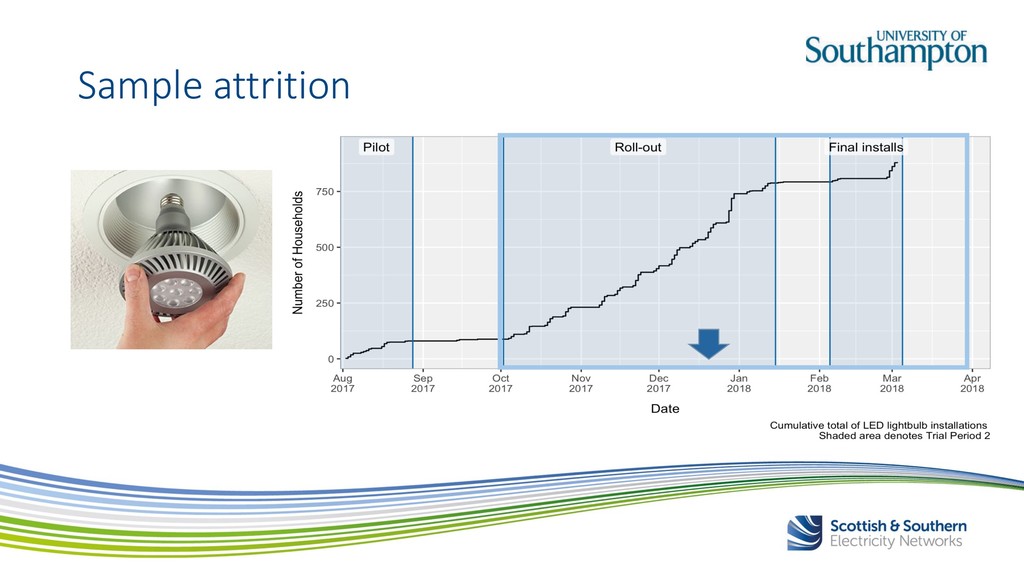
industry-leading evidence base for estimating and modelling demand response • Even with careful design and implementation, the project faced evaluation challenges: ◦ Small asymmetries between groups required a new analytical approach ◦ Understanding responses to interventions required analysis across multiple time scales ◦ Attrition and communications issues over the trial increased uncertainty • Recommendations: ◦ Plan for asymmetry in trial groups even for RCTs with equivalent trial groups at trial start ◦ Be realistic about timescales around recruitment and interventions ◦ Adapt analysis approaches to each intervention ◦ Sample size: plan for attrition and communication issues Summary and recommendations
![Thank you for listening. [email protected] @tom_rushby #SAVEClosedown](https://files.speakerdeck.com/presentations/d315062aa70a405ba211b36fae78d5e0/slide_15.jpg)