Upgrade to Pro — share decks privately, control downloads, hide ads and more …

Analytics Design Patterns

Valentin
November 27, 2014

Analytics Design Patterns

A first attempt at formalizing a set of Analytics Design Patterns created for the data2day conference.

Valentin

November 27, 2014
Tweet

More Decks by Valentin

Other Decks in Programming

Transcript

  1. A design pattern is a general reusable solution to a

    commonly occurring problem in the design of analytics solutions. It is a best practice template for how to solve a problem that can be used in many different situations. Patterns establish a language to organize best practices. Patterns establish a knowledge baseline. (partly adapted from Wikipedia’s definition of software design patterns)
  2. motivation how to scale delivery of analytics services? (beyond algorithms

    and tools) how to organize analytics know how and best practices? how to systematically bridge the gap between business need and tools / algorithms?
  3. goal (of this presentation) spread and discuss ideas on how

    to structure know how and best practices in analytics present some interesting analytics design patterns that might be of use
  4. me • 13 year experience in software driven innovation o

    AI researcher at FZI / PhD Student at KIT o Manager of a research division at FZI concerned with all aspects of information driven decisions o Big Data consultant with codecentric o Analytics Consultant / Data Scientist with Daimler TSS
  5. project patterns • Data First: Find, understand and utilize patterns

    in a given data set • Decision Driven: Identify and realize concrete analytics use case • Metrics Model: Create systems to understand and optimize a business's core driver’s of growth • Integration First: Break open data silos and harness integration
  6. value patterns • Data Driven Business o Operational Excellence o

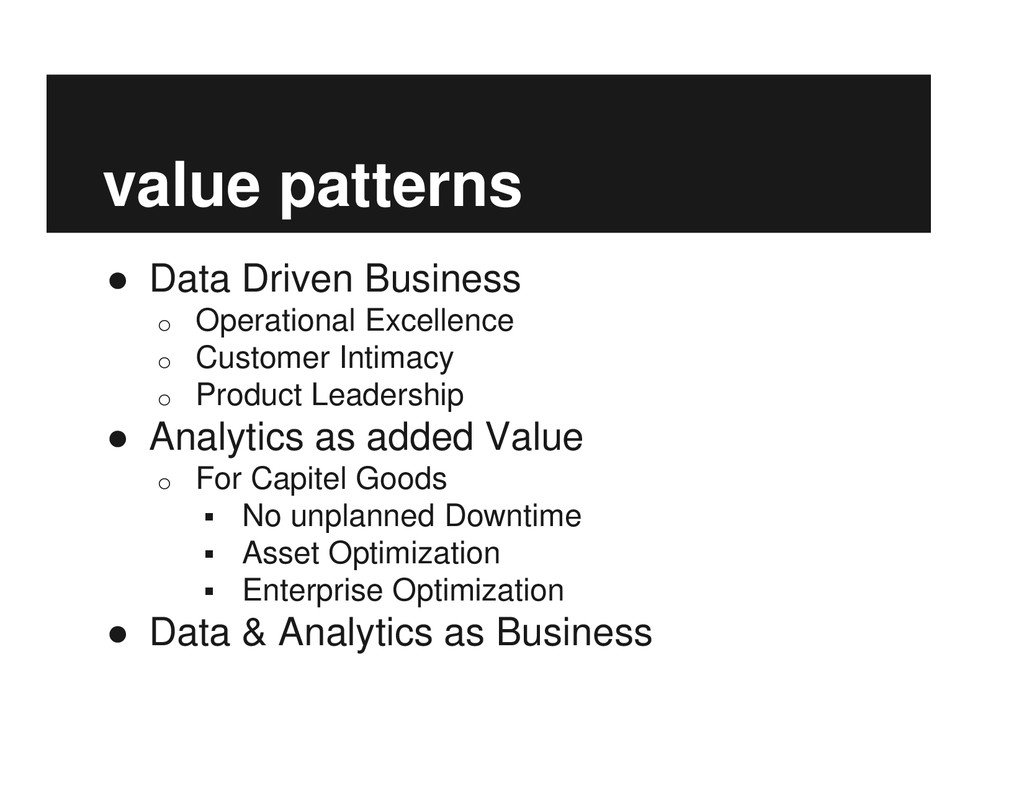
    Customer Intimacy o Product Leadership • Analytics as added Value o For Capitel Goods No unplanned Downtime Asset Optimization Enterprise Optimization • Data & Analytics as Business
  7. data understanding patterns Data Source Visualization Event Log Exploration Query

    Based Data Extracts (w/wo sampling) Analytical Record Reverse Pivot Data Audit
  8. data source visualization • Database structure visualization • Colors: o

    Blue=numeric o Green=categoric o Yellow=data/time o Red = other o White = missing
  9. Analytical Record (1/2) Most Data Mining tools and methods demand

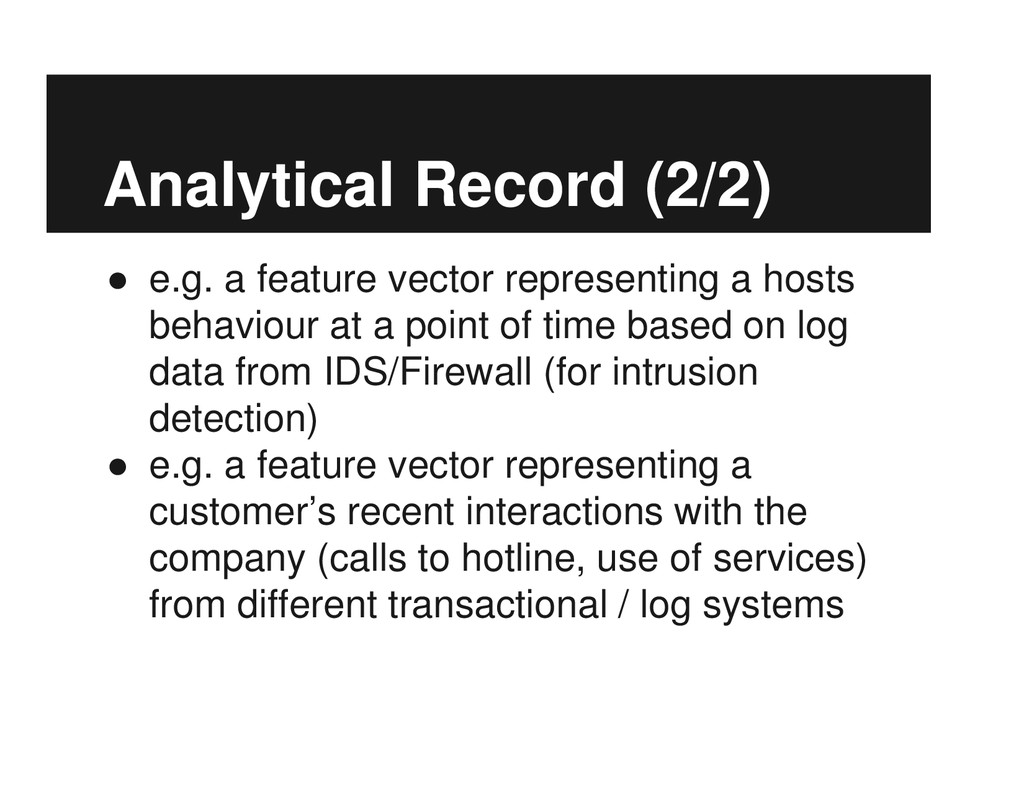
    their input structured around one kind of observation (rows) with a number of values (columns). The extract that represent the elements of interest (customer/product/process instance..) in this way is called the Analytical Record
  10. Analytical Record (2/2) • e.g. a feature vector representing a

    hosts behaviour at a point of time based on log data from IDS/Firewall (for intrusion detection) • e.g. a feature vector representing a customer’s recent interactions with the company (calls to hotline, use of services) from different transactional / log systems
  11. data preparation patterns • handling outliers o Winsorization o Trimming

    o Spatial Sign • data weighting and balancing o Case Weighting o Oversampling / Undersampling o Partitioning
  12. data preparation patterns • handling missing values o Case Deletion

    o Available Case Analysis o Single Imputation Mean / Reasonable Value Regression o Multiple Imputation Regression o Maximum Likelihood
  13. data preparation patterns • data transformation o Generalization Abstraction o

    Temporal Abstraction o Rates o Dummy Variables for Categories o Centering and Scaling o Polynomials o Interaction Terms o Box Cox transformation
  14. data preparation patterns • Feature Selection ◦ Filter / Proxy

    Based ◦ Subset Selection ◦ Embedded ◦ Dimensionality Reduction
  15. modeling • Descriptive Modeling o density estimation o dependency modeling

    o cluster analysis / segmentation • Predictive Modeling o Classification o Regression • Pattern / Rule Discovery • Content Based Retrieval • Recommendation