Upgrade to Pro — share decks privately, control downloads, hide ads and more …

Driving 10X ROI with Smarter Workforce Insights...

Driving 10X ROI with Smarter Workforce Insights - We360.ai

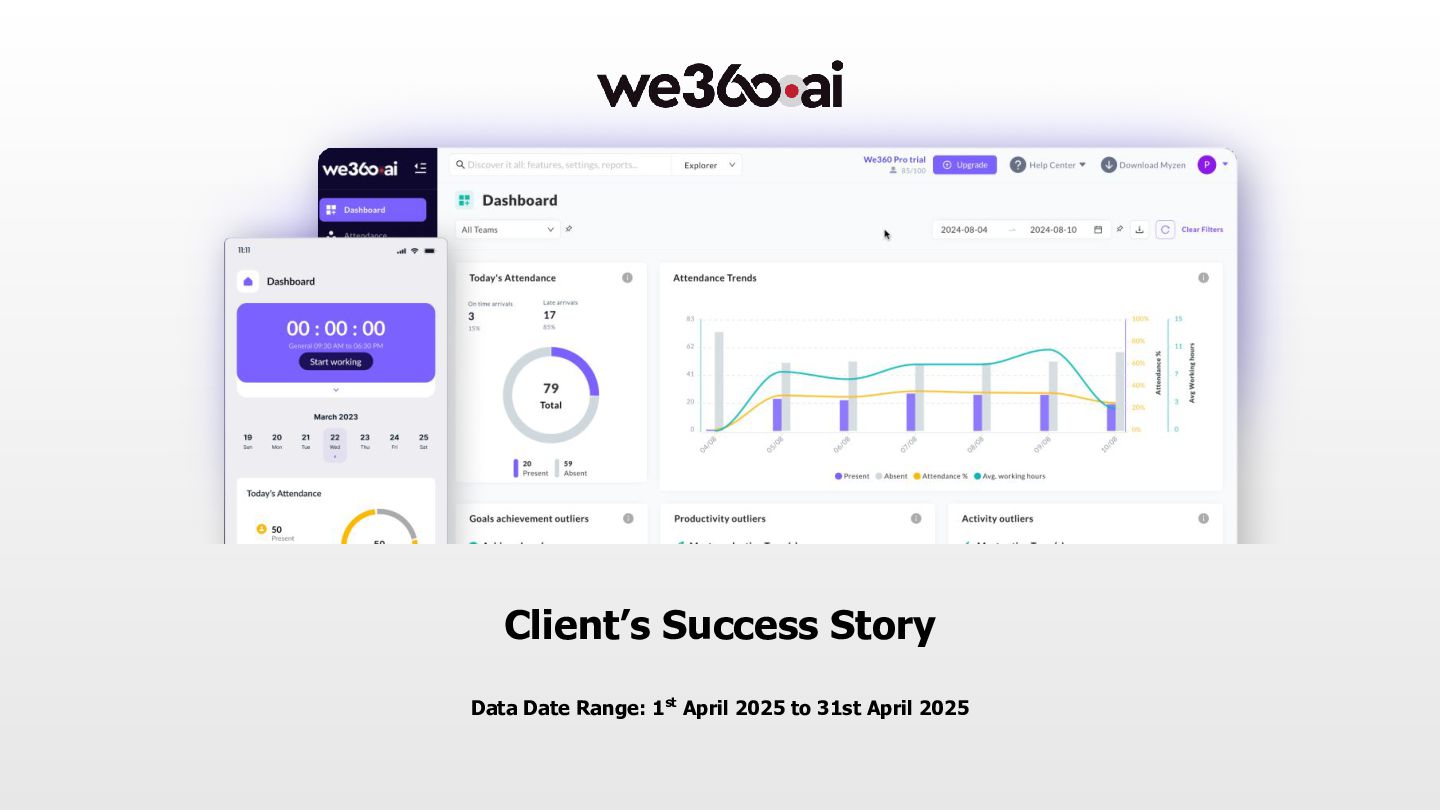
We360.ai delivered exceptional results, achieving over 10X ROI and unlocking millions in cost savings. By automating reporting and improving visibility into employee performance, organizations enhanced operational efficiency and workforce engagement. The 7-5-4 Rule helped identify recoverable productivity worth thousands of dollars monthly, while real-time insights enabled better planning, coaching, and utilization, turning data into measurable financial and performance gains.

Avatar for we360.ai

we360.ai

April 24, 2026

Other Decks in Technology

Transcript

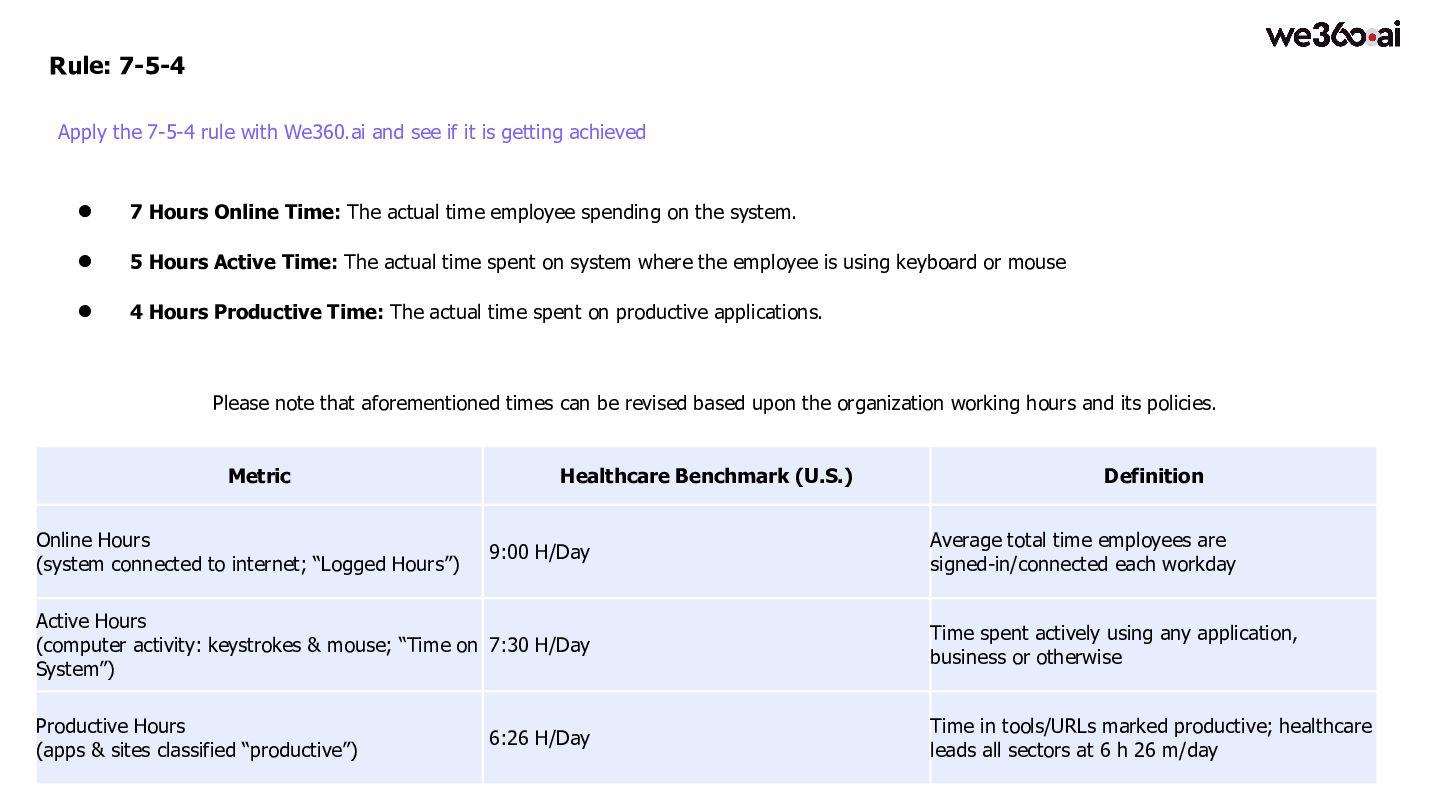
  1. Rule: 7-5-4 Apply the 7-5-4 rule with We360.ai and see

    if it is getting achieved • 7 Hours Online Time: The actual time employee spending on the system. • 5 Hours Active Time: The actual time spent on system where the employee is using keyboard or mouse • 4 Hours Productive Time: The actual time spent on productive applications. Please note that aforementioned times can be revised based upon the organization working hours and its policies. Metric Healthcare Benchmark (U.S.) Definition Online Hours (system connected to internet; “Logged Hours”) 9:00 H/Day Average total time employees are signed-in/connected each workday Active Hours (computer activity: keystrokes & mouse; “Time on System”) 7:30 H/Day Time spent actively using any application, business or otherwise Productive Hours (apps & sites classified “productive”) 6:26 H/Day Time in tools/URLs marked productive; healthcare leads all sectors at 6 h 26 m/day
  2. 3] Teamwise Loss in Online Hours (Online Hours = System

    is on & working) Assumption: Total Ideal Online Hours per day = 7 Hours & Total Ideal Online Hours per Month = 7 Hours * Number of Present Days Graph: The above graph shows the difference in Actual Online Hours & Total Ideal Online Hours i.e. Online Hours which got lost. Data Date Range: 1 st April 2025 to 31st April 2025 Insights: Total Online Time Lost was Approx. 389 working hours equivalent to 43 working days (9 hours shift). Recommendation: Reducing lost online hours would lead to increased productivity and greater output. Average Salary per Annum: $80,000 Average Salary Per Day: $220 Industry Benchmarking: As per USA HealthCare Industry Benchmarks, average online hours/day is 9.
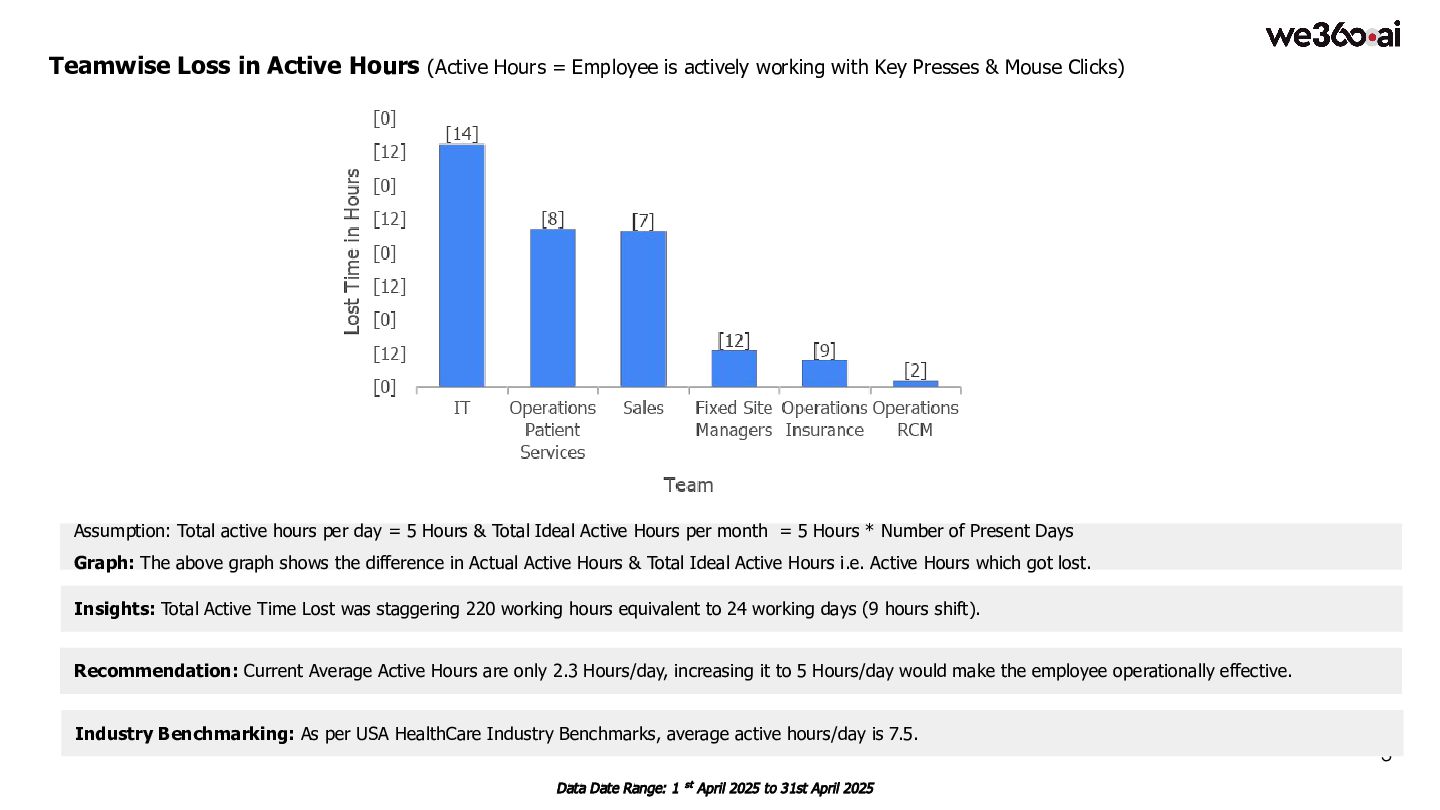
  3. 3 Teamwise Loss in Active Hours (Active Hours = Employee

    is actively working with Key Presses & Mouse Clicks) Assumption: Total active hours per day = 5 Hours & Total Ideal Active Hours per month = 5 Hours * Number of Present Days Graph: The above graph shows the difference in Actual Active Hours & Total Ideal Active Hours i.e. Active Hours which got lost. Data Date Range: 1 st April 2025 to 31st April 2025 Insights: Total Active Time Lost was staggering 220 working hours equivalent to 24 working days (9 hours shift). Recommendation: Current Average Active Hours are only 2.3 Hours/day, increasing it to 5 Hours/day would make the employee operationally effective. Industry Benchmarking: As per USA HealthCare Industry Benchmarks, average active hours/day is 7.5.
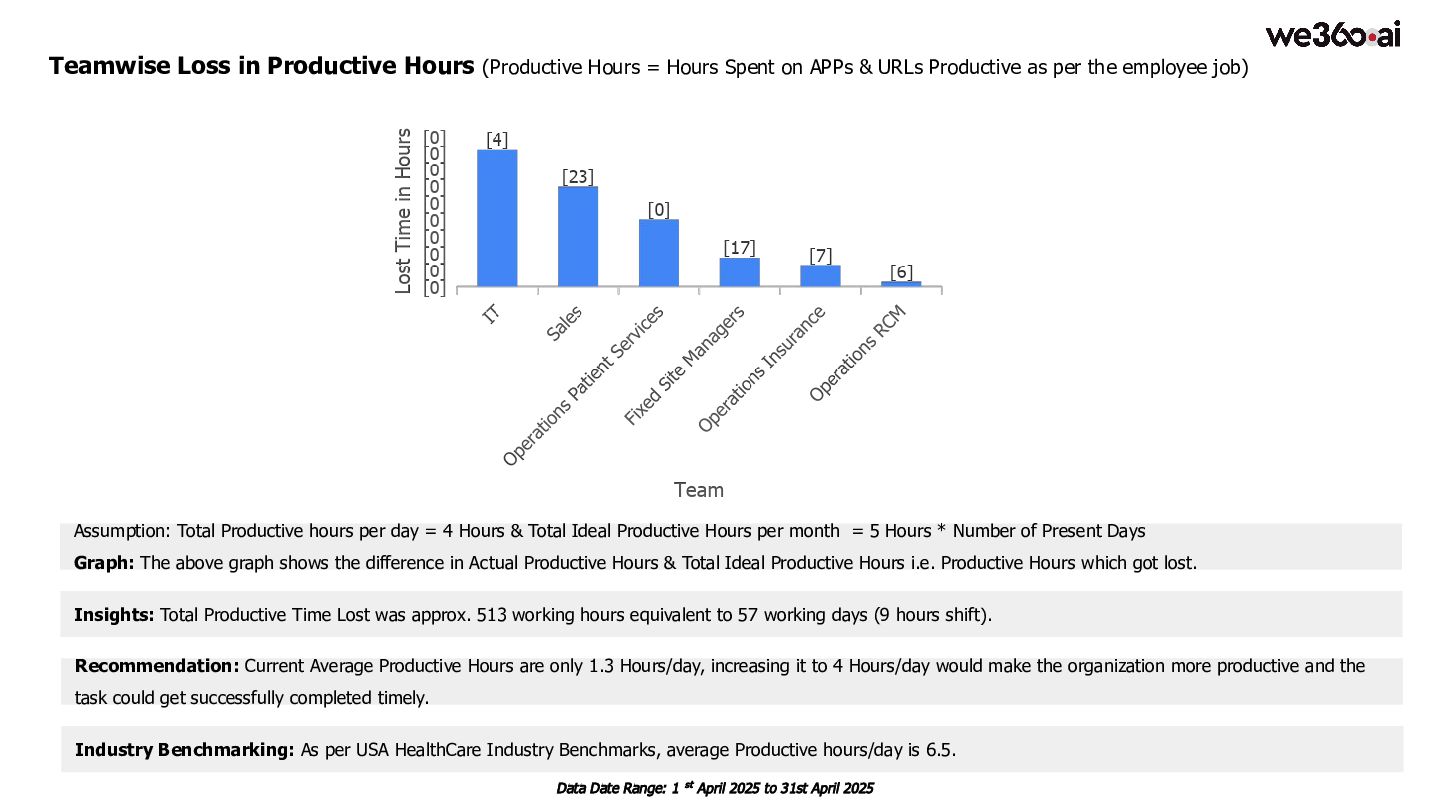
  4. 3 Teamwise Loss in Productive Hours (Productive Hours = Hours

    Spent on APPs & URLs Productive as per the employee job) Assumption: Total Productive hours per day = 4 Hours & Total Ideal Productive Hours per month = 5 Hours * Number of Present Days Graph: The above graph shows the difference in Actual Productive Hours & Total Ideal Productive Hours i.e. Productive Hours which got lost. Data Date Range: 1 st April 2025 to 31st April 2025 Insights: Total Productive Time Lost was approx. 513 working hours equivalent to 57 working days (9 hours shift). Recommendation: Current Average Productive Hours are only 1.3 Hours/day, increasing it to 4 Hours/day would make the organization more productive and the task could get successfully completed timely. Industry Benchmarking: As per USA HealthCare Industry Benchmarks, average Productive hours/day is 6.5.
  5. Combined Perspective from Online, Active & Productive Hours Data Date

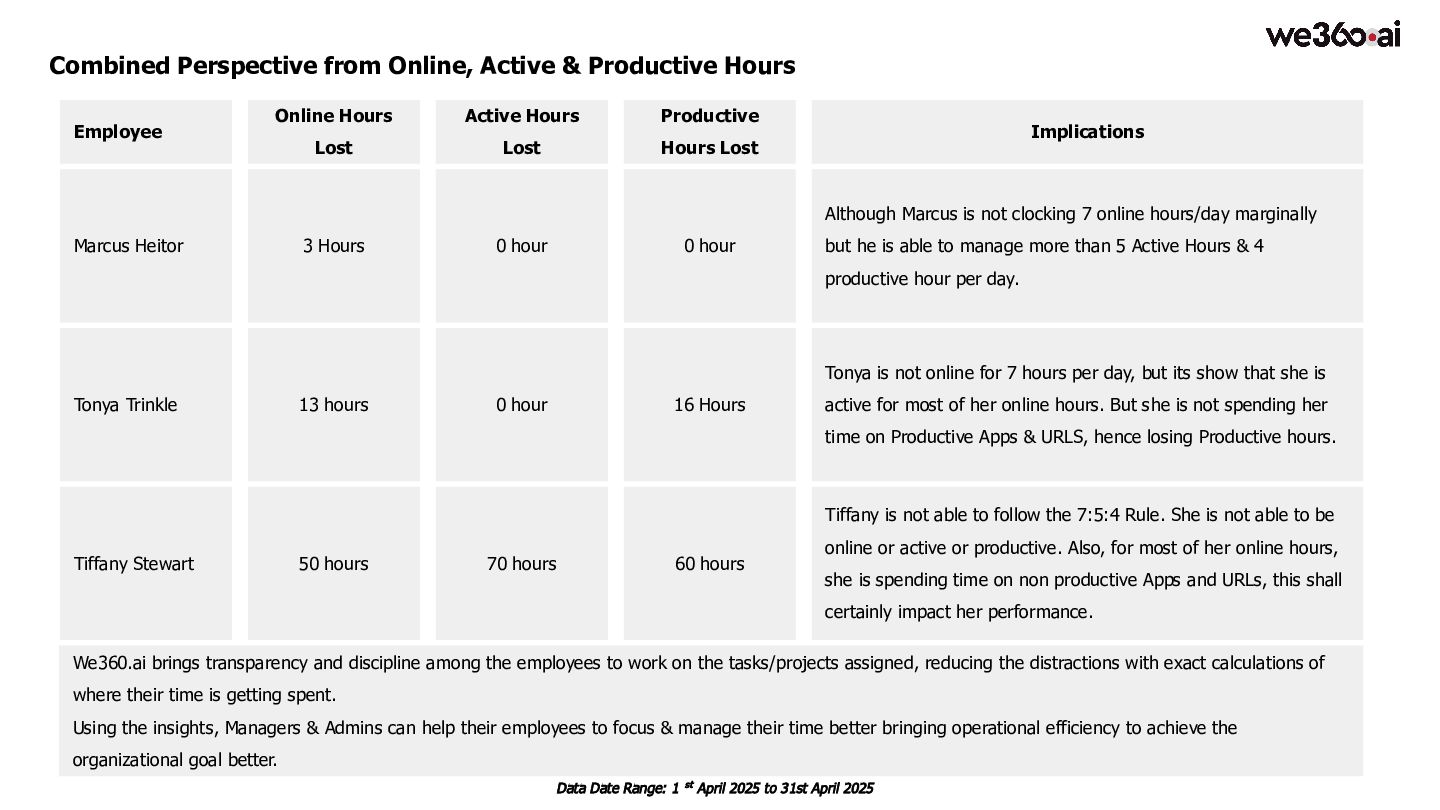
    Range: 1 st April 2025 to 31st April 2025 Employee Online Hours Lost Active Hours Lost Productive Hours Lost Implications Marcus Heitor 3 Hours 0 hour 0 hour Although Marcus is not clocking 7 online hours/day marginally but he is able to manage more than 5 Active Hours & 4 productive hour per day. Tiffany Stewart 50 hours 70 hours 60 hours Tiffany is not able to follow the 7:5:4 Rule. She is not able to be online or active or productive. Also, for most of her online hours, she is spending time on non productive Apps and URLs, this shall certainly impact her performance. Tonya Trinkle 13 hours 0 hour 16 Hours Tonya is not online for 7 hours per day, but its show that she is active for most of her online hours. But she is not spending her time on Productive Apps & URLS, hence losing Productive hours. We360.ai brings transparency and discipline among the employees to work on the tasks/projects assigned, reducing the distractions with exact calculations of where their time is getting spent. Using the insights, Managers & Admins can help their employees to focus & manage their time better bringing operational efficiency to achieve the organizational goal better.
  6. Financial Impact / ROI Data Date Range: 1 st April

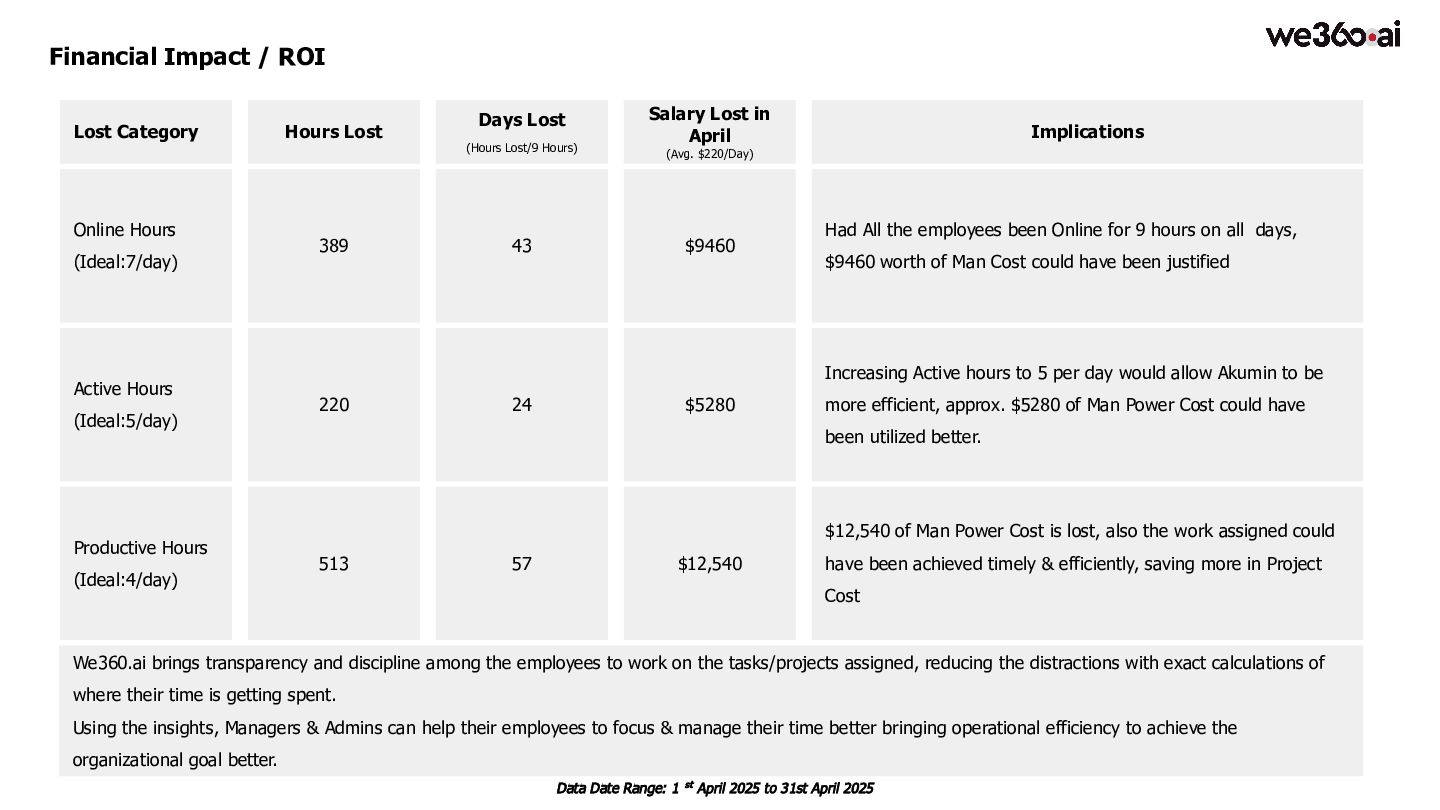
    2025 to 31st April 2025 Lost Category Hours Lost Days Lost (Hours Lost/9 Hours) Salary Lost in April (Avg. $220/Day) Implications Online Hours (Ideal:7/day) 389 43 $9460 Had All the employees been Online for 9 hours on all days, $9460 worth of Man Cost could have been justified Productive Hours (Ideal:4/day) 513 57 $12,540 $12,540 of Man Power Cost is lost, also the work assigned could have been achieved timely & efficiently, saving more in Project Cost Active Hours (Ideal:5/day) 220 24 $5280 Increasing Active hours to 5 per day would allow Akumin to be more efficient, approx. $5280 of Man Power Cost could have been utilized better. We360.ai brings transparency and discipline among the employees to work on the tasks/projects assigned, reducing the distractions with exact calculations of where their time is getting spent. Using the insights, Managers & Admins can help their employees to focus & manage their time better bringing operational efficiency to achieve the organizational goal better.
  7. 3 Top 5 Least Active & Least Productive Departments Graph:

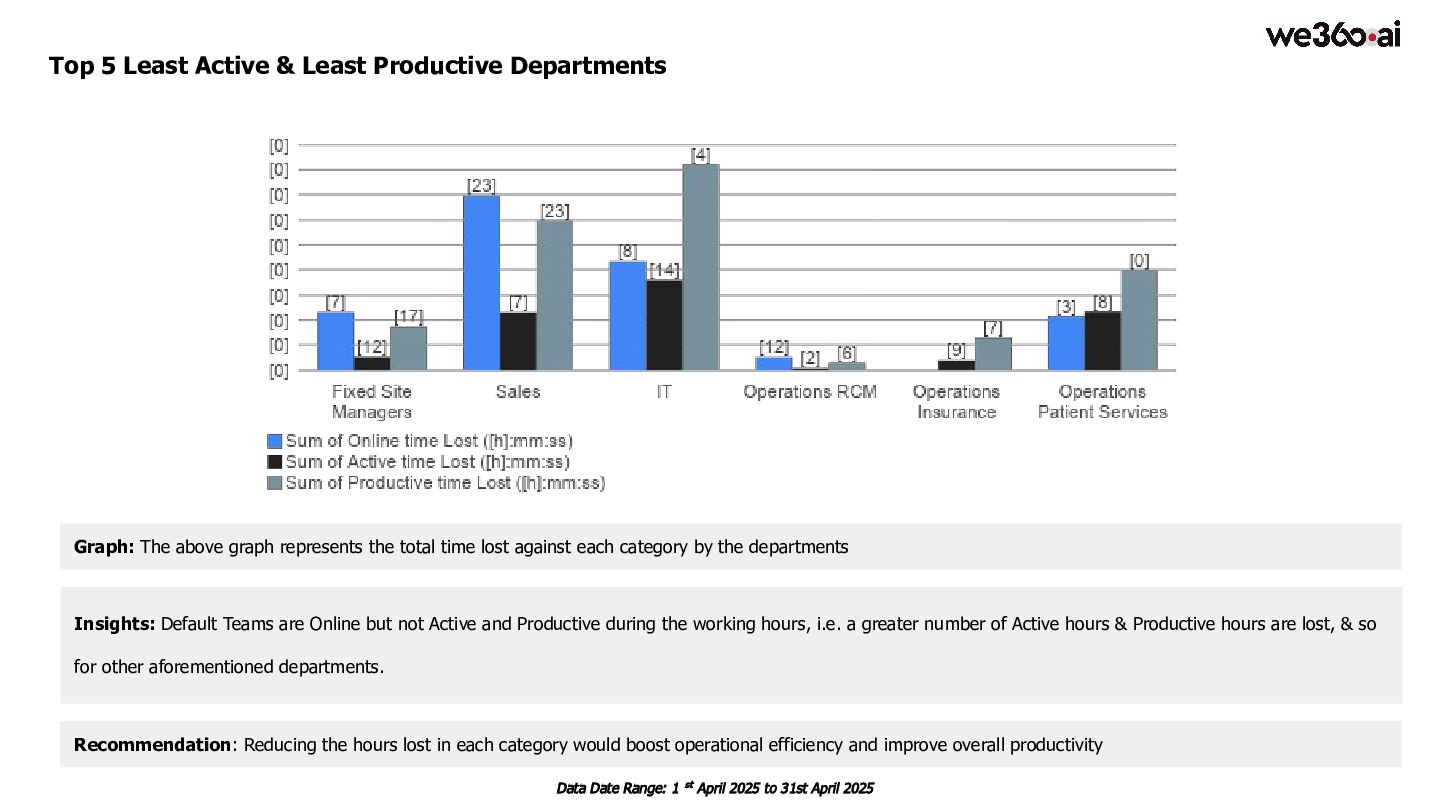
    The above graph represents the total time lost against each category by the departments Data Date Range: 1 st April 2025 to 31st April 2025 Insights: Default Teams are Online but not Active and Productive during the working hours, i.e. a greater number of Active hours & Productive hours are lost, & so for other aforementioned departments. Recommendation: Reducing the hours lost in each category would boost operational efficiency and improve overall productivity
  8. 3 Total Idle Hours (Online but not Active) Graph: The

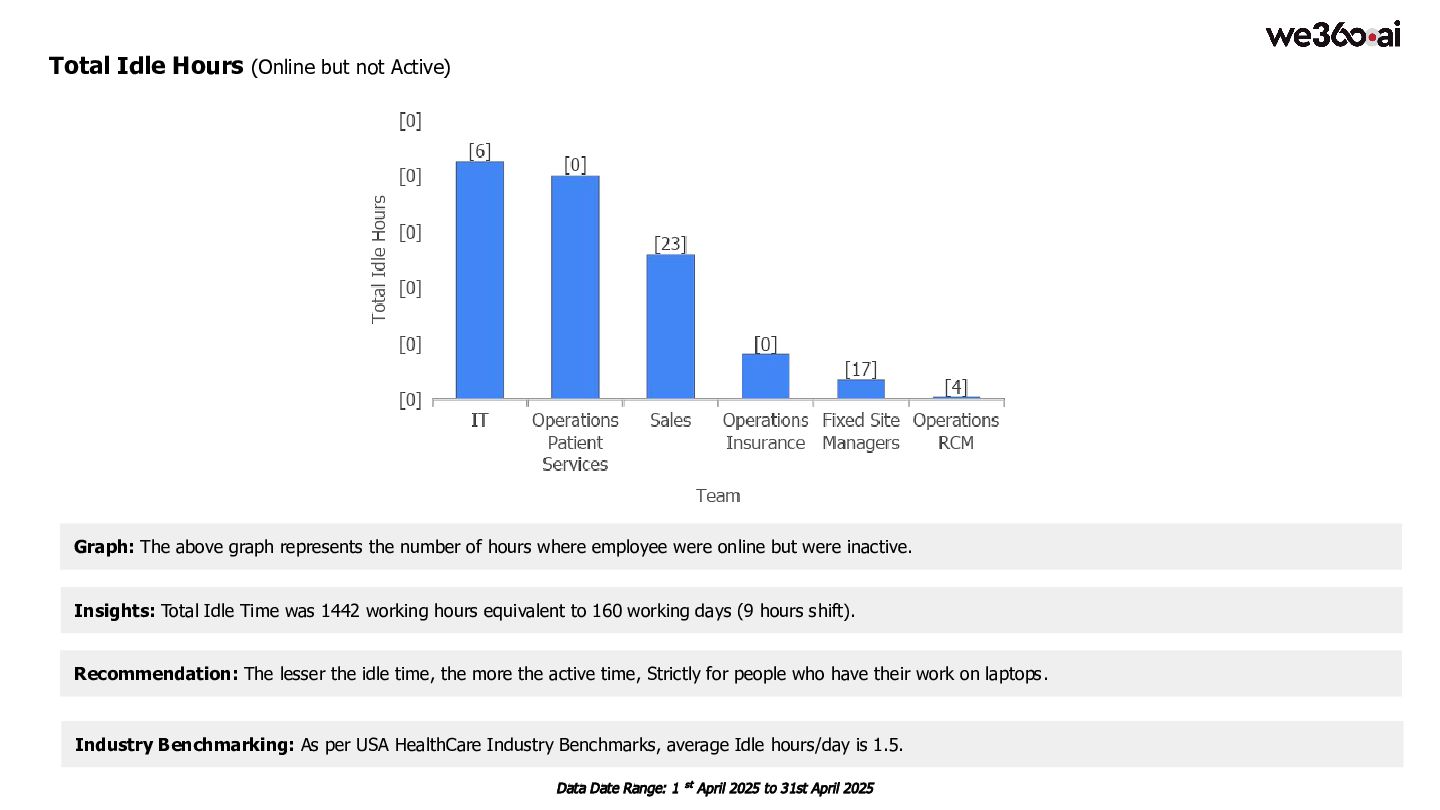
    above graph represents the number of hours where employee were online but were inactive. Data Date Range: 1 st April 2025 to 31st April 2025 Insights: Total Idle Time was 1442 working hours equivalent to 160 working days (9 hours shift). Recommendation: The lesser the idle time, the more the active time, Strictly for people who have their work on laptops. Industry Benchmarking: As per USA HealthCare Industry Benchmarks, average Idle hours/day is 1.5.
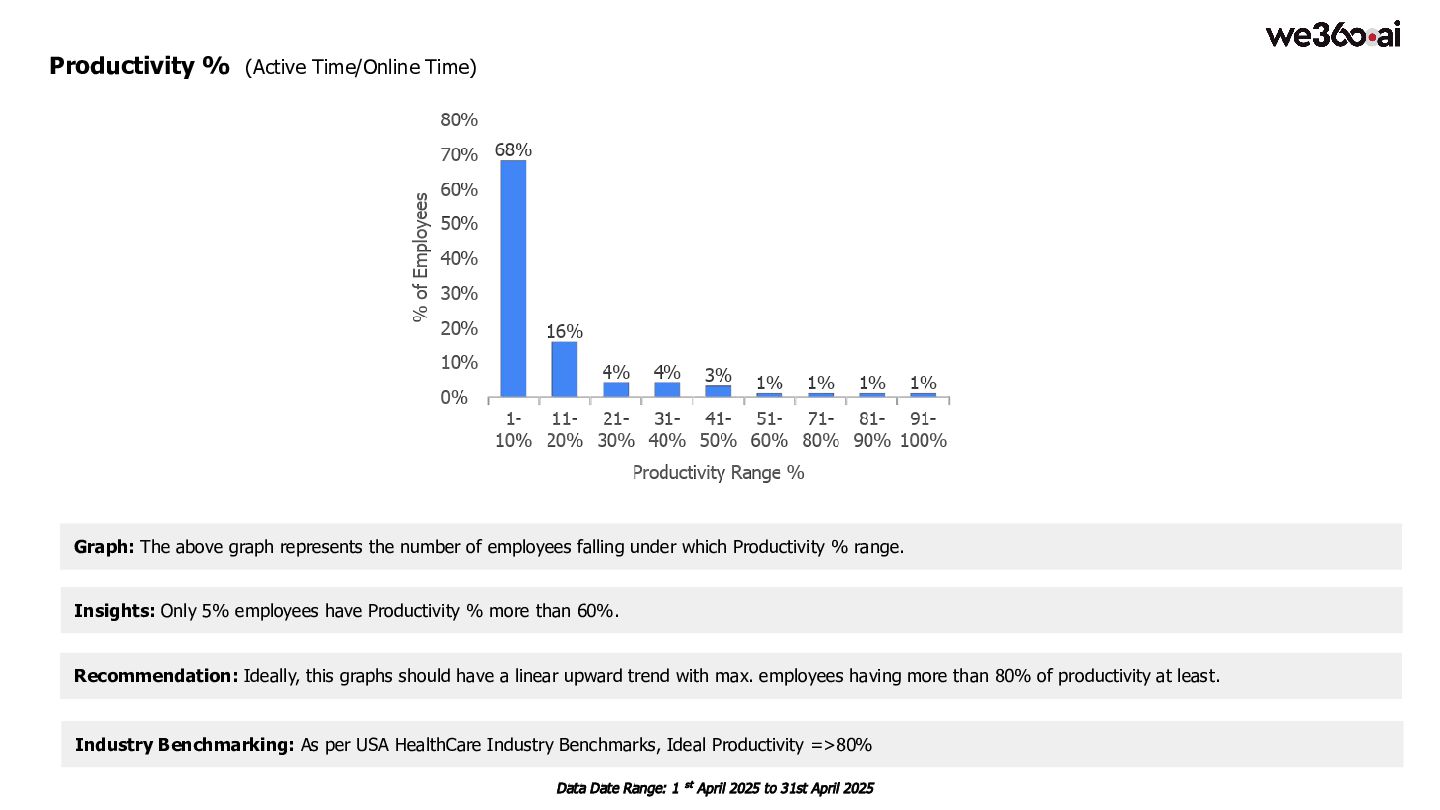
  9. 3 Productivity % (Active Time/Online Time) Graph: The above graph

    represents the number of employees falling under which Productivity % range. Data Date Range: 1 st April 2025 to 31st April 2025 Insights: Only 5% employees have Productivity % more than 60%. Recommendation: Ideally, this graphs should have a linear upward trend with max. employees having more than 80% of productivity at least. Industry Benchmarking: As per USA HealthCare Industry Benchmarks, Ideal Productivity =>80%
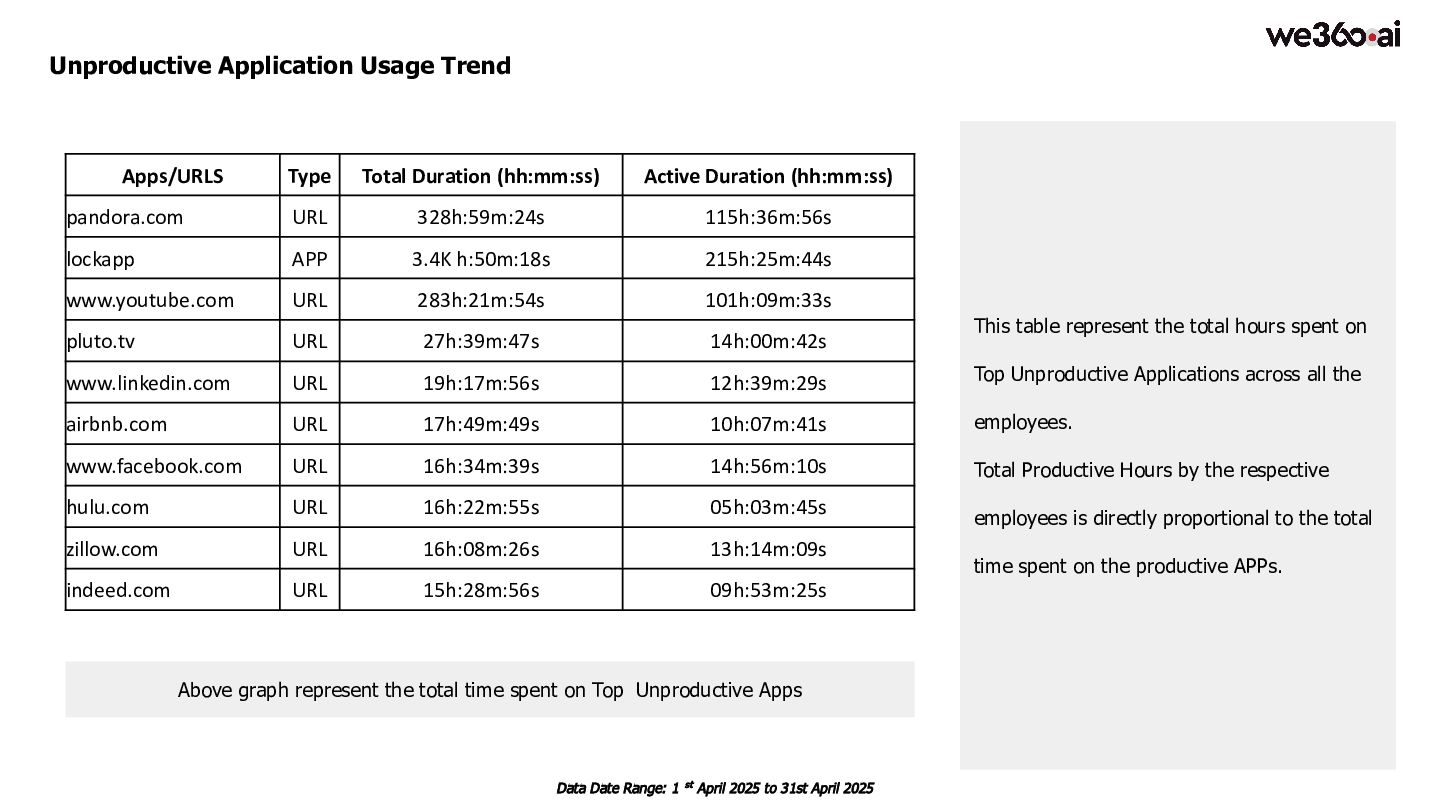
  10. 3 Unproductive Application Usage Trend Data Date Range: 1 st

    April 2025 to 31st April 2025 This table represent the total hours spent on Top Unproductive Applications across all the employees. Total Productive Hours by the respective employees is directly proportional to the total time spent on the productive APPs. Above graph represent the total time spent on Top Unproductive Apps Apps/URLS Type Total Duration (hh:mm:ss) Active Duration (hh:mm:ss) pandora.com URL 328h:59m:24s 115h:36m:56s lockapp APP 3.4K h:50m:18s 215h:25m:44s www.youtube.com URL 283h:21m:54s 101h:09m:33s pluto.tv URL 27h:39m:47s 14h:00m:42s www.linkedin.com URL 19h:17m:56s 12h:39m:29s airbnb.com URL 17h:49m:49s 10h:07m:41s www.facebook.com URL 16h:34m:39s 14h:56m:10s hulu.com URL 16h:22m:55s 05h:03m:45s zillow.com URL 16h:08m:26s 13h:14m:09s indeed.com URL 15h:28m:56s 09h:53m:25s
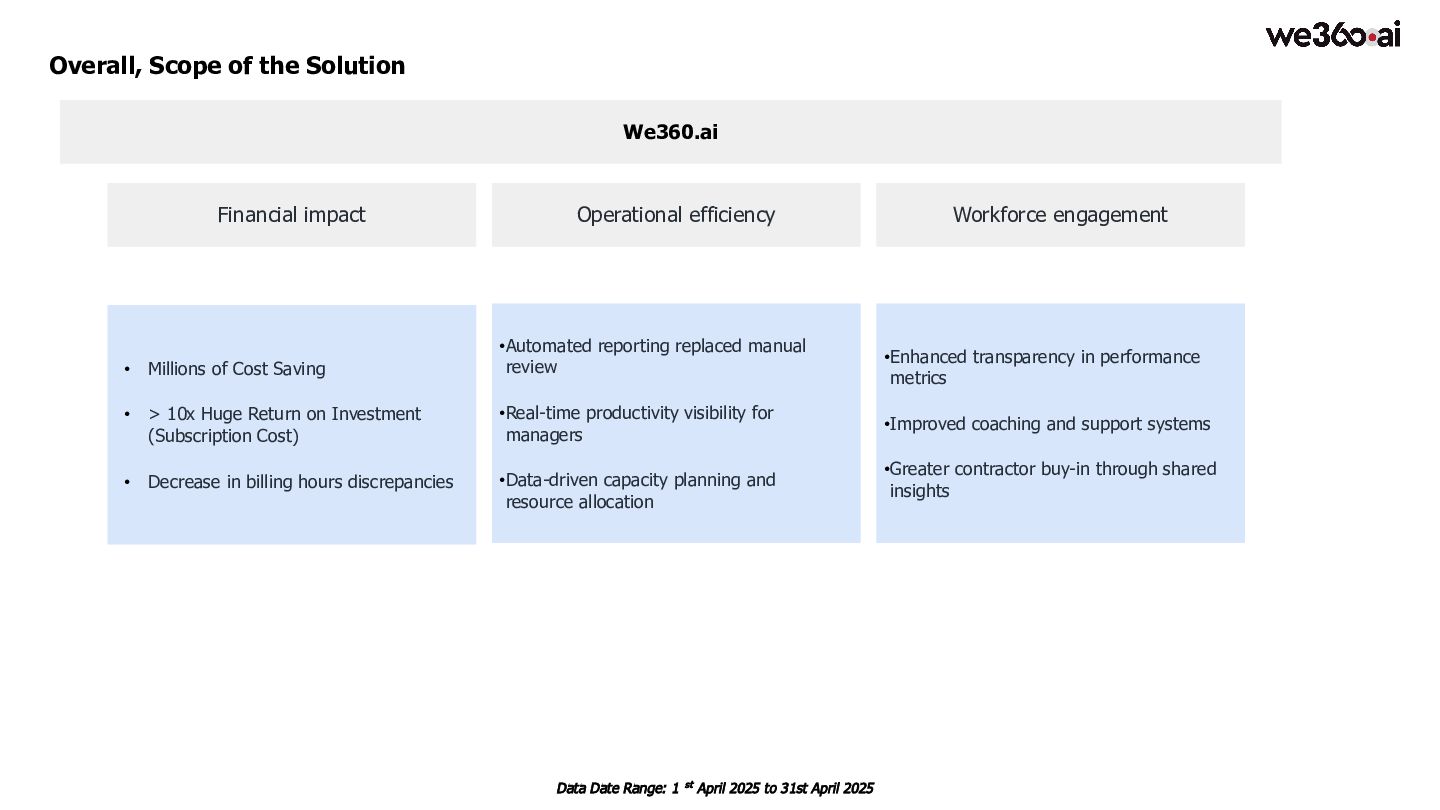
  11. Overall, Scope of the Solution Data Date Range: 1 st

    April 2025 to 31st April 2025 We360.ai Financial impact Workforce engagement Operational efficiency • Millions of Cost Saving • > 10x Huge Return on Investment (Subscription Cost) • Decrease in billing hours discrepancies •Automated reporting replaced manual review •Real-time productivity visibility for managers •Data-driven capacity planning and resource allocation •Enhanced transparency in performance metrics •Improved coaching and support systems •Greater contractor buy-in through shared insights
  12. Arnav Gupta Founder Chief Executive Officer ThankYou +91 846 1000

    400 First Floor,C6, IT Park, Bhopal Madhya Pradesh, India 462047