Upgrade to Pro — share decks privately, control downloads, hide ads and more …

Debug SilverStripe like a Pro

Debug SilverStripe like a Pro

xdebug talk by Lukas Erni and Werner M. Krauß at SilverStripe EU Conference in Ljubljana, Slovenia 2016 www.stripecon.eu

wernerkrauss

October 15, 2016
Tweet

More Decks by wernerkrauss

Other Decks in Programming

Transcript

  1. Who we are Werner M. Krauß alias wmk Hallstatt, Austria

    netwerkstatt.at Family, 2 kids > 5 guitars Lukas Erni alias lerni / munomono Ruswil, Switzerland kraftausdruck.ch Family, 2 kids Beekeeping
  2. I could search the bug now. Or I could hammer

    a nail into my knee. Where did I put the nails?
  3. 19th Century Hardware Engineering „The first step [in all of

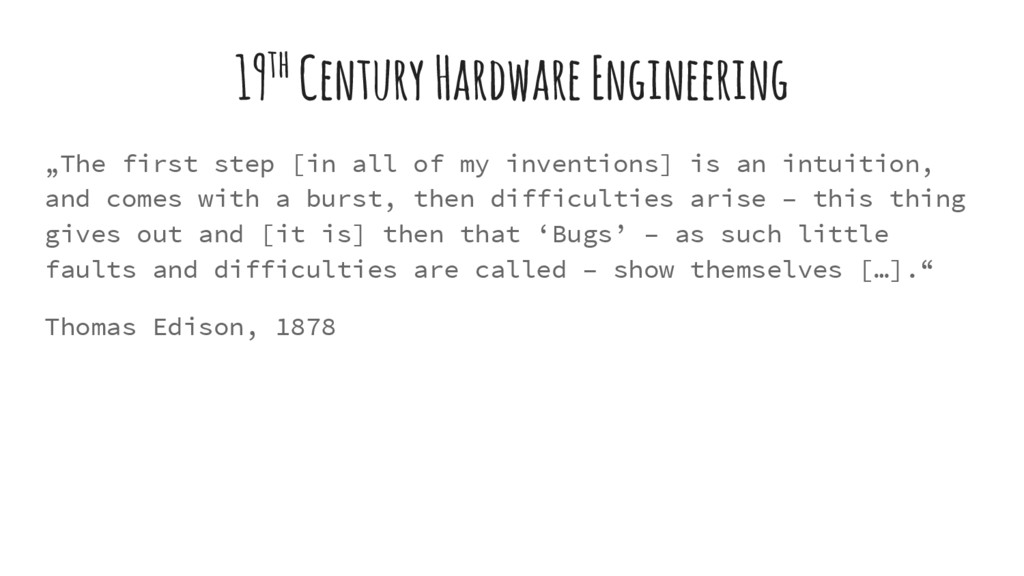
    my inventions] is an intuition, and comes with a burst, then difficulties arise – this thing gives out and [it is] then that ‘Bugs’ – as such little faults and difficulties are called – show themselves […].“ Thomas Edison, 1878
  4. The first Bug • 09.09.1947, Harvard Faculty at the Computation

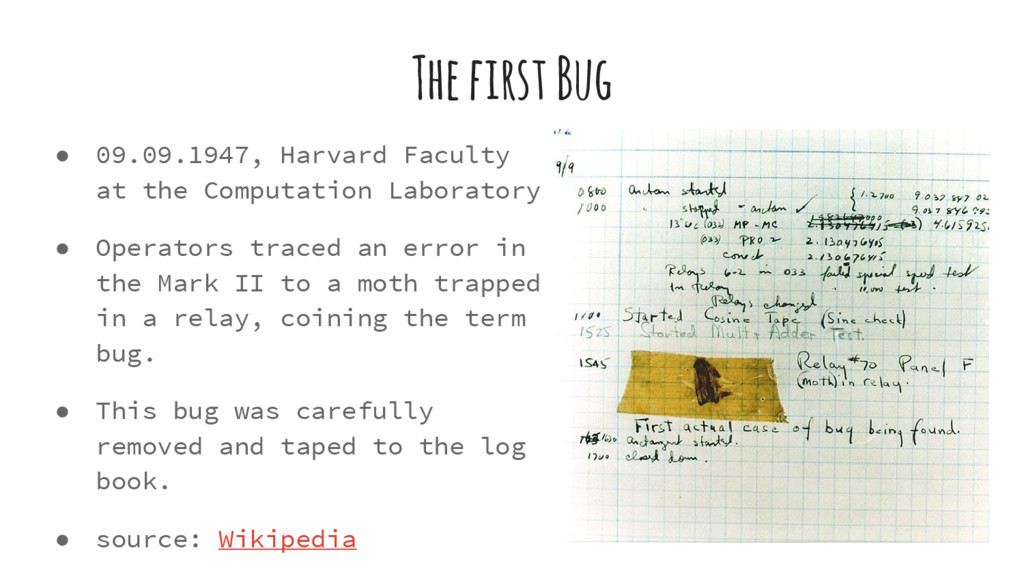
    Laboratory • Operators traced an error in the Mark II to a moth trapped in a relay, coining the term bug. • This bug was carefully removed and taped to the log book. • source: Wikipedia
  5. How this Talk came to Bee I’m personally not much

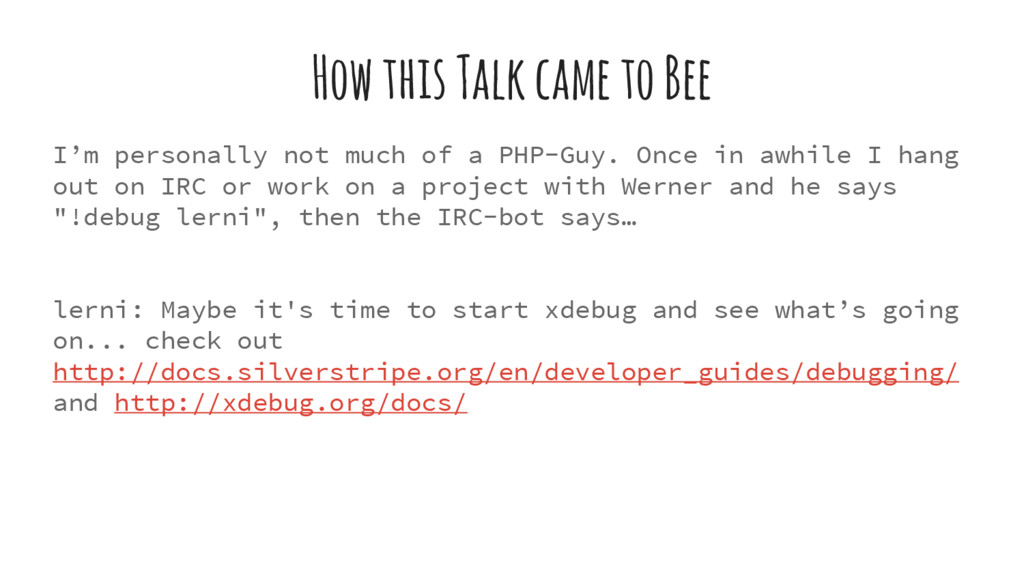
    of a PHP-Guy. Once in awhile I hang out on IRC or work on a project with Werner and he says "!debug lerni", then the IRC-bot says… lerni: Maybe it's time to start xdebug and see what’s going on... check out http://docs.silverstripe.org/en/developer_guides/debugging/ and http://xdebug.org/docs/
  6. Debug History • echo($var); • print_r($array); • die("I'm here"); •

    debug::show(...); • debug::dump(...); • debug::log(...);
  7. debug helpers There are Libs to help you show stuff

    more pretty. Like: https://github.com/raveren/kint
  8. SilverStripe Debug Parameters • ?isDev=1 Put the site into development

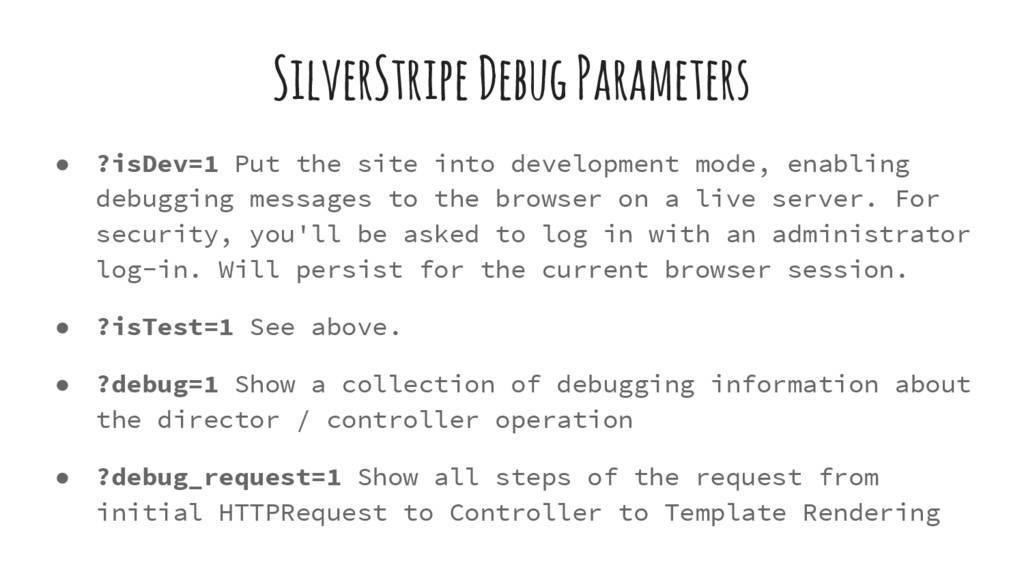
    mode, enabling debugging messages to the browser on a live server. For security, you'll be asked to log in with an administrator log-in. Will persist for the current browser session. • ?isTest=1 See above. • ?debug=1 Show a collection of debugging information about the director / controller operation • ?debug_request=1 Show all steps of the request from initial HTTPRequest to Controller to Template Rendering
  9. Silverstripe Debug Parameters #2 • ?showqueries=1 List all SQL queries

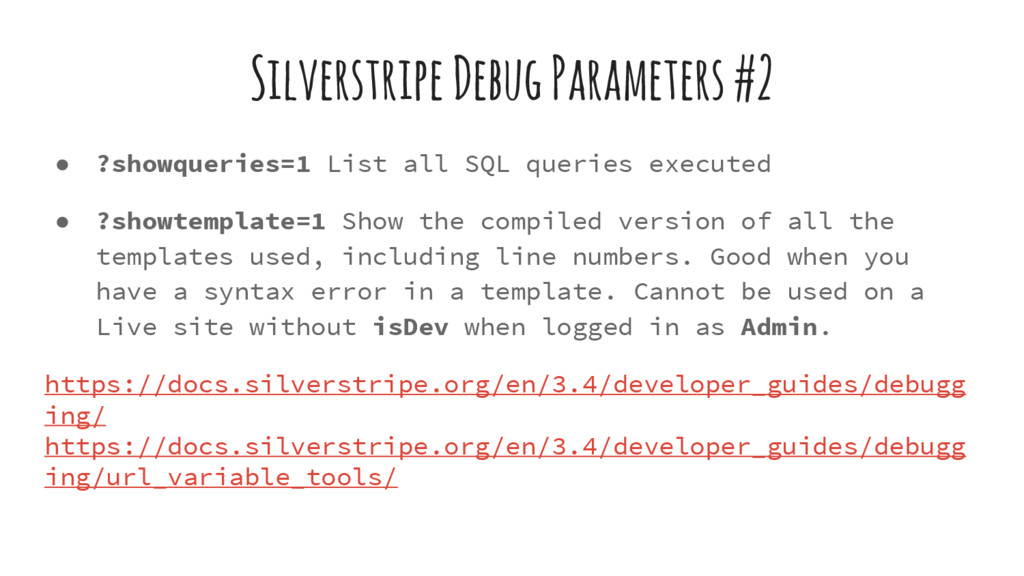
    executed • ?showtemplate=1 Show the compiled version of all the templates used, including line numbers. Good when you have a syntax error in a template. Cannot be used on a Live site without isDev when logged in as Admin. https://docs.silverstripe.org/en/3.4/developer_guides/debugg ing/ https://docs.silverstripe.org/en/3.4/developer_guides/debugg ing/url_variable_tools/
  10. SilverStripe DebugBar Module https://github.com/lekoala/silverstripe-debugbar This module shows a nice DebugBar

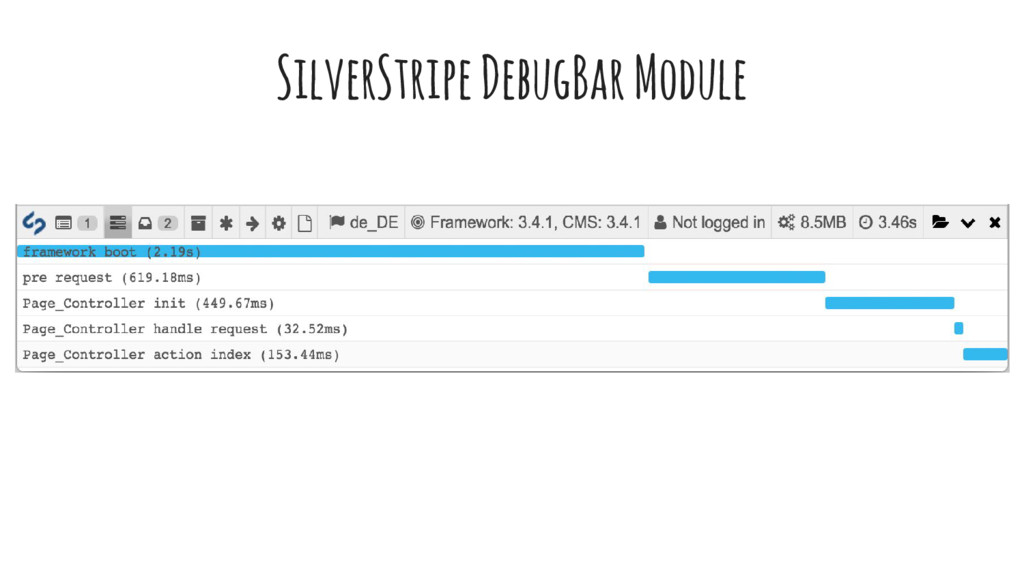
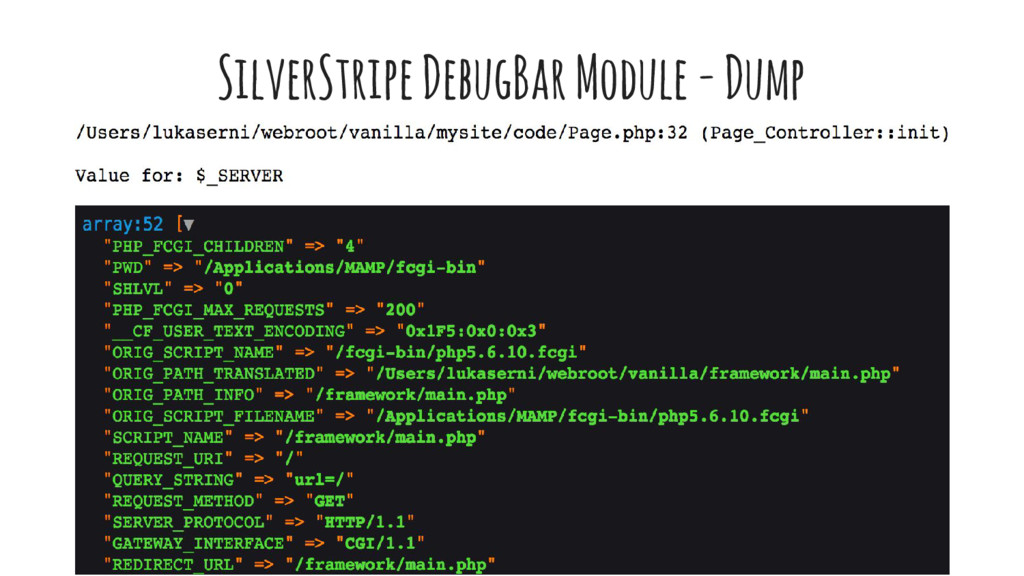
    on the bottom of your page • execution time overview. • show messages l($var) to the DebugBar, • trace where queries come from. • ?showqueries=1 and also dump d($obj) look pretty.
  11. so, why xdebug? • On-the-fly debugging • Breakpoints - no

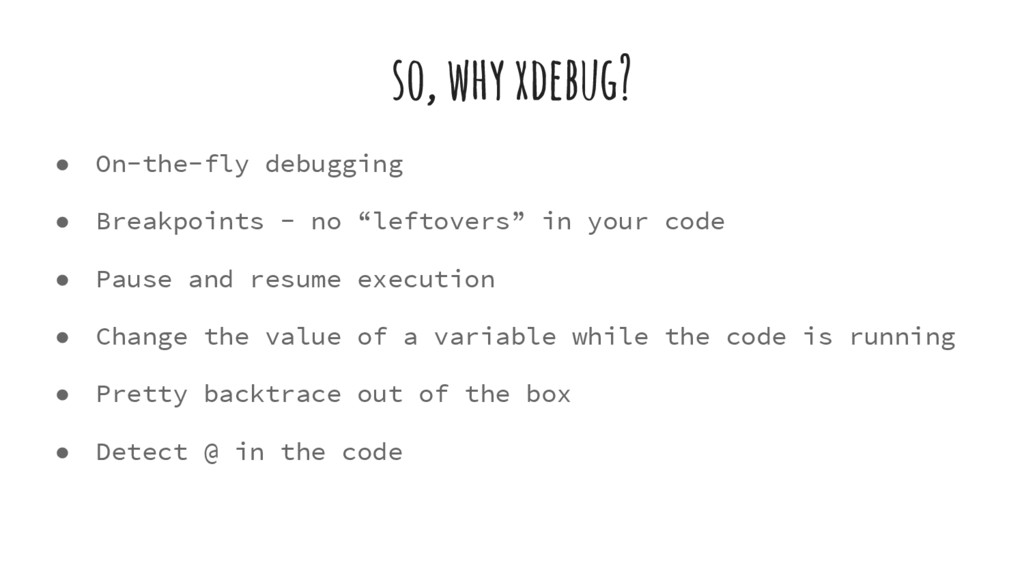
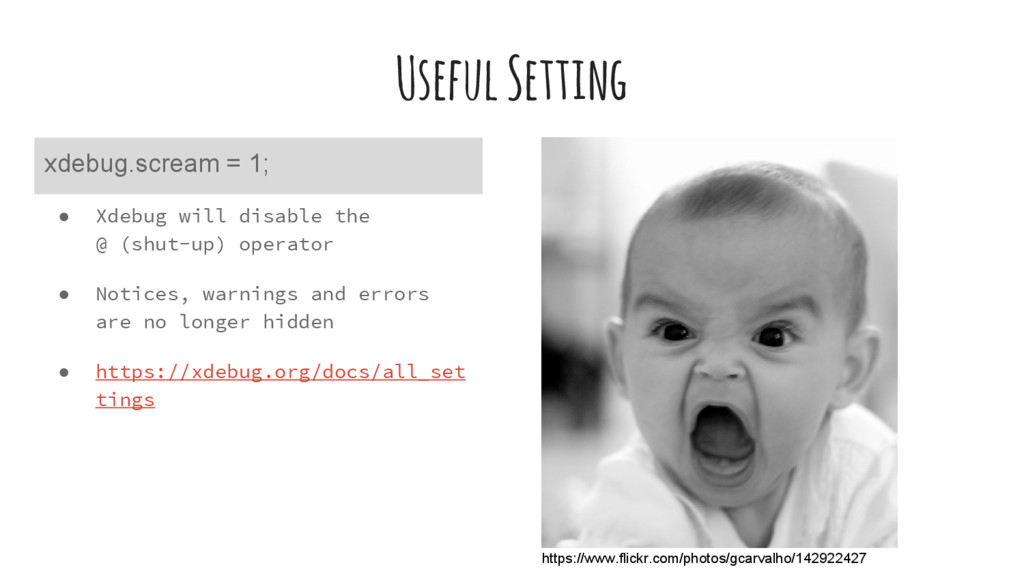
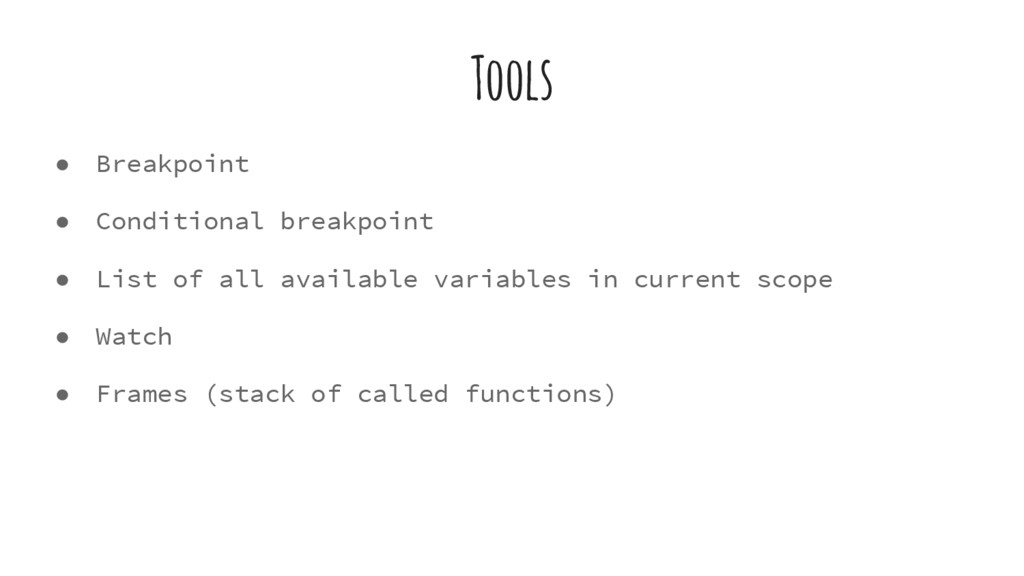
    “leftovers” in your code • Pause and resume execution • Change the value of a variable while the code is running • Pretty backtrace out of the box • Detect @ in the code
  12. How xdebug works • PHP extension (PEAR/PECL) • Installed on

    server • Uses DBGp debugging protocol • Preinstalled on many setups like XAMP or vagrant boxes
  13. php.ini • Xdebug slows down execution, just enable what’s needed.

    [xdebug] xdebug.remote_enable=1 debug.remote_host=localhost xdebug.remote_port=9000 Basic localhost:
  14. Useful Setting • Xdebug will disable the @ (shut-up) operator

    • Notices, warnings and errors are no longer hidden • https://xdebug.org/docs/all_set tings xdebug.scream = 1; https://www.flickr.com/photos/gcarvalho/142922427
  15. • Configure server address • Configure path mapping for Remote-Debugging

    • Setup bookmarklets for debugging (and profiling) https://www.jetbrains.com/phpstorm/marklets/ IDE-Setup
  16. Tools • Breakpoint • Conditional breakpoint • List of all

    available variables in current scope • Watch • Frames (stack of called functions)
  17. Methods Step Over => goto next line (F8) Step Into

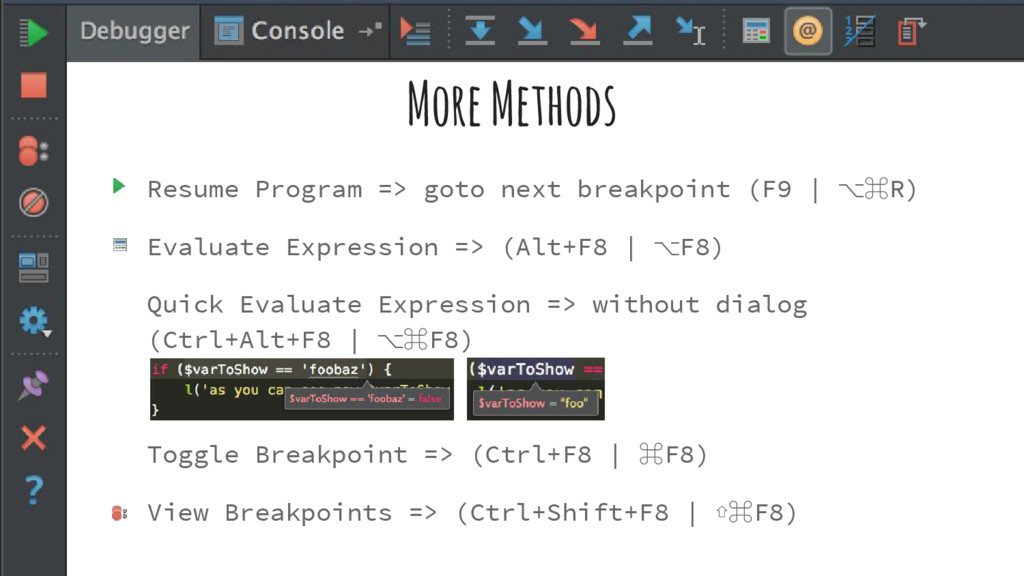
    => go inside a called function or method (F7) Force Step Into => (Shift+Alt+F7 | ⌥⇧F7) Step Out => leave the current function (Shift+F8 | ⇧F8) Run to Cursor => (Alt+F9 | ⌥F9)
  18. More Methods Resume Program => goto next breakpoint (F9 |

    ⌥⌘R) Evaluate Expression => (Alt+F8 | ⌥F8) Quick Evaluate Expression => without dialog (Ctrl+Alt+F8 | ⌥⌘F8) Toggle Breakpoint => (Ctrl+F8 | ⌘F8) View Breakpoints => (Ctrl+Shift+F8 | ⇧⌘F8)
  19. Debugging a Failing Unit Test • Debug (remote) CLI •

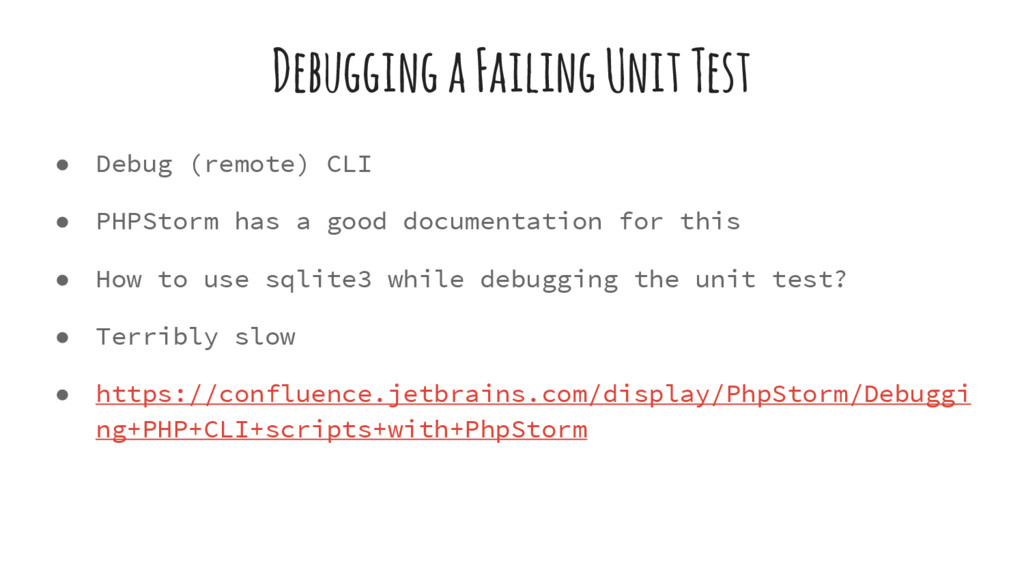
    PHPStorm has a good documentation for this • How to use sqlite3 while debugging the unit test? • Terribly slow • https://confluence.jetbrains.com/display/PhpStorm/Debuggi ng+PHP+CLI+scripts+with+PhpStorm
  20. Your Site is too slow (it is..) • Faster machine

    • Opcache • Use lastest and fastest PHP • Partial caching • Static publisher module • ... • Maybe it’s just bad, slow code?
  21. Pro-File it with Xdebug! • Helps finding bottlenecks ◦ useful

    for guitarists! • Runs on the server • Logs time and memory consumption of each function call • Outputs a cachegrind file (can be very big)
  22. • Use bookmarklets for start and stop php.ini xdebug.profiler_enable=0 xdebug.profiler_enable_trigger

    = 1; #enable by trigger xdebug.profiler_output_dir="/path/to/logs/debug" profiling:
  23. • Zend Debugger (comes bundled with a Zend Server) •

    phpdbg (bundled with 5.6 but not supported by PhpStorm) ◦ not a real step debugger? Ok, we’ve found some - in Theory
  24. Q&A

  25. Q&A • Does this all make sense to you? •

    How do you handle debugging? • Anybody wants to show something?