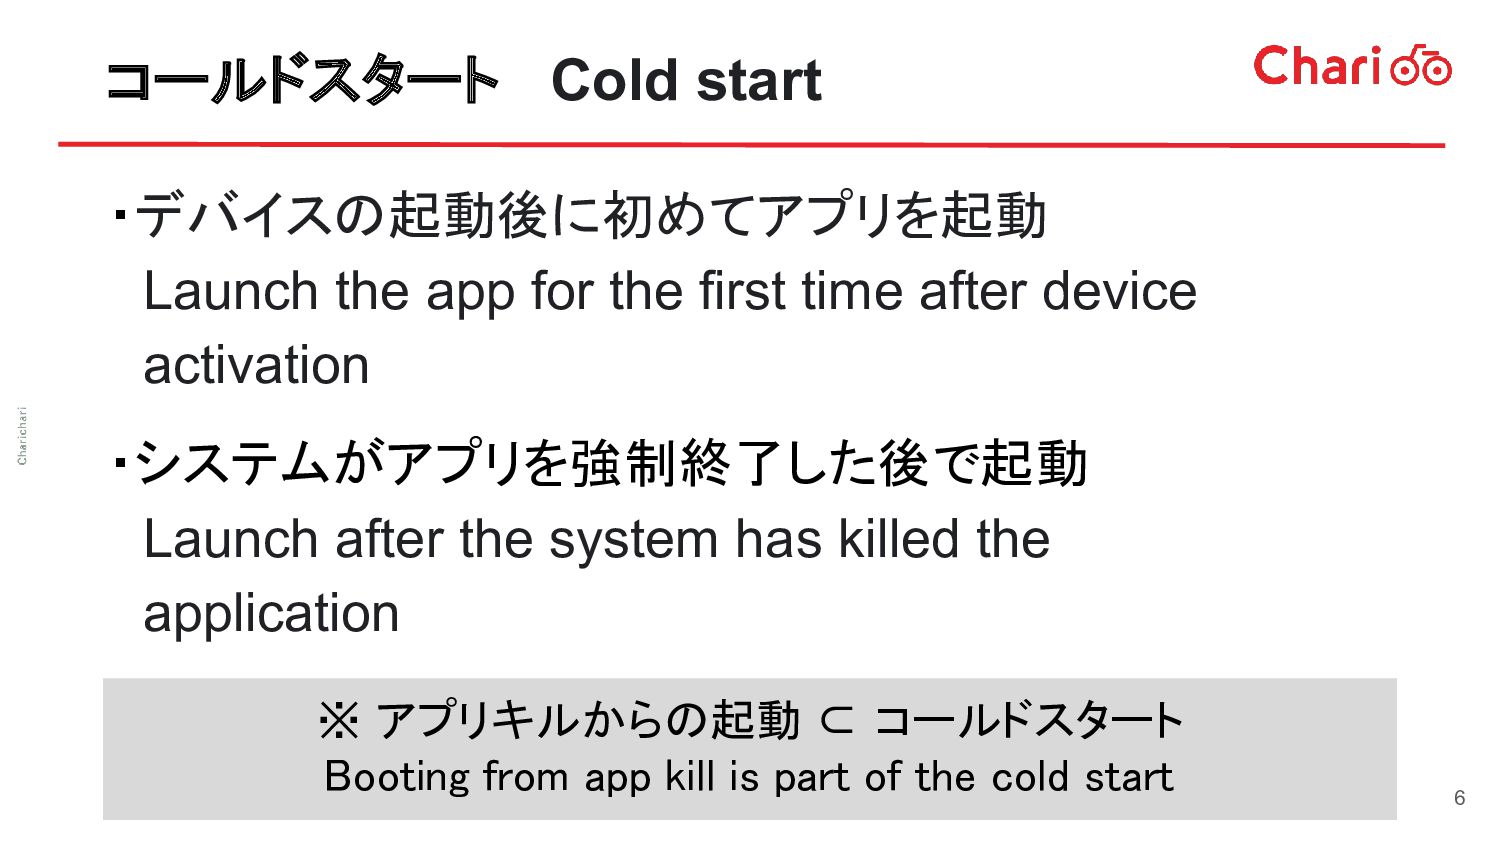
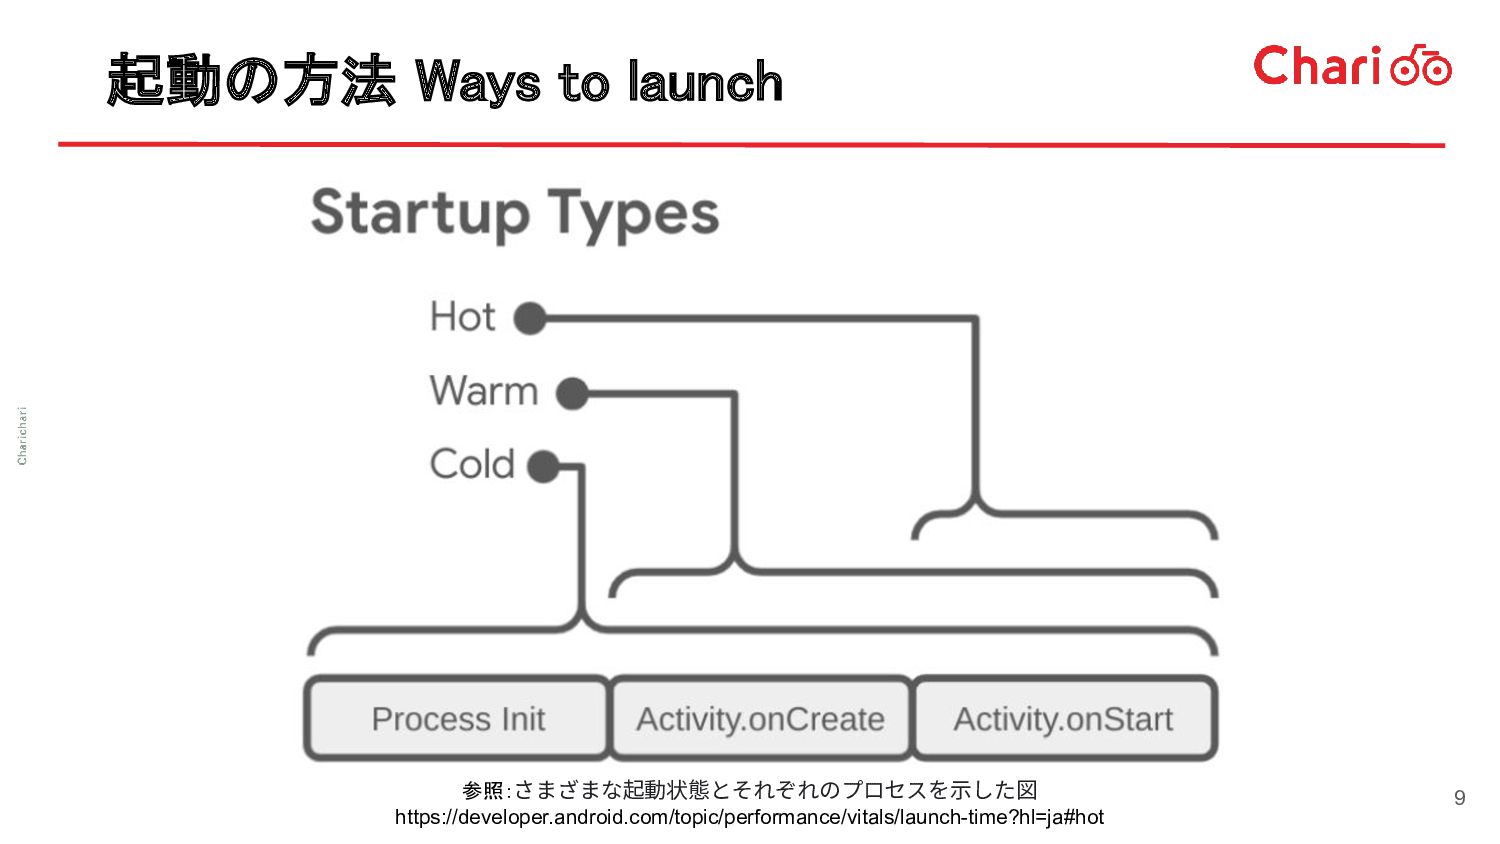
time after device activation ・システムがアプリを強制終了した後で起動 Launch after the system has killed the application ※ アプリキルからの起動 ⊂ コールドスタート Booting from app kill is part of the cold start 6
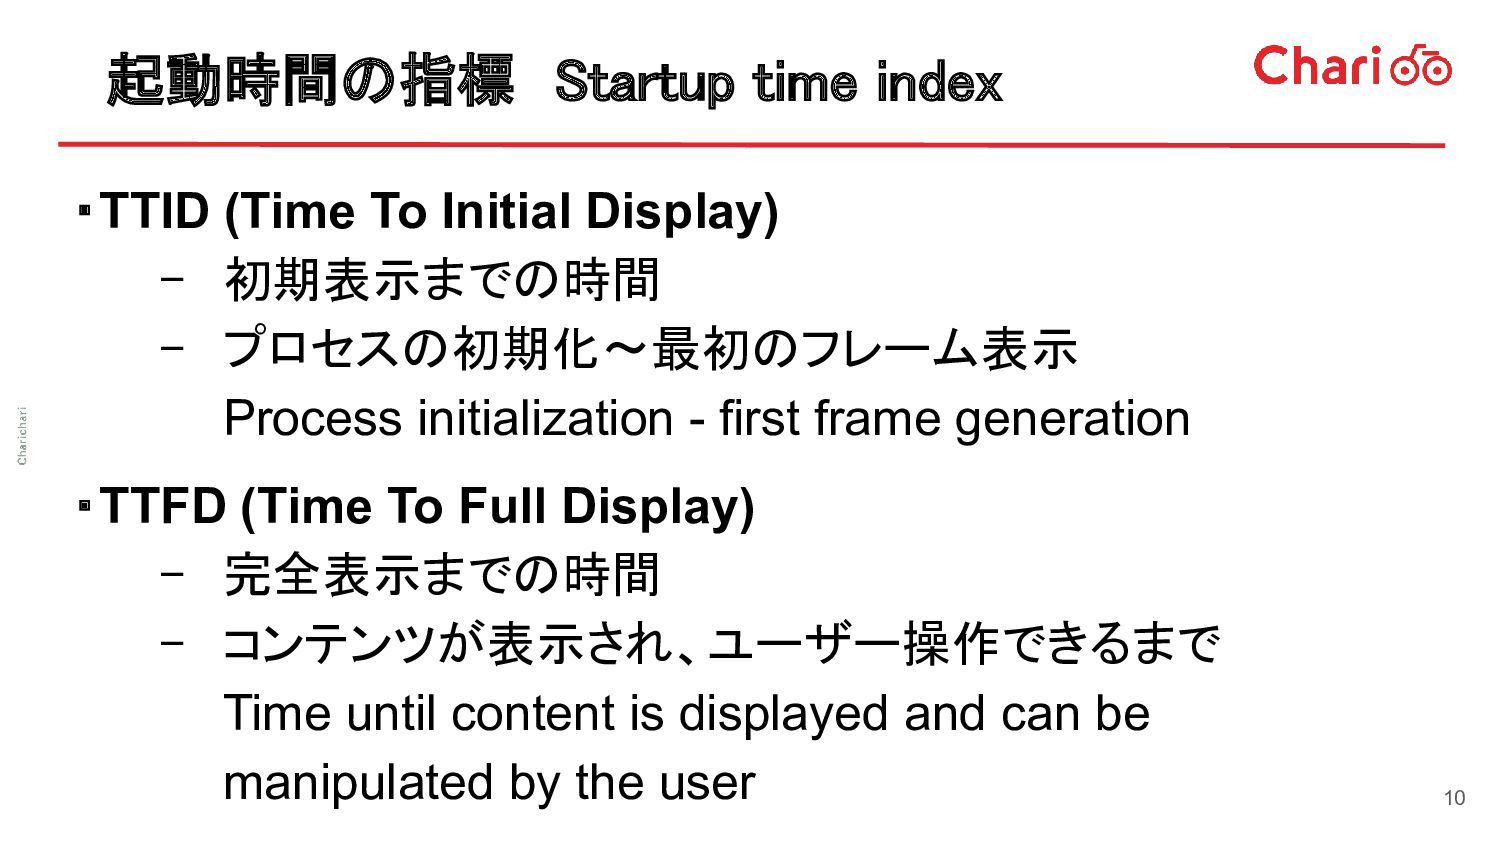
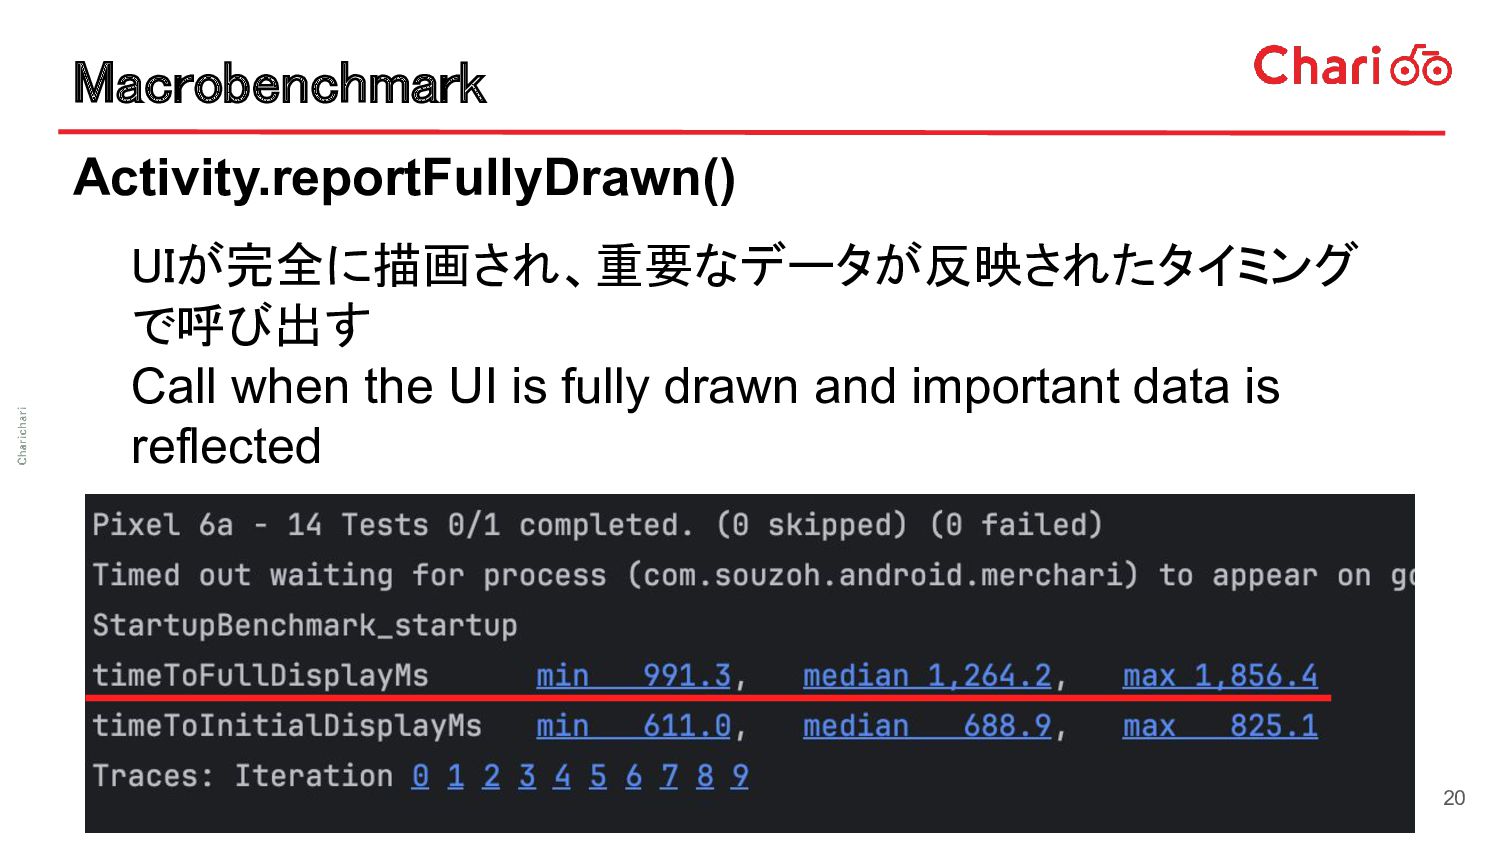
initialization - first frame generation 起動時間の指標 Startup time index ・TTFD (Time To Full Display) - 完全表示までの時間 - コンテンツが表示され、ユーザー操作できるまで Time until content is displayed and can be manipulated by the user 10
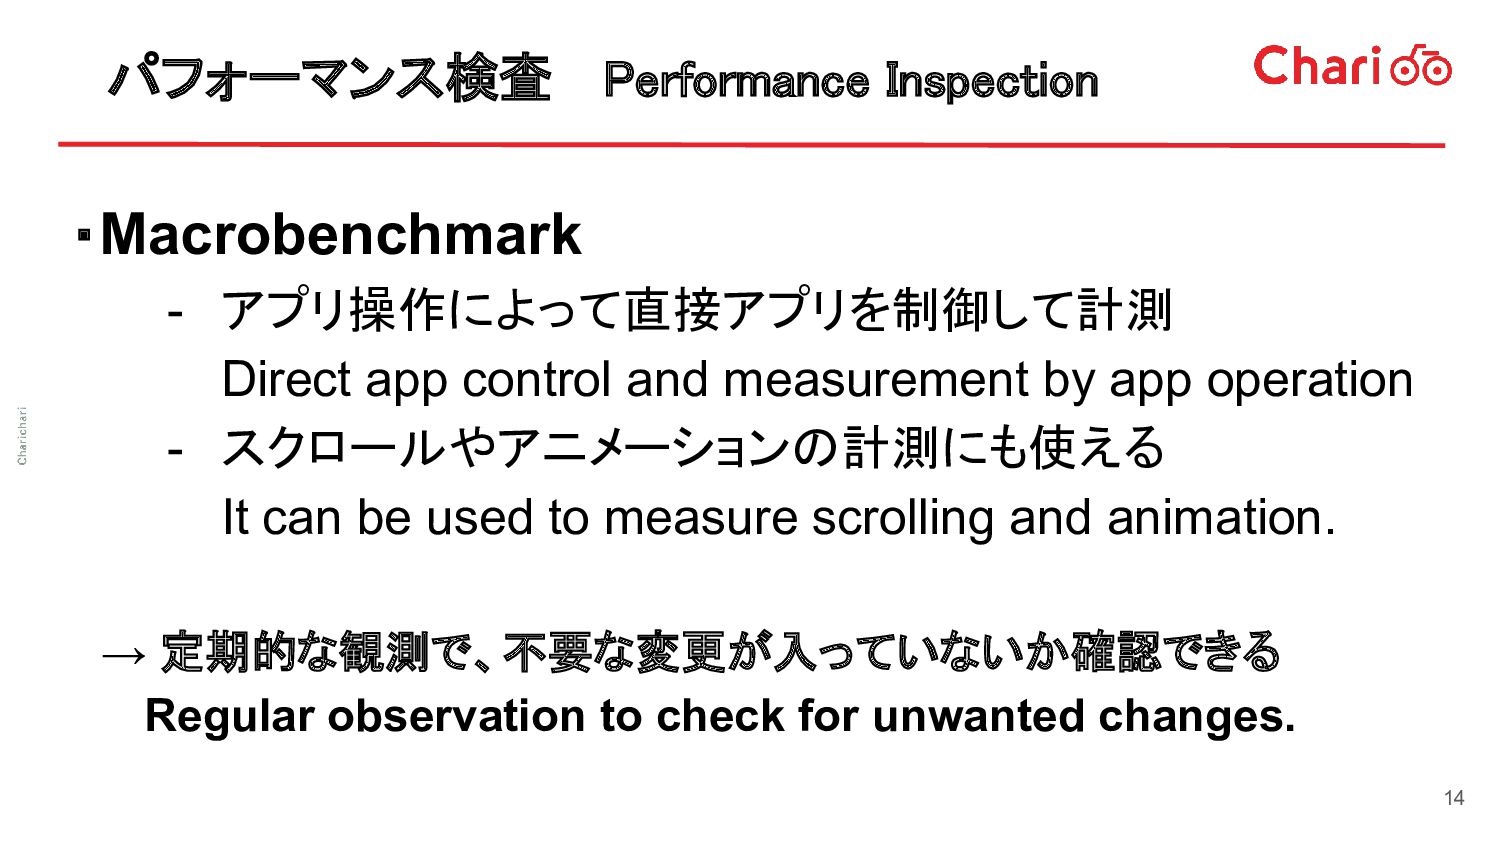
measurement by app operation - スクロールやアニメーションの計測にも使える It can be used to measure scrolling and animation. → 定期的な観測で、不要な変更が入っていないか確認できる Regular observation to check for unwanted changes. 14
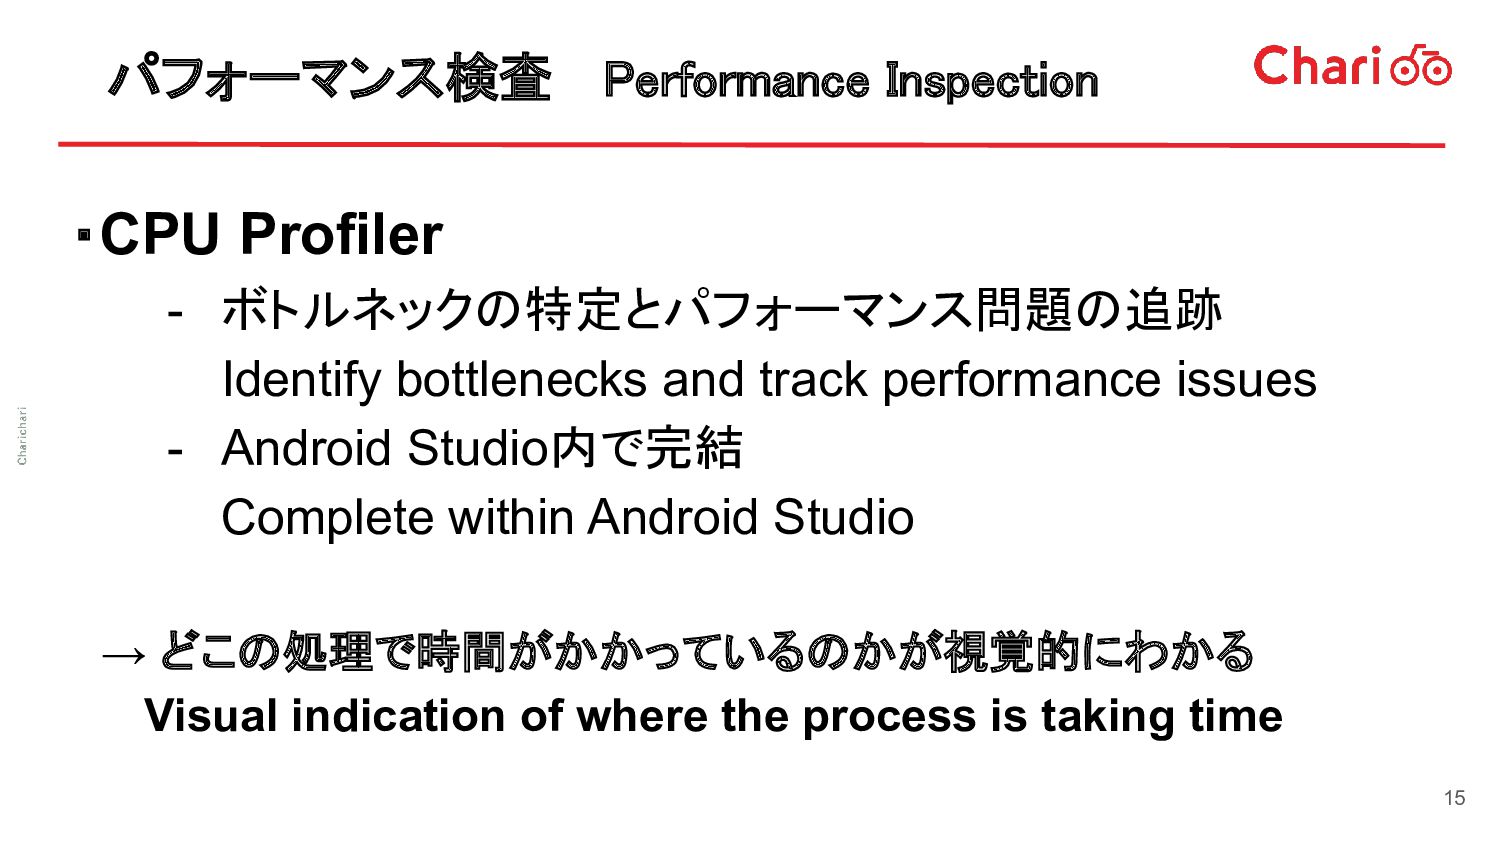
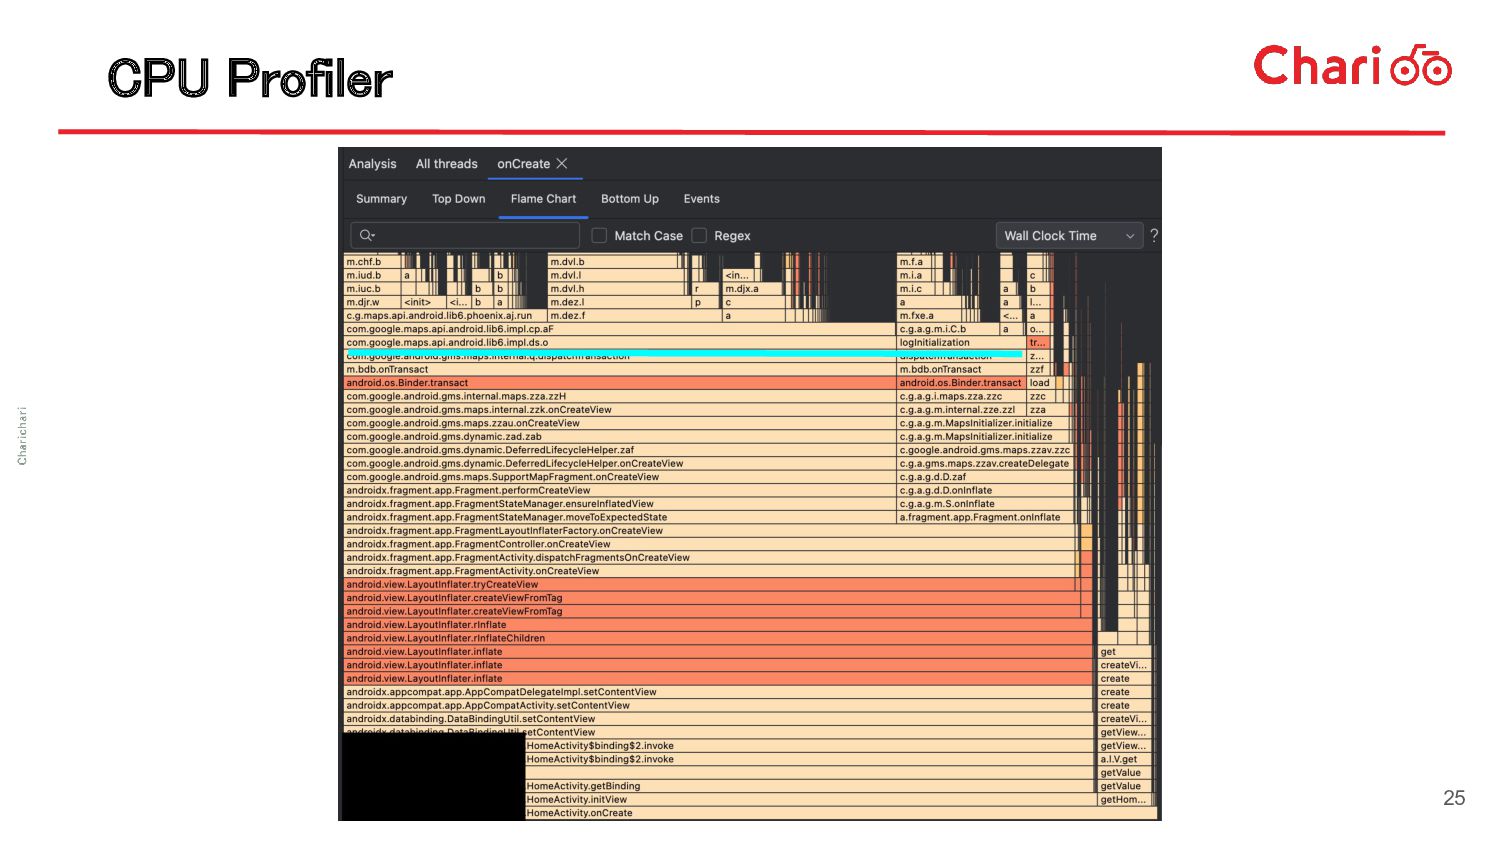
track performance issues - Android Studio内で完結 Complete within Android Studio → どこの処理で時間がかかっているのかが視覚的にわかる Visual indication of where the process is taking time 15
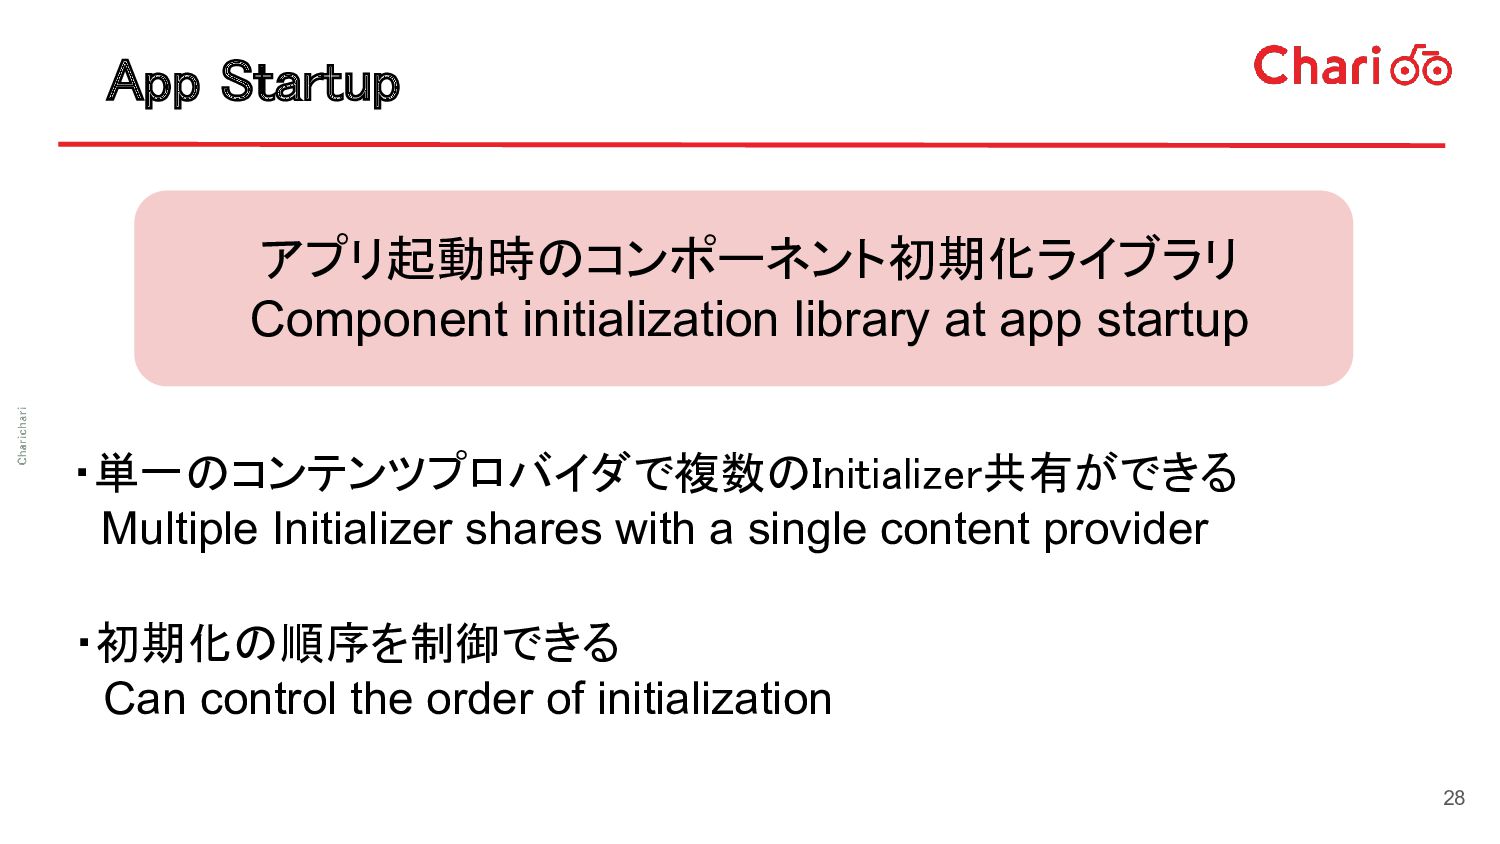
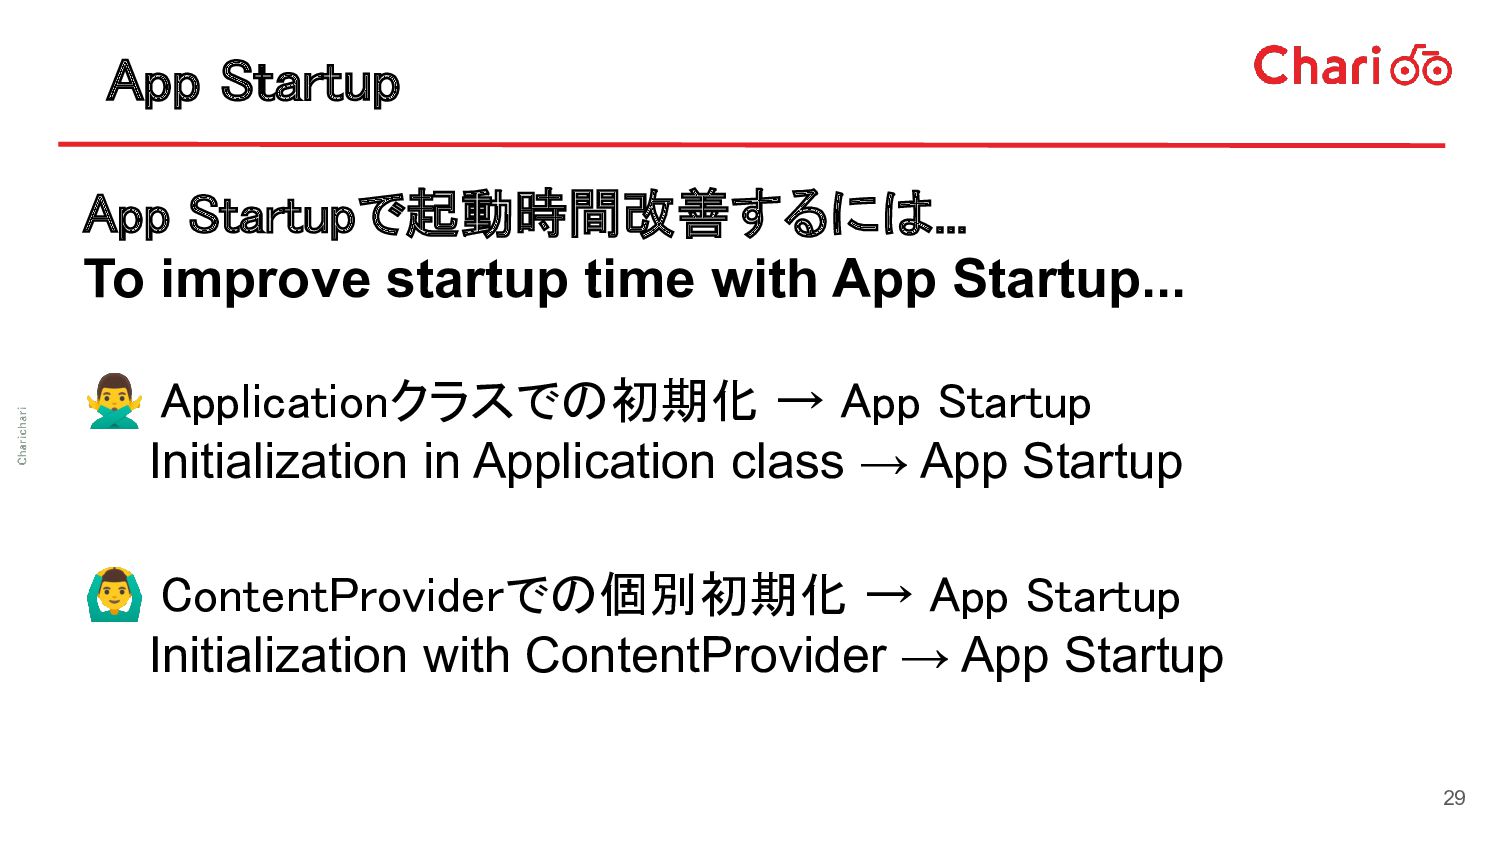
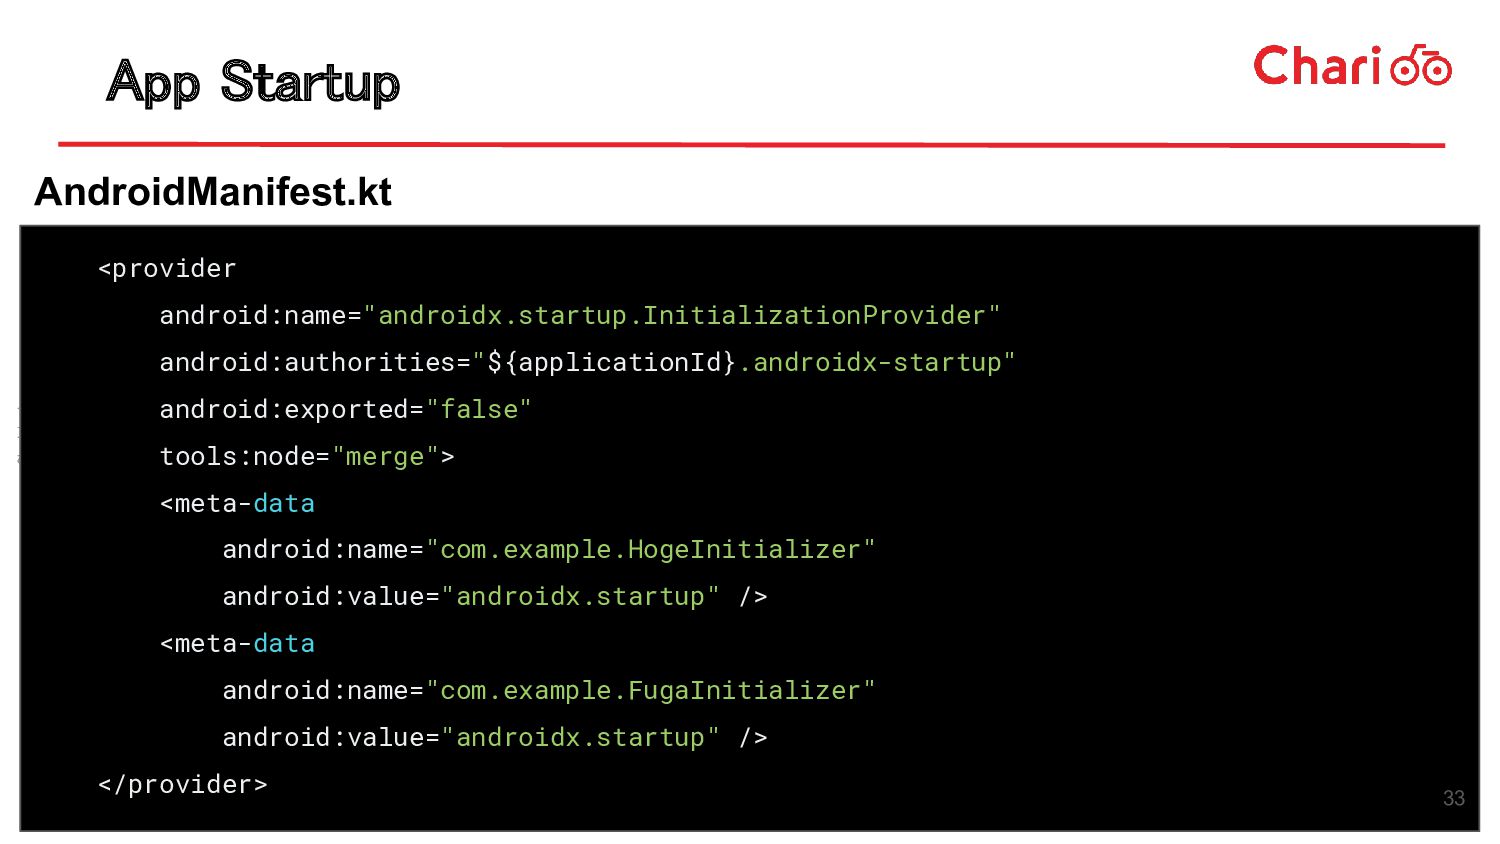
→ App Startup Applicationクラスでの初期化 → App Startup Initialization in Application class → App Startup App Startupで起動時間改善するには... To improve startup time with App Startup... 29
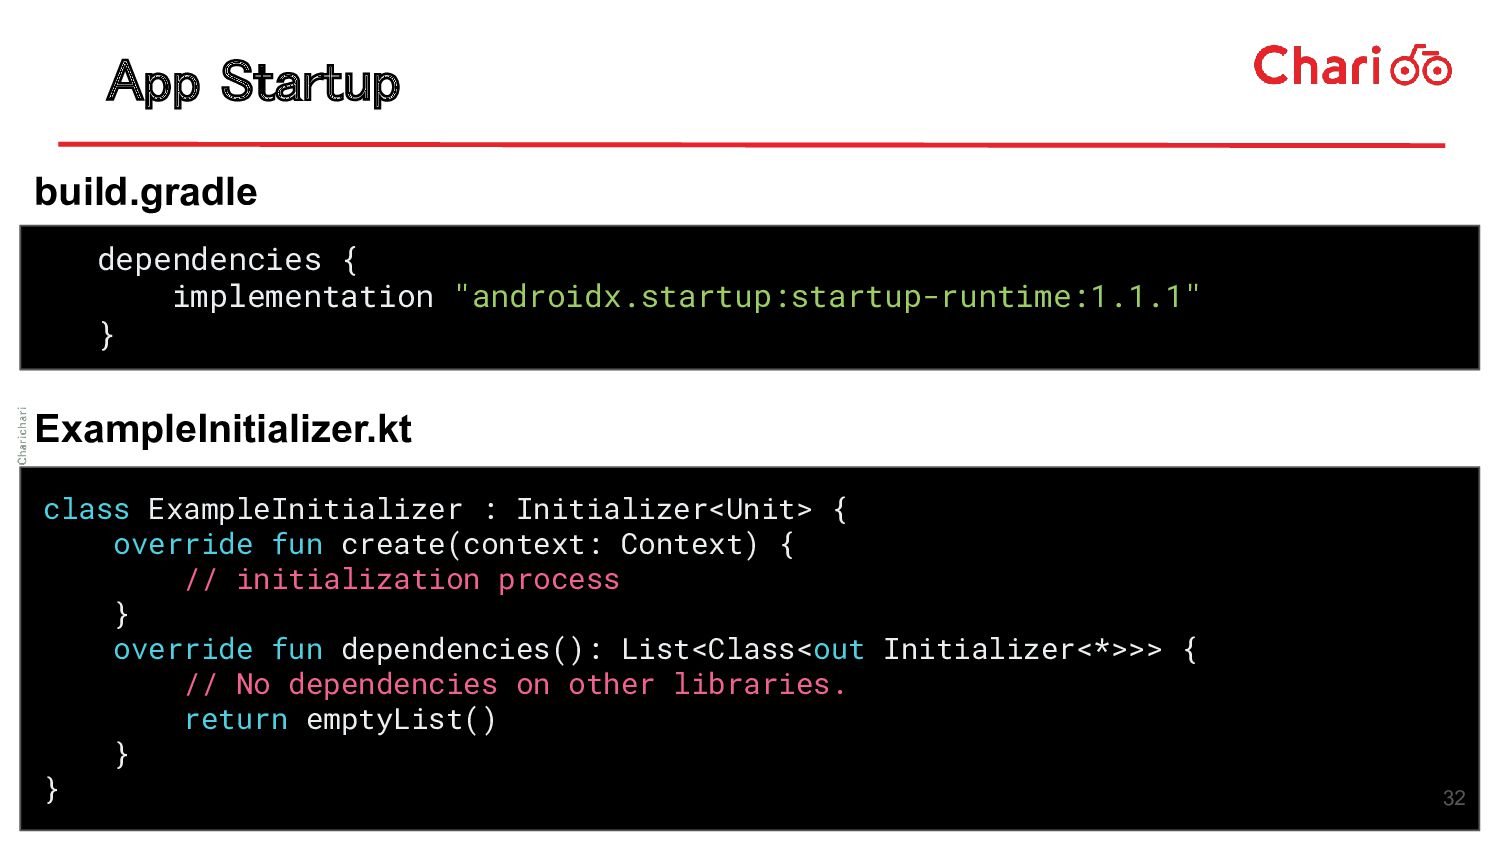
: Initializer<Unit> { override fun create(context: Context) { // initialization process } override fun dependencies(): List<Class<out Initializer<*>>> { // No dependencies on other libraries. return emptyList() } } ExampleInitializer.kt 32
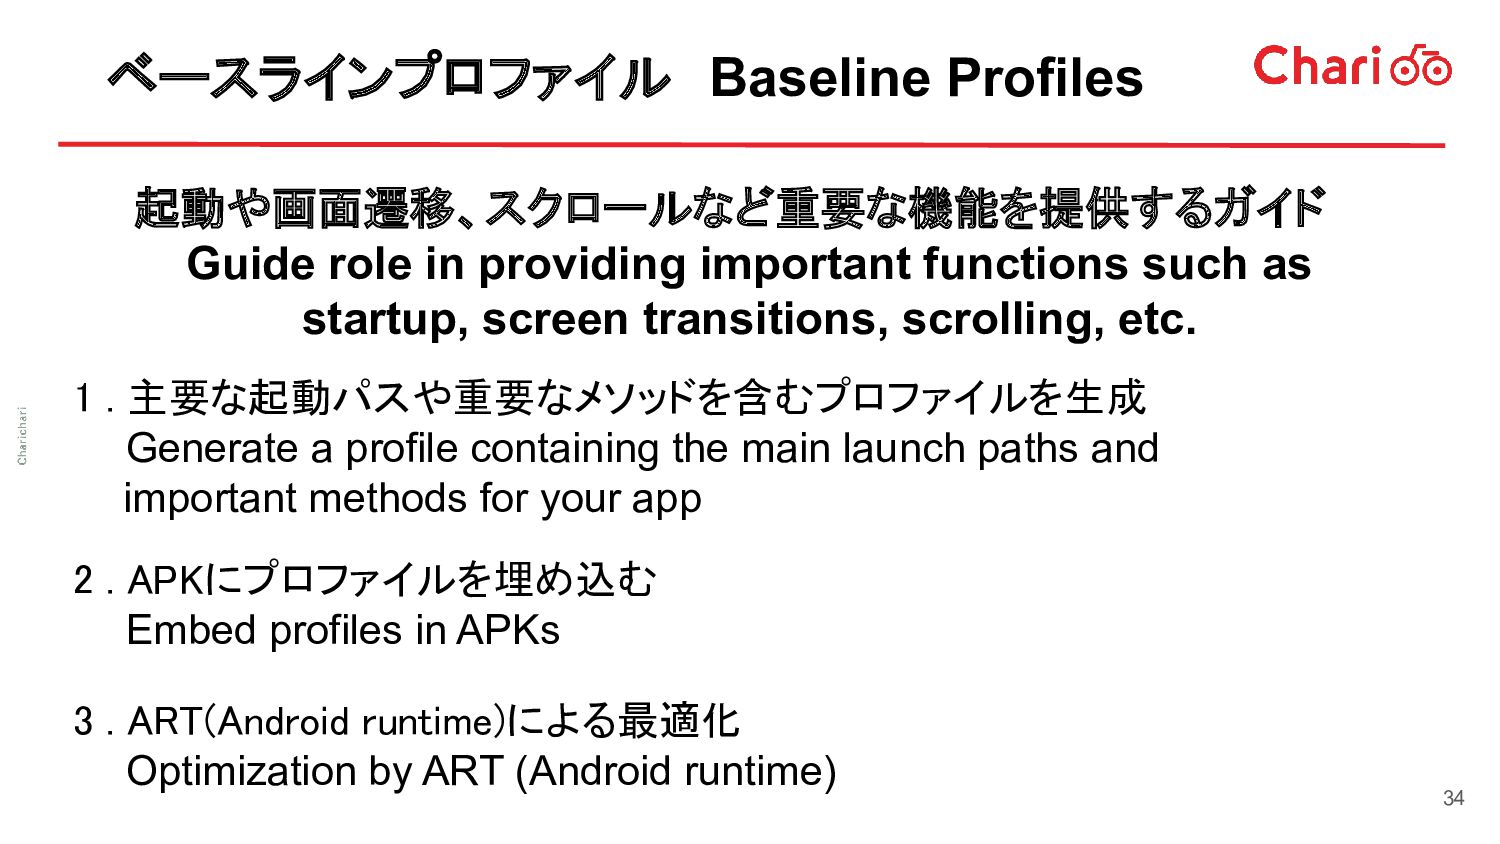
functions such as startup, screen transitions, scrolling, etc. 1 . 主要な起動パスや重要なメソッドを含むプロファイルを生成 Generate a profile containing the main launch paths and important methods for your app 2 . APKにプロファイルを埋め込む Embed profiles in APKs 3 . ART(Android runtime)による最適化 Optimization by ART (Android runtime) 34
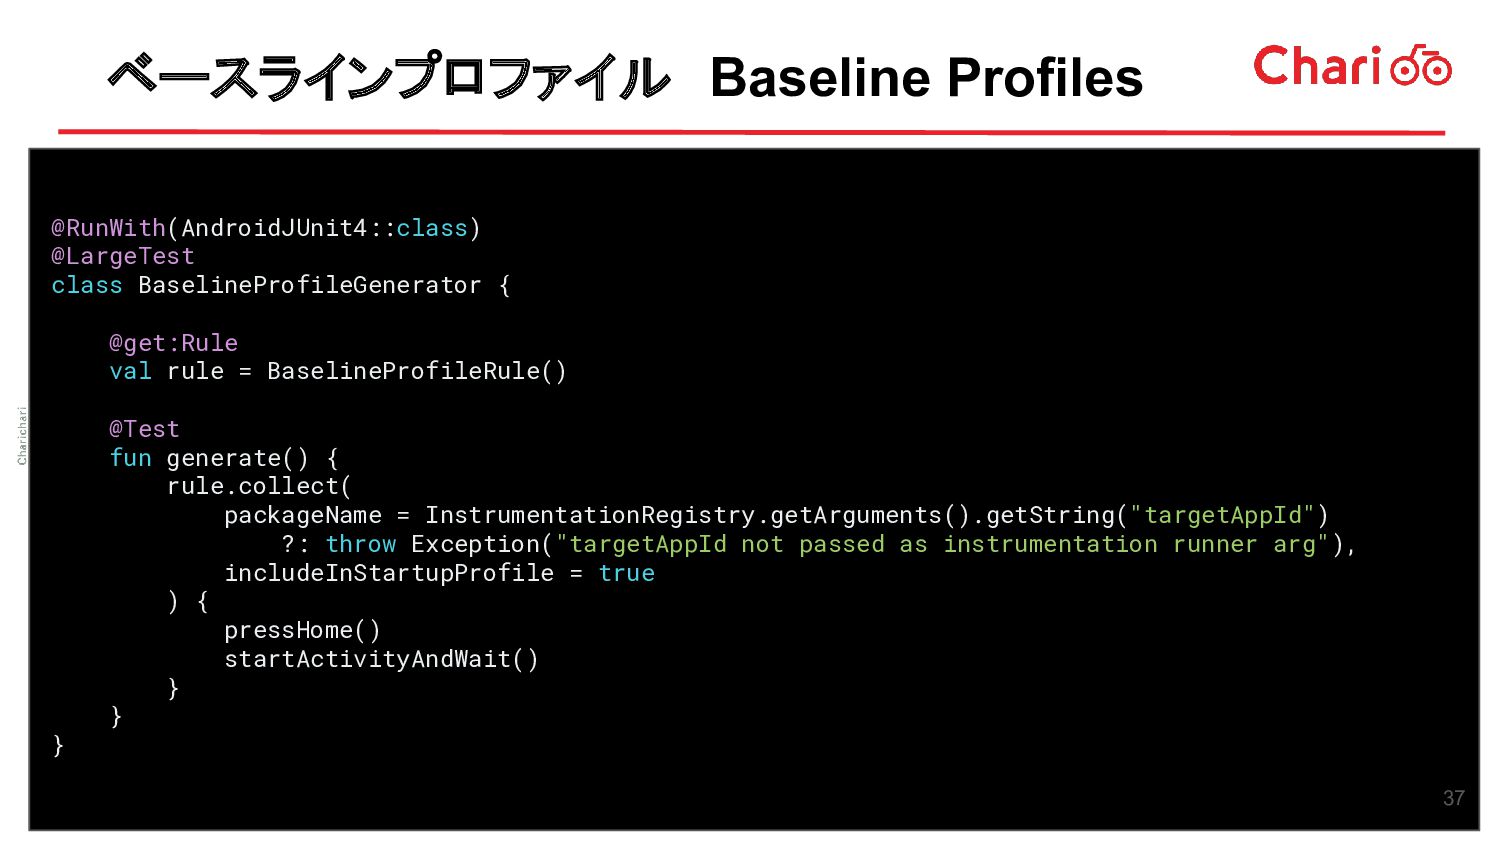
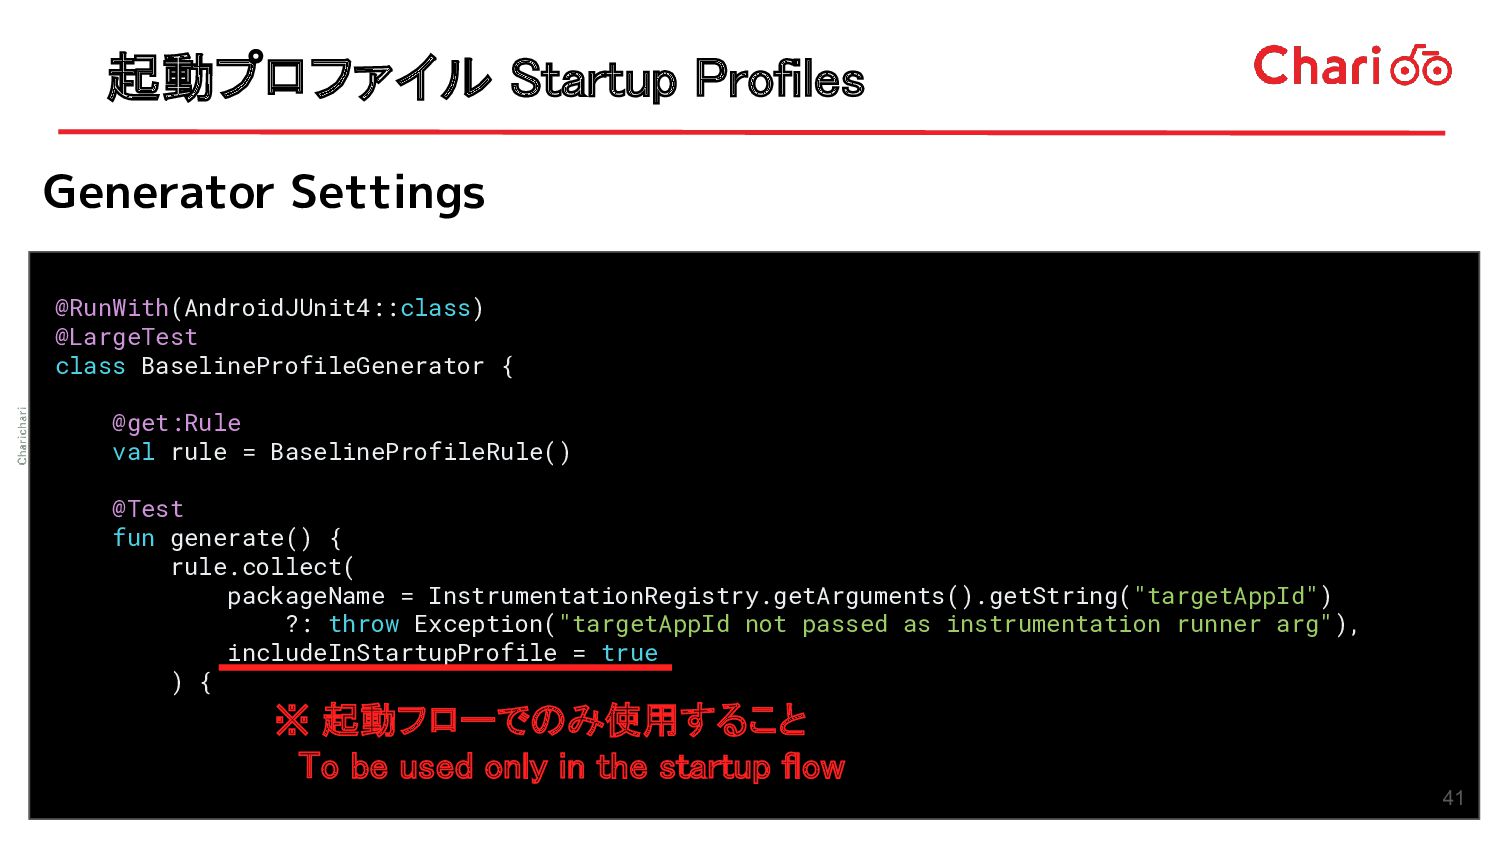
rule = BaselineProfileRule() @Test fun generate() { rule.collect( packageName = InstrumentationRegistry.getArguments().getString("targetAppId") ?: throw Exception("targetAppId not passed as instrumentation runner arg"), includeInStartupProfile = true ) { Generator Settings ※ 起動フローでのみ使用すること To be used only in the startup flow 41
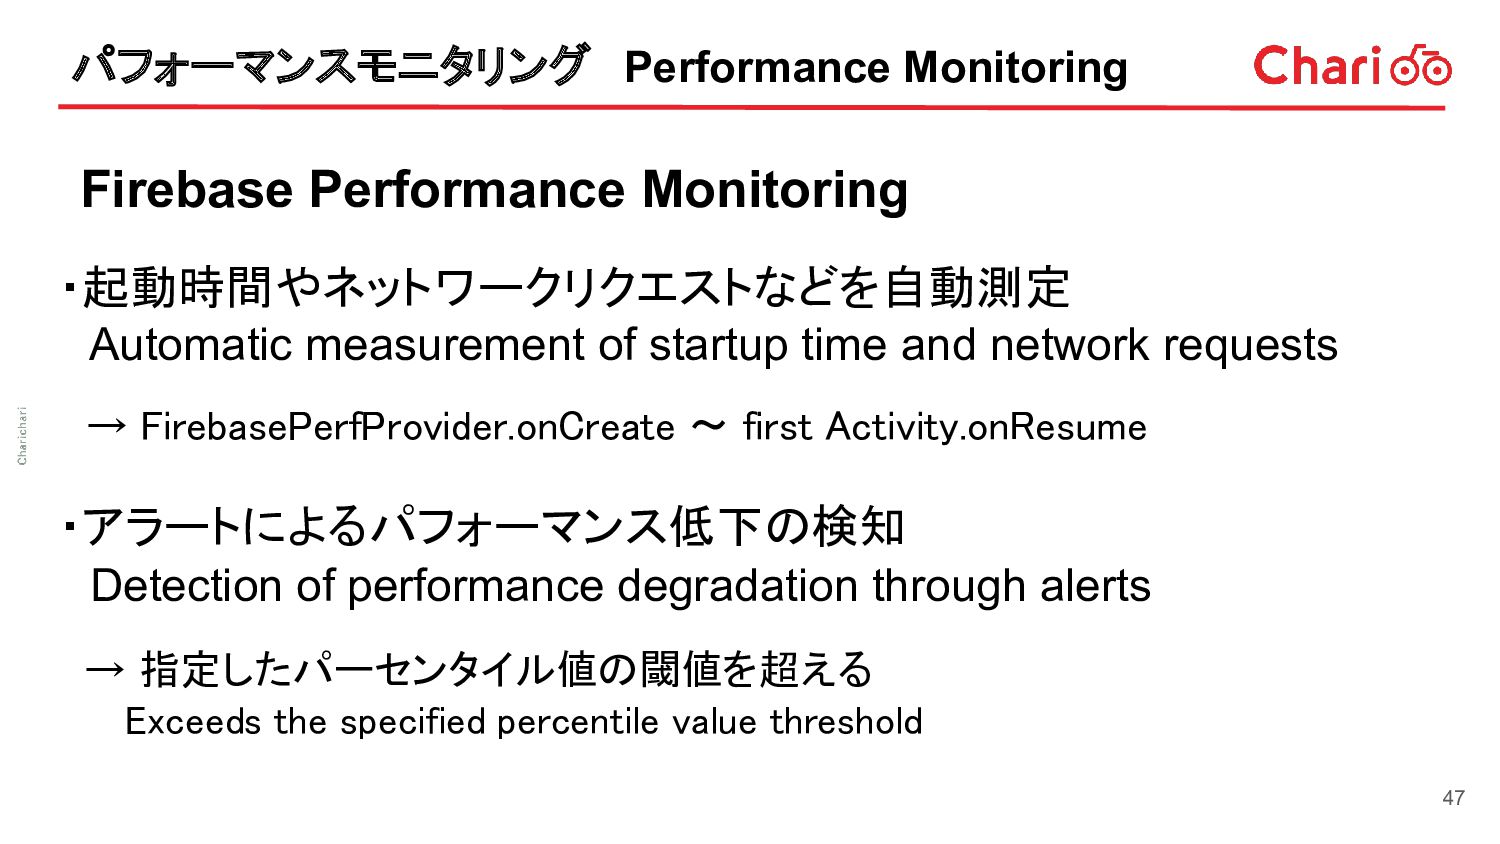
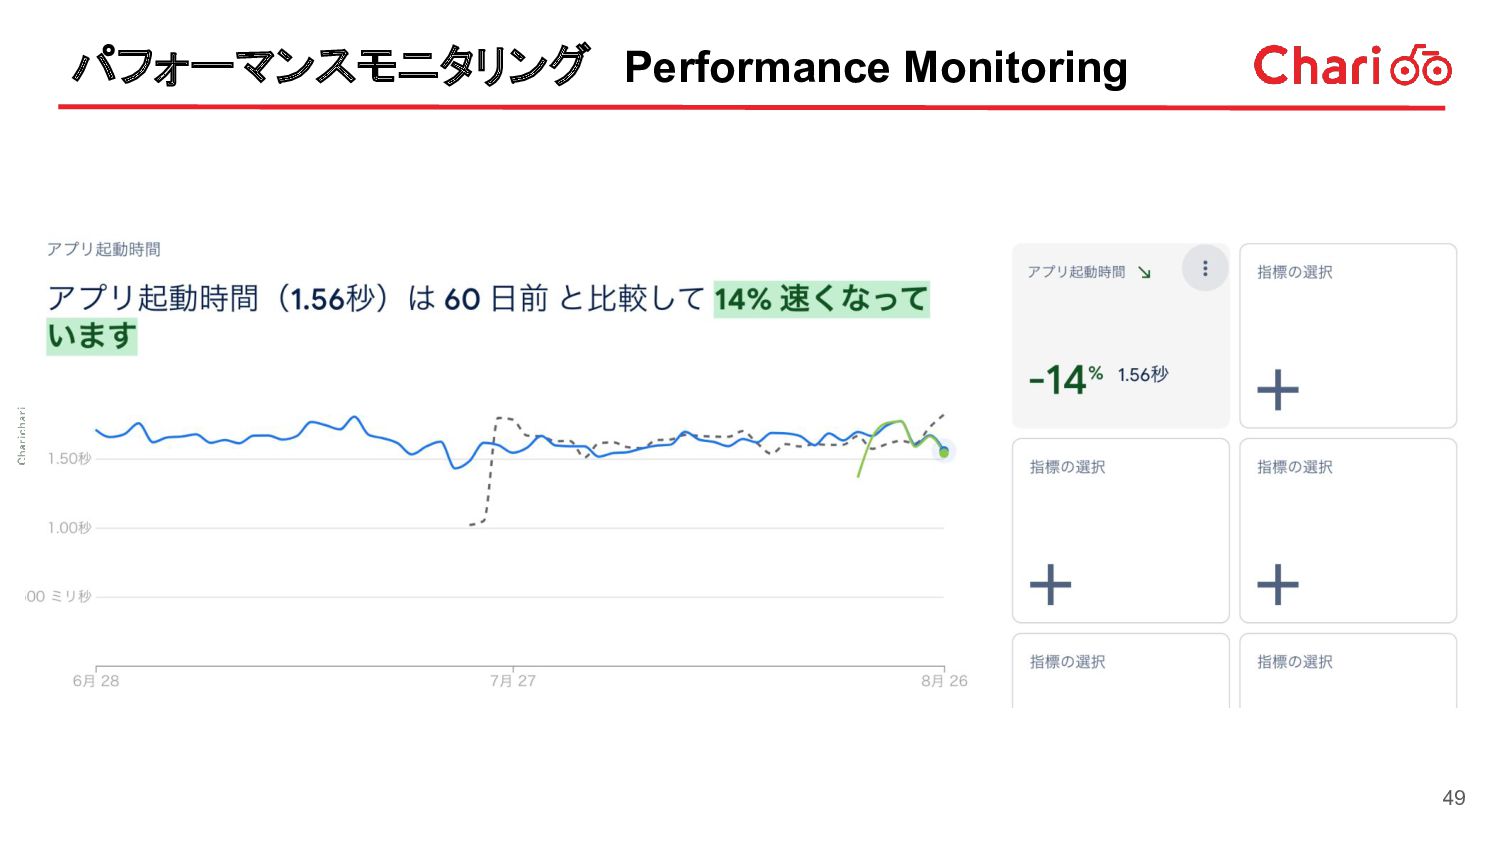
startup time and network requests → FirebasePerfProvider.onCreate 〜 first Activity.onResume ・アラートによるパフォーマンス低下の検知 Detection of performance degradation through alerts → 指定したパーセンタイル値の閾値を超える Exceeds the specified percentile value threshold 47