Upgrade to Pro
— share decks privately, control downloads, hide ads and more …
Speaker Deck
Features
Speaker Deck
PRO
Sign in
Sign up for free
Search
Search
追踪 Rails 应用中的内存泄露
Search
Yunzheng
September 23, 2016
Programming
840
2
Share
Embed
Copy iframe code
Copy JS code
Copy link
Start on current slide
追踪 Rails 应用中的内存泄露
RubyConf China 2016. presented by 42thcoder
Yunzheng
September 23, 2016
Other Decks in Programming
See All in Programming
言語を使う側から、作る側へ。 自作 Lisp で得た新たな気づき。
andpad
0
140
Prismを使った型安全な暗号化_関数型まつり2026
_fhhmm
0
150
ソフトウェア設計に溶けるインフラ ― AWS CDK のインフラ認識論
konokenj
3
690
What's New in Android 2026
veronikapj
0
230
2年かけて Deno に DOMMatrix を実装した話 / How I implemented DOMMatrix in Deno over two years
petamoriken
0
180
ITヒヤリハットを整理してみた ~ライフサイクルと原因から考える再発防止策~
koukimiura
1
120
なぜ関数型プログラミングで「型」と「証明」が語られるのか #fp_matsuri
kajitack
3
1k
コーディングルールの鮮度を保ちたい for SRE NEXT 2026 / keep-fresh-go-internal-conventions-sre-next-2026
handlename
0
150
AWS CDK を「作」ってみた 〜フルスクラッチで見えた CDK の裏側〜 / aws-cdk-from-scratch
gotok365
3
2.6k
5分で問診!Composer セキュリティ健康診断
codmoninc
0
690
メールのエイリアス機能を履き違えない
isshinfunada
0
140
Foundation Models frameworkで画像分析
ryodeveloper
1
160
Featured
See All Featured
Become a Pro
speakerdeck
PRO
31
6k
Everyday Curiosity
cassininazir
0
260
Effective software design: The role of men in debugging patriarchy in IT @ Voxxed Days AMS
baasie
0
450
Helping Users Find Their Own Way: Creating Modern Search Experiences
danielanewman
31
3.3k
Producing Creativity
orderedlist
PRO
348
40k
HTML-Aware ERB: The Path to Reactive Rendering @ RubyCon 2026, Rimini, Italy
marcoroth
3
370
Performance Is Good for Brains [We Love Speed 2024]
tammyeverts
12
1.8k
DevOps and Value Stream Thinking: Enabling flow, efficiency and business value
helenjbeal
1
270
Understanding Cognitive Biases in Performance Measurement
bluesmoon
32
3k
Leading Effective Engineering Teams in the AI Era
addyosmani
9
2.2k
AI in Enterprises - Java and Open Source to the Rescue
ivargrimstad
0
1.4k
Winning Ecommerce Organic Search in an AI Era - #searchnstuff2025
aleyda
1
2.1k
Transcript
张运政 追踪 Rails 应用中 的内存泄漏
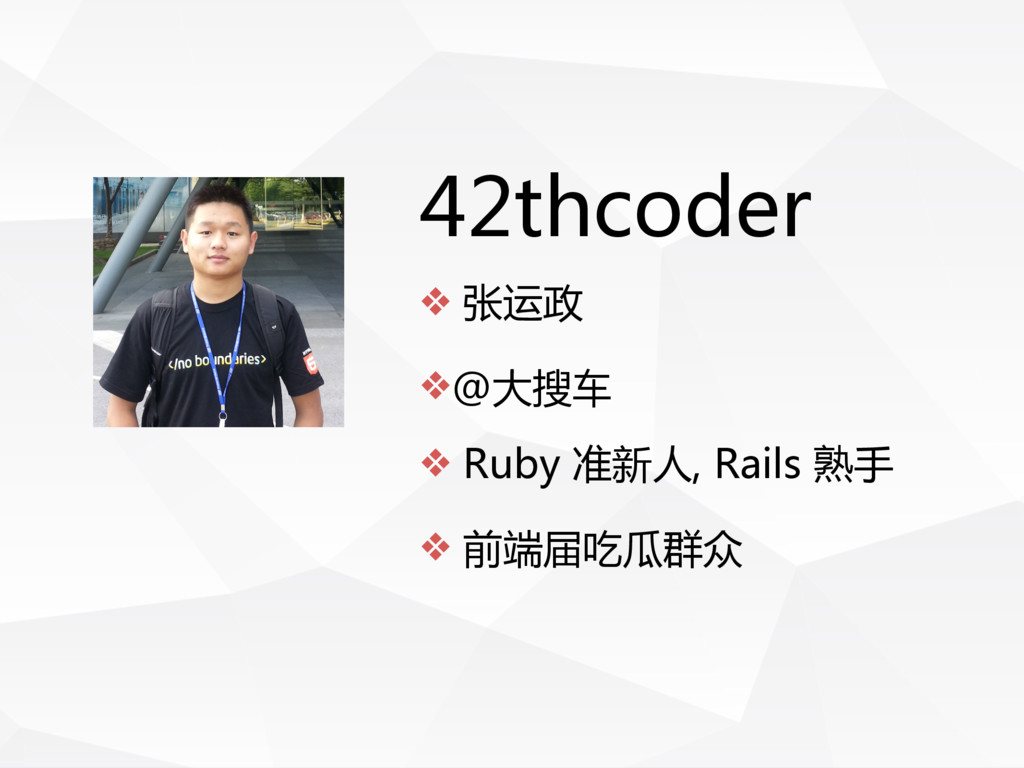
42thcoder ❖ 张运政 ❖ Ruby 准新人, Rails 熟手 ❖ 前端届吃瓜群众
❖@大搜车
None
None
2012年成立
2012年成立 团队500人
D轮数千万美金 2012年成立 团队500人
项目介绍
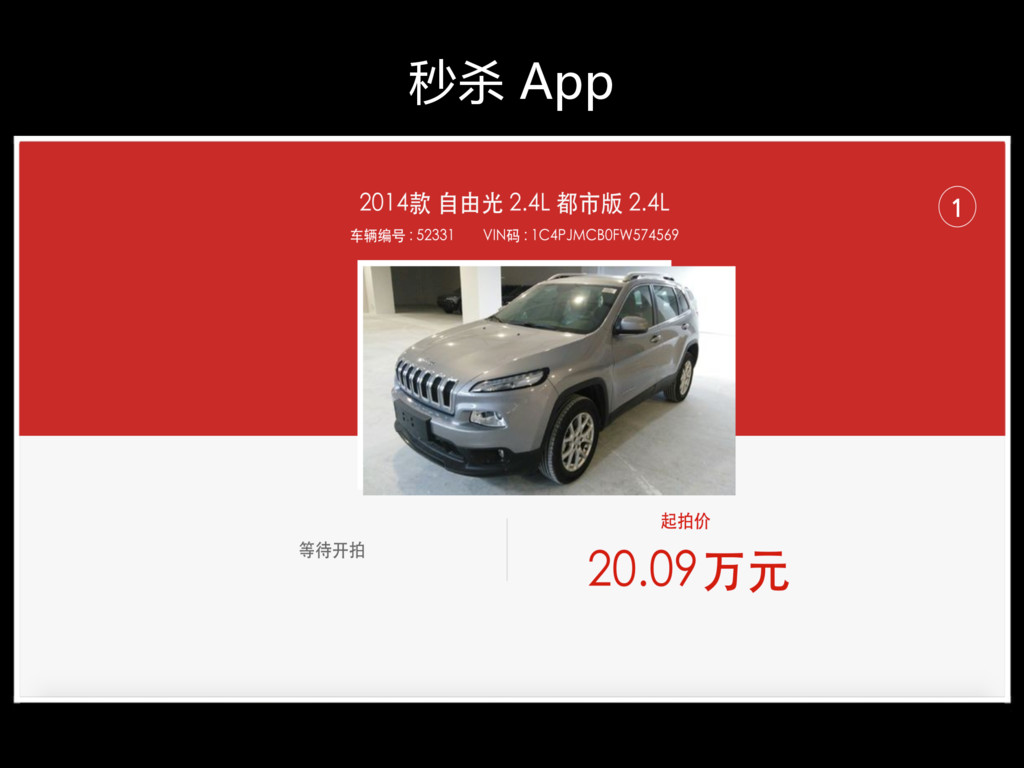
拍卖
秒杀 App
秒杀 App
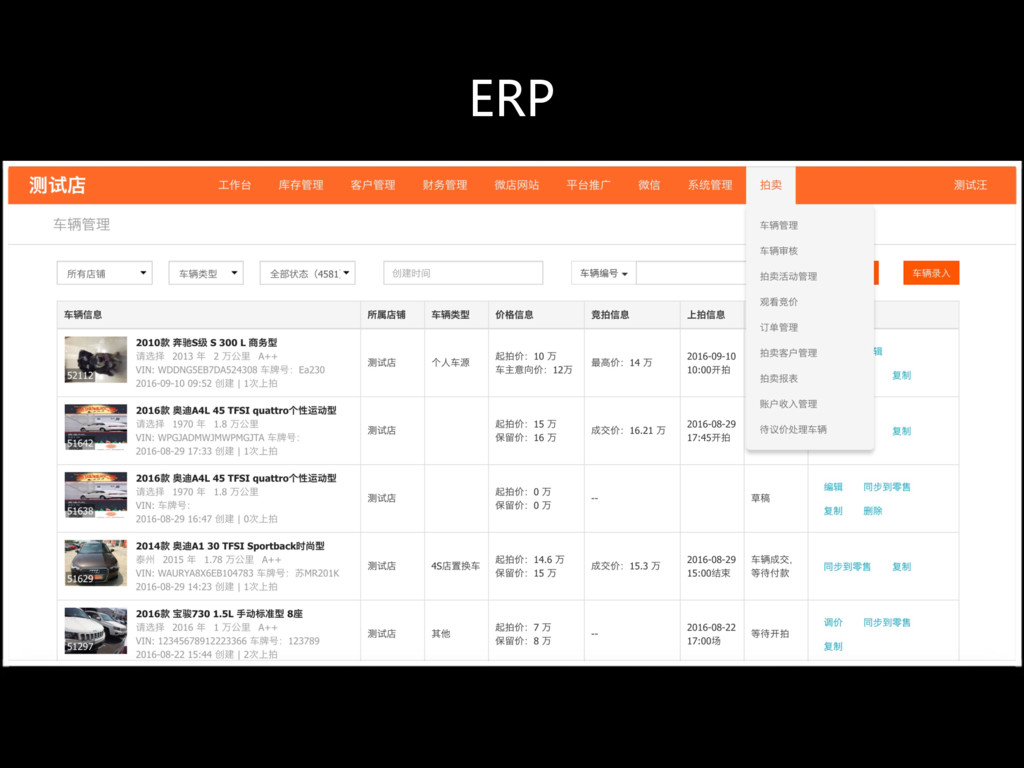
ERP
None
None
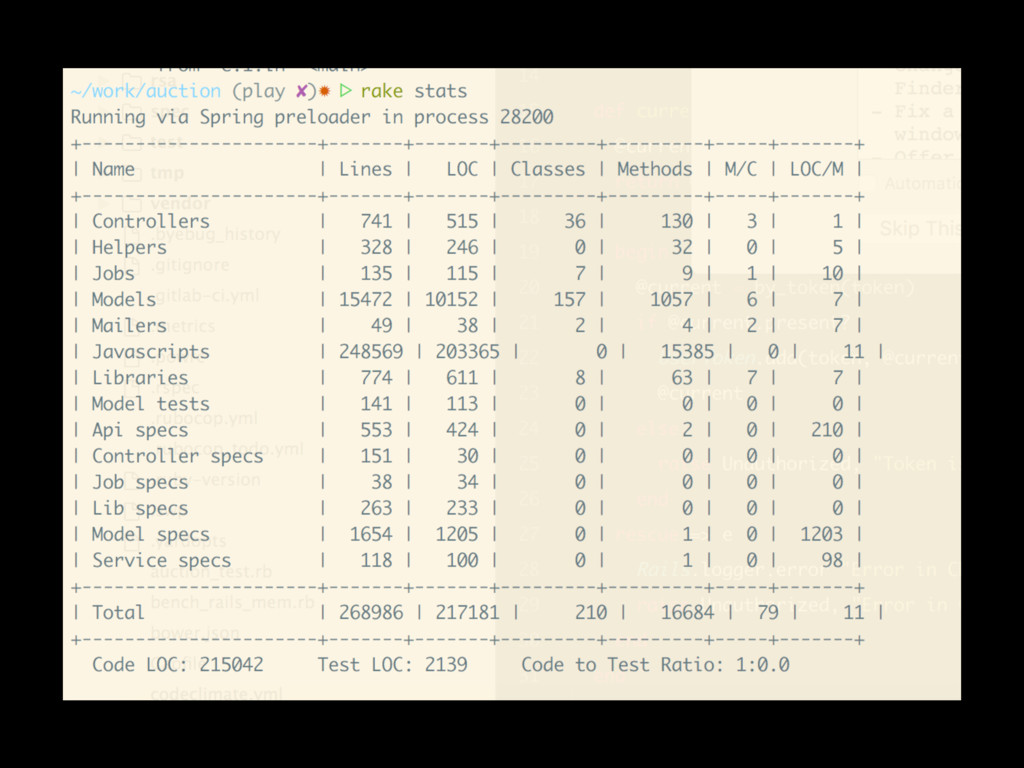
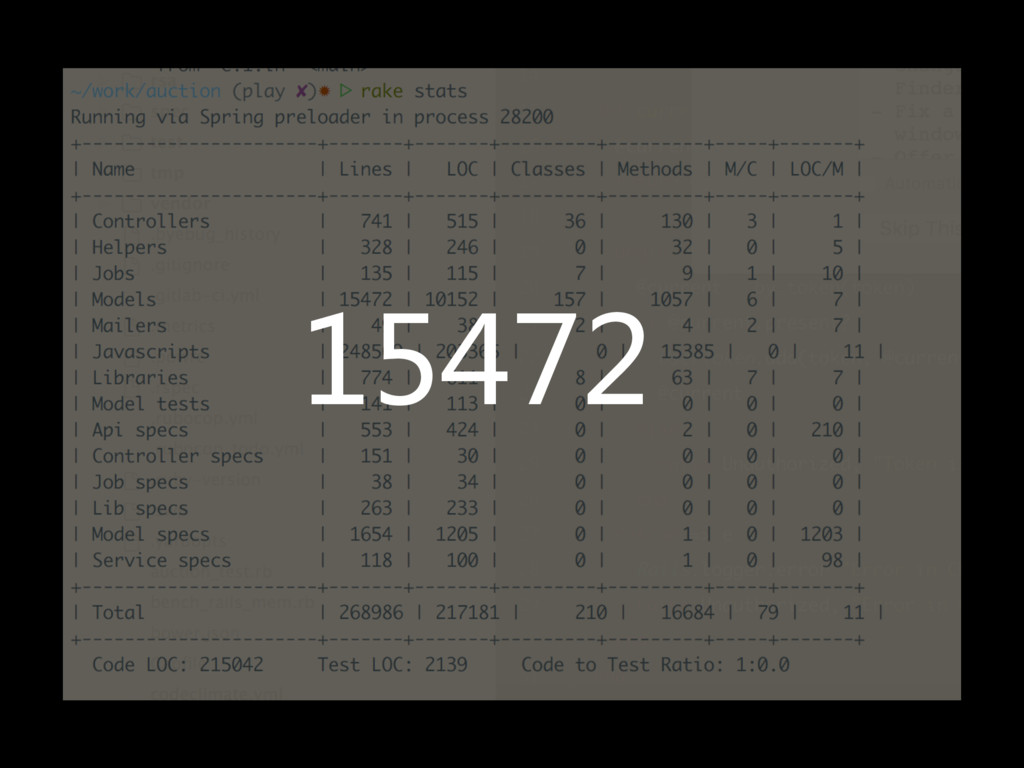
15472
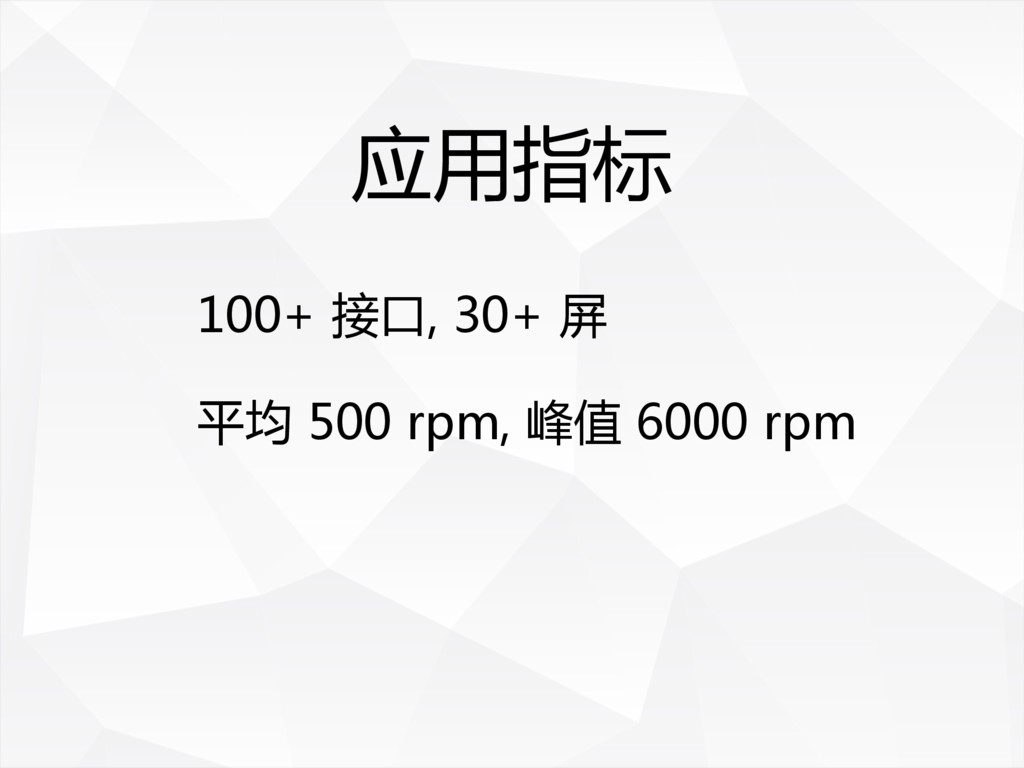
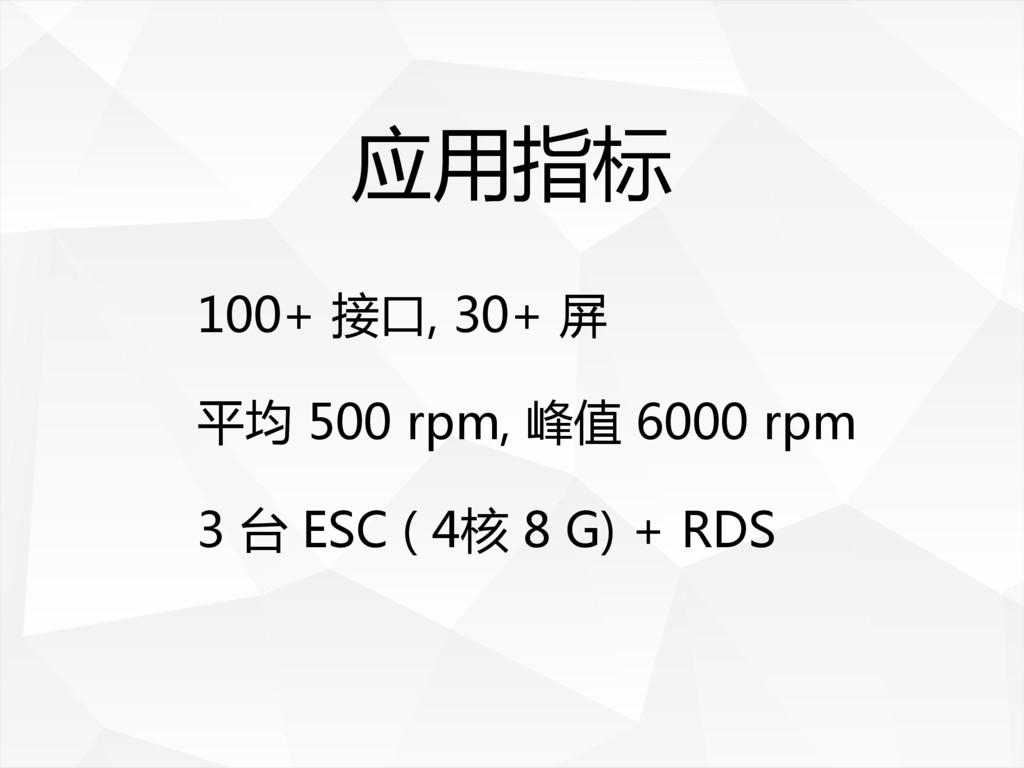
应用指标
应用指标 100+ 接口, 30+ 屏
应用指标 100+ 接口, 30+ 屏 平均 500 rpm, 峰值 6000
rpm
应用指标 100+ 接口, 30+ 屏 平均 500 rpm, 峰值 6000
rpm 3 台 ESC ( 4核 8 G) + RDS
上线啦
死机啦! 内存泄露啦!
怎么办?
下面我就聊一聊在拍卖项目中, 追踪内存泄露的经历
动手解决
工欲善其事必先利其器 — 孔子
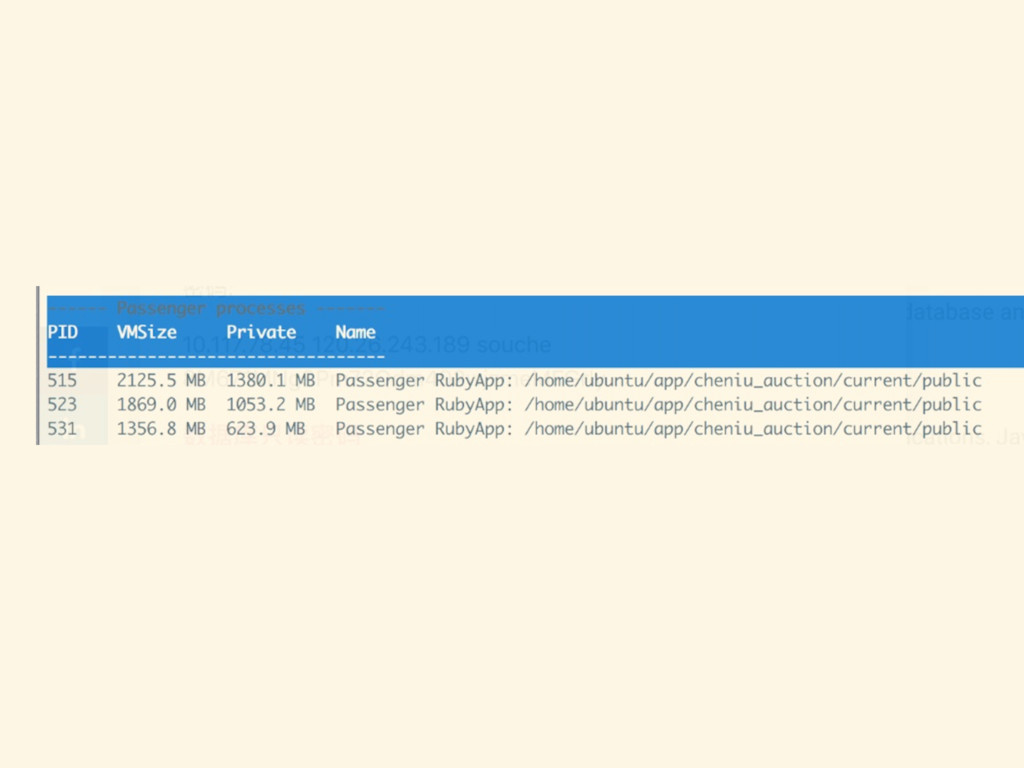
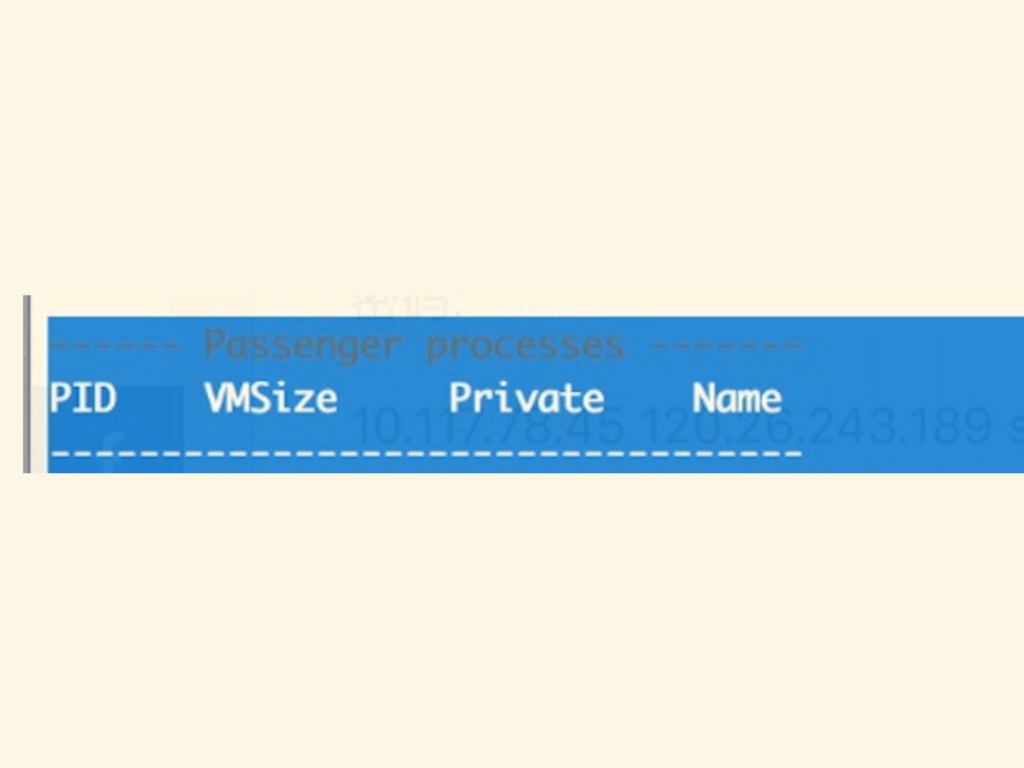
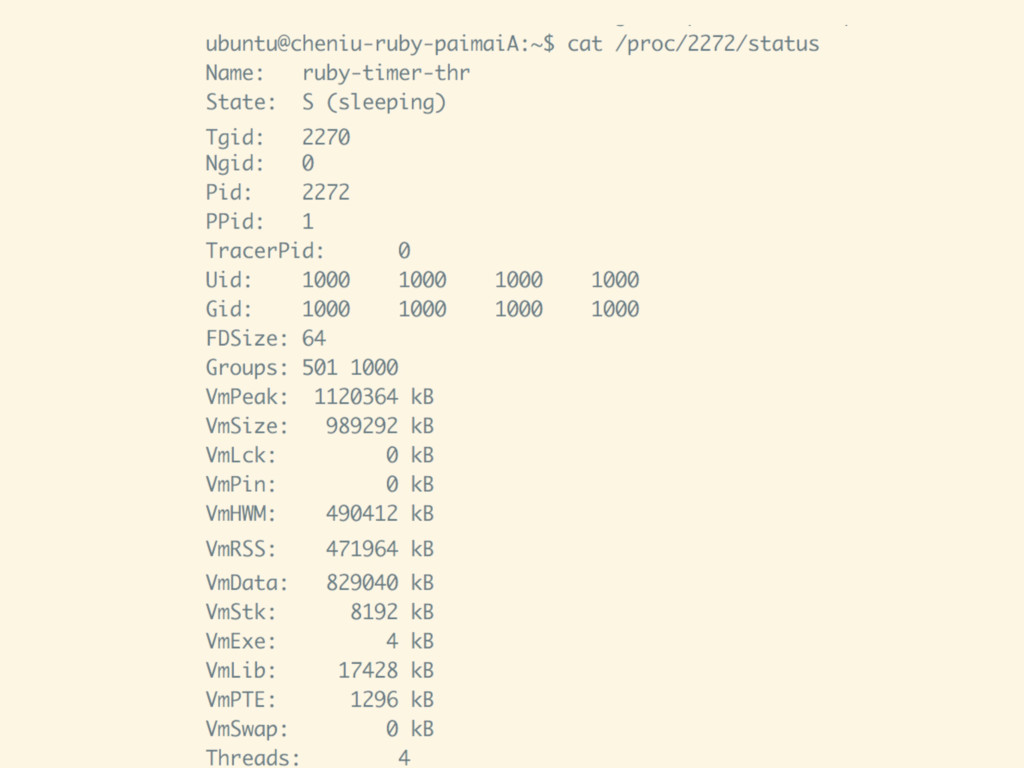
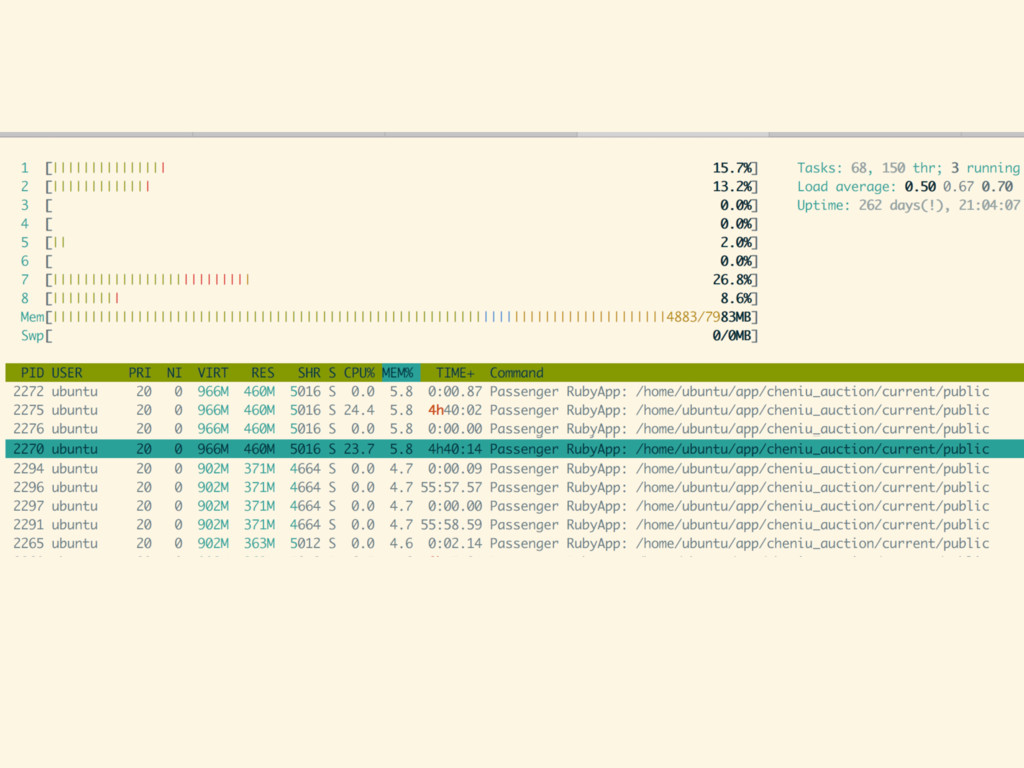
Linux 工具
passenger-memory-stats passenger-status top && htop cat /proc/pid/status & cat /proc/[pid]/mem
None
None
None
None
None
None
resident set size, the non- swapped physical memory that a
task has used. RSS VSZ virtual memory size of the process in KiB. Device mappings are currently excluded; this is subject to change.
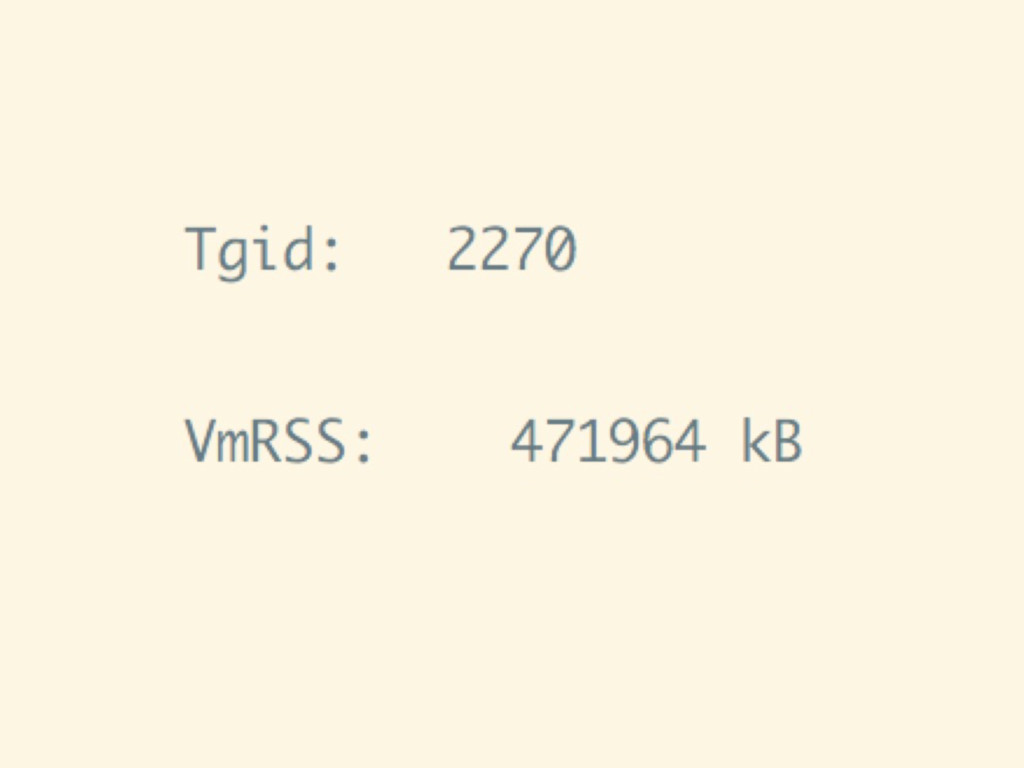
线程组 Tgid( Thread Group ID) 才是真正意义上的 进程 ID, 即 get_pid
的结果
APM
None
动手解决问题吧
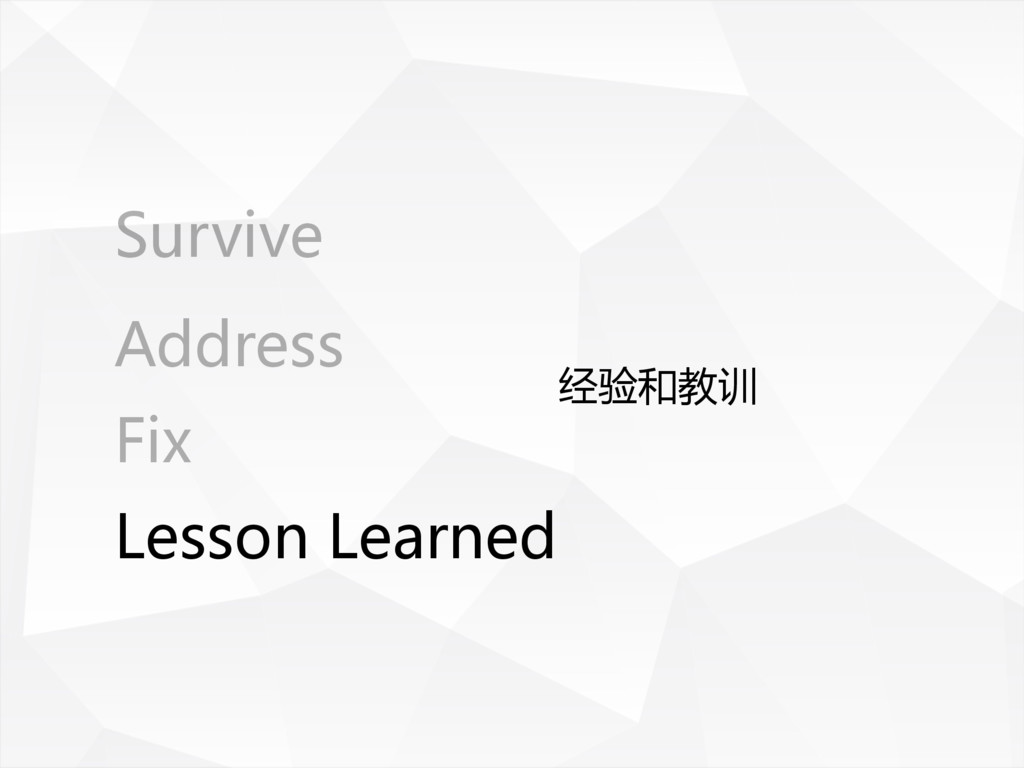
Survive Address Fix Lesson
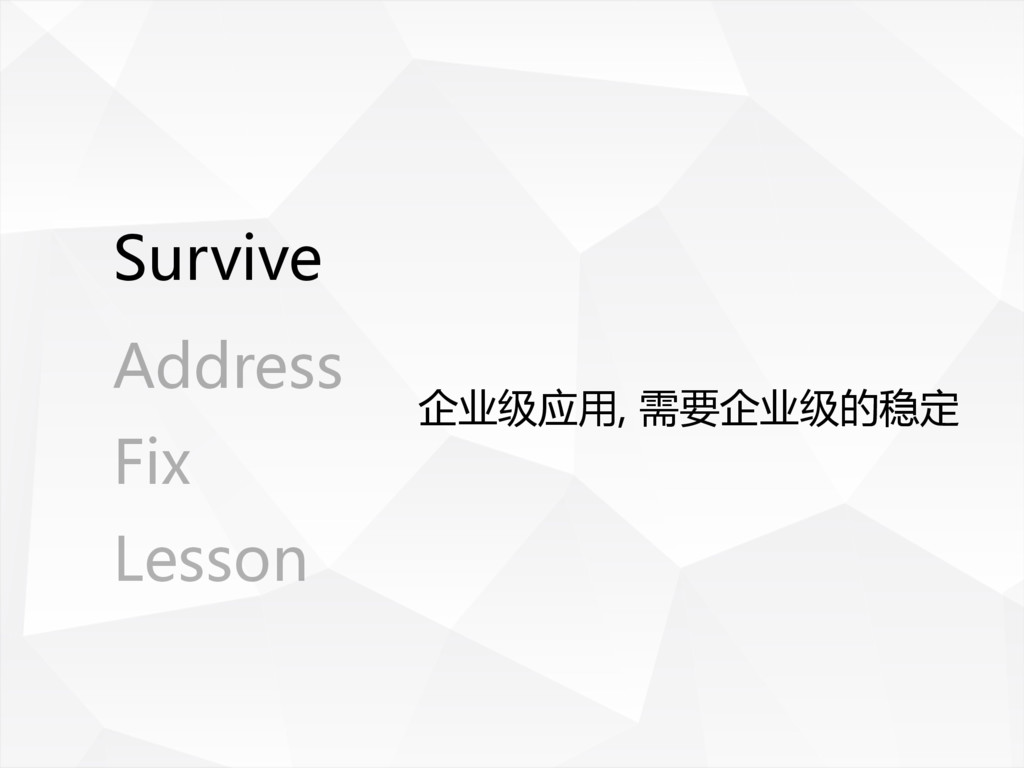
企业级应用, 需要企业级的稳定 Survive Address Fix Lesson
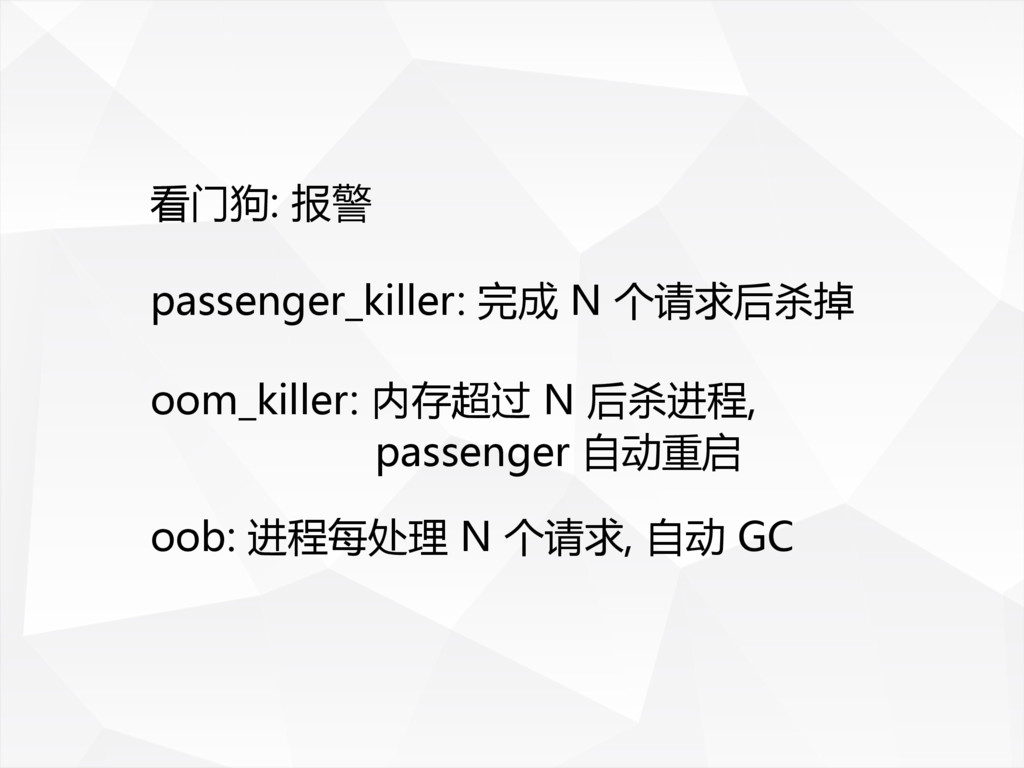
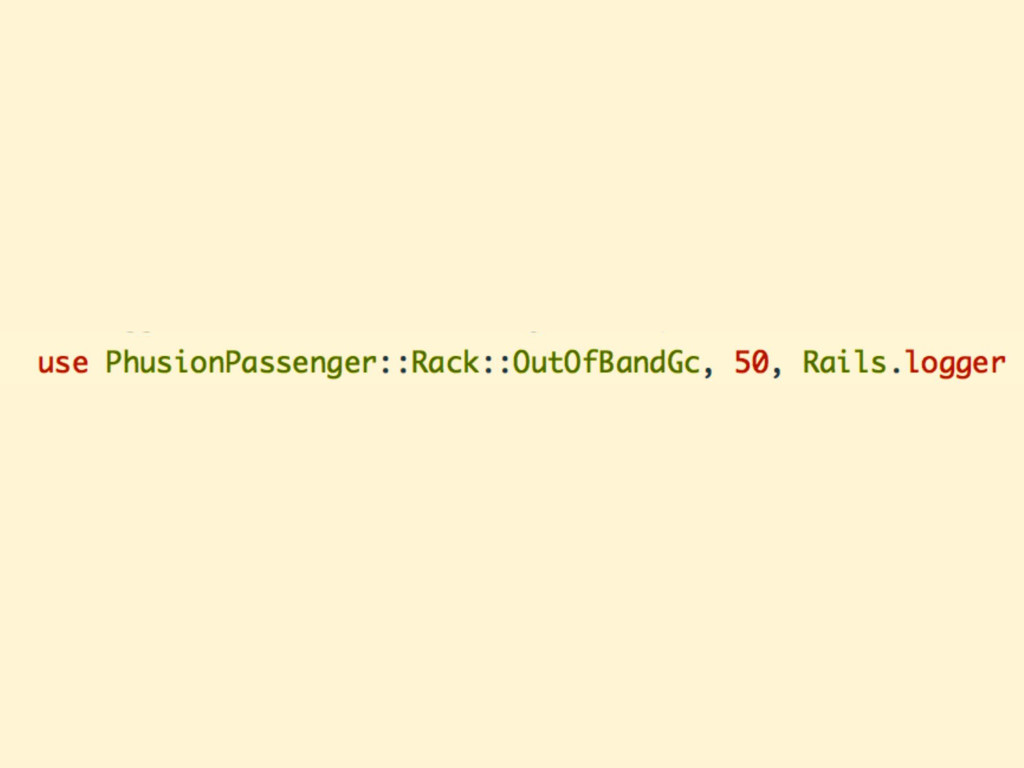
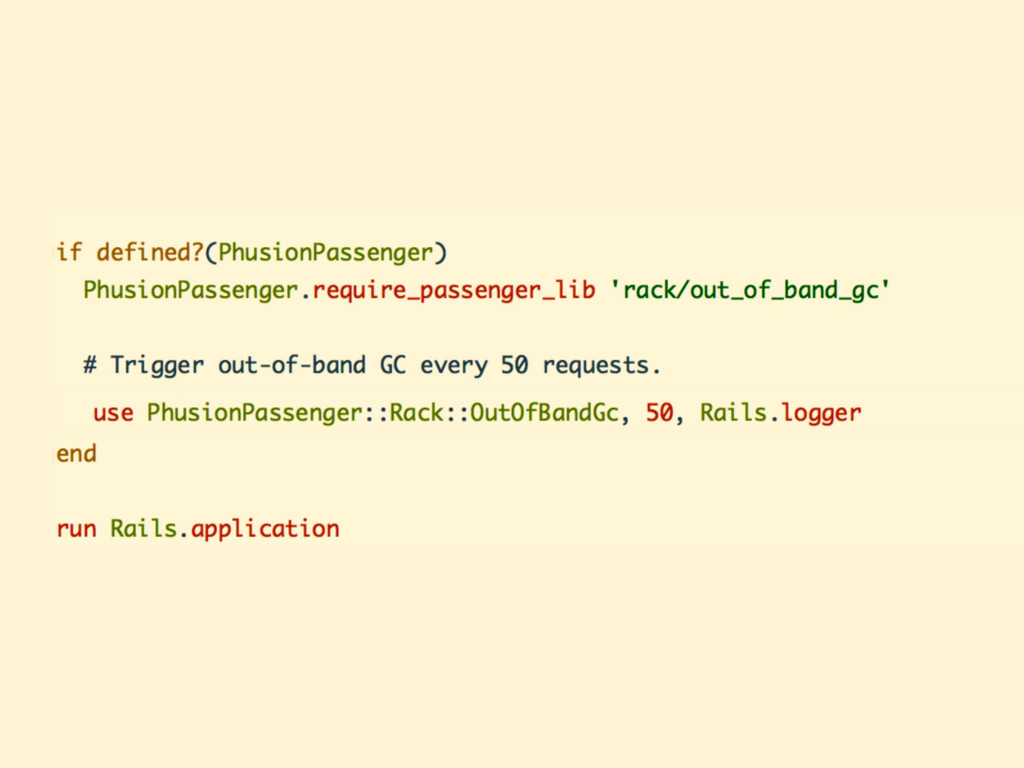
看门狗: 报警 passenger_killer: 完成 N 个请求后杀掉 oom_killer: 内存超过 N 后杀进程,
passenger 自动重启 oob: 进程每处理 N 个请求, 自动 GC
None
None
None
定位问题 Survive Address Fix Lesson Learned
插个话题
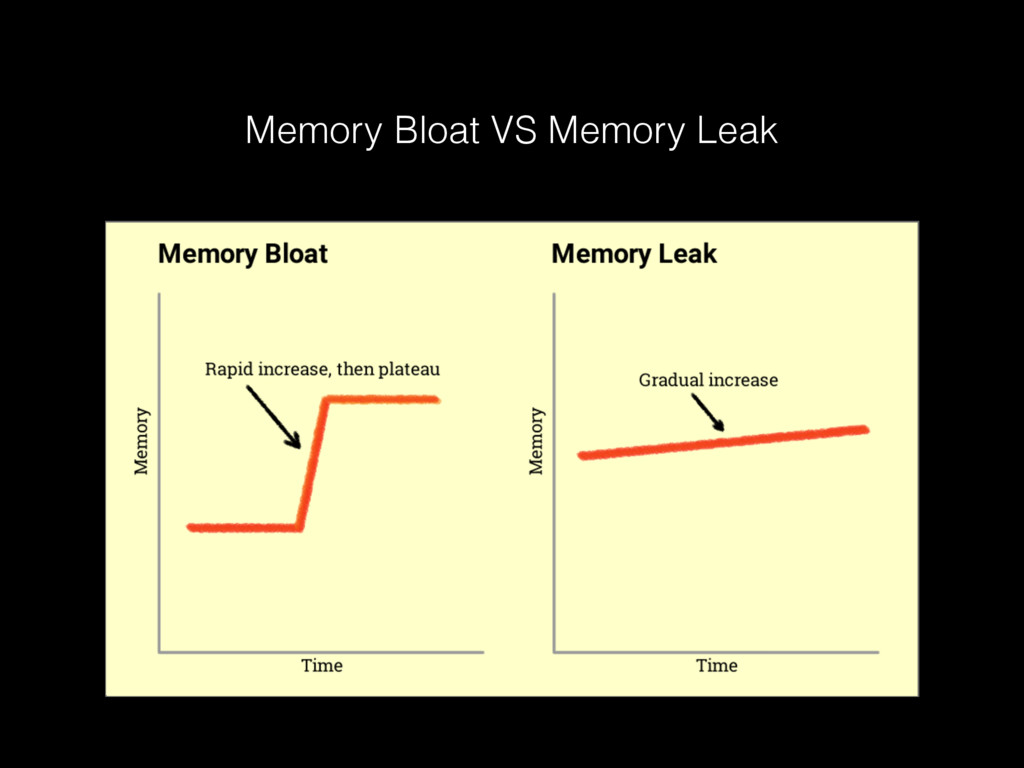
Is it Memory Bloat?
Memory Bloat VS Memory Leak
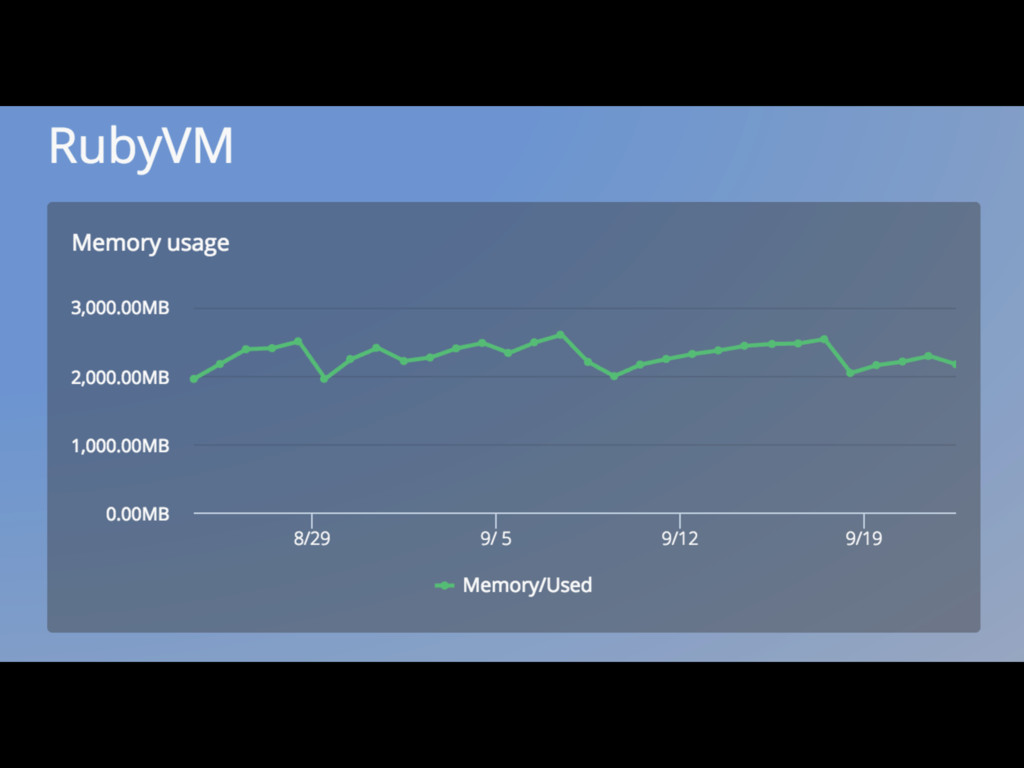
补充⼀一张 oneapm 看 vm 的截图
Monitor
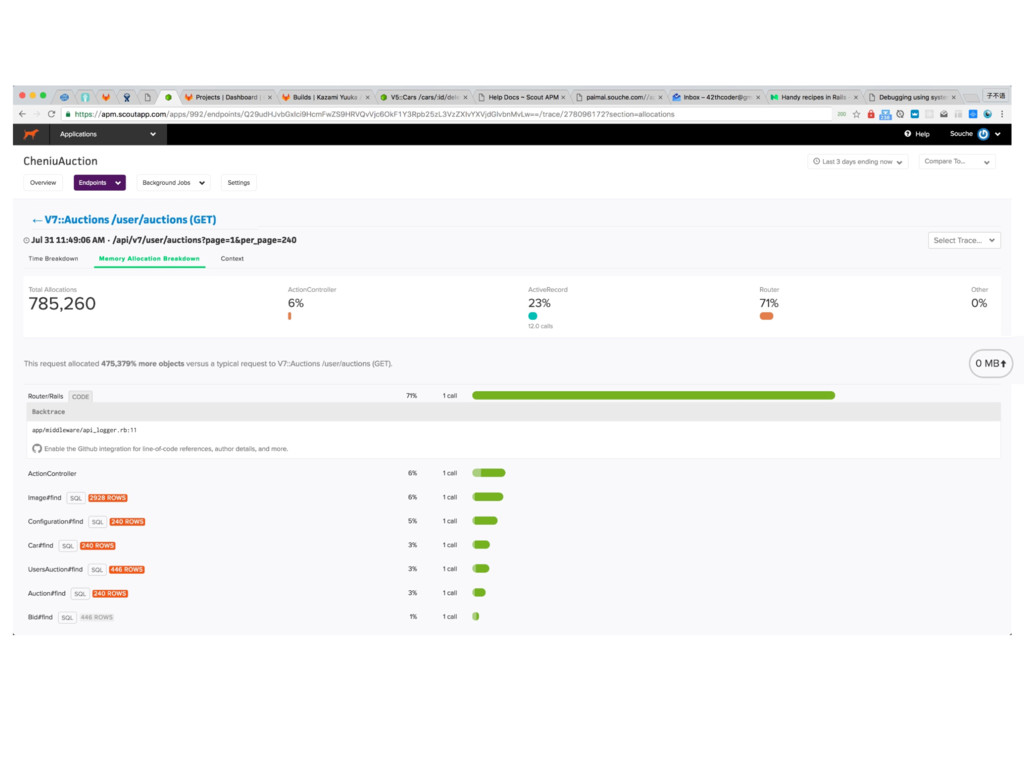
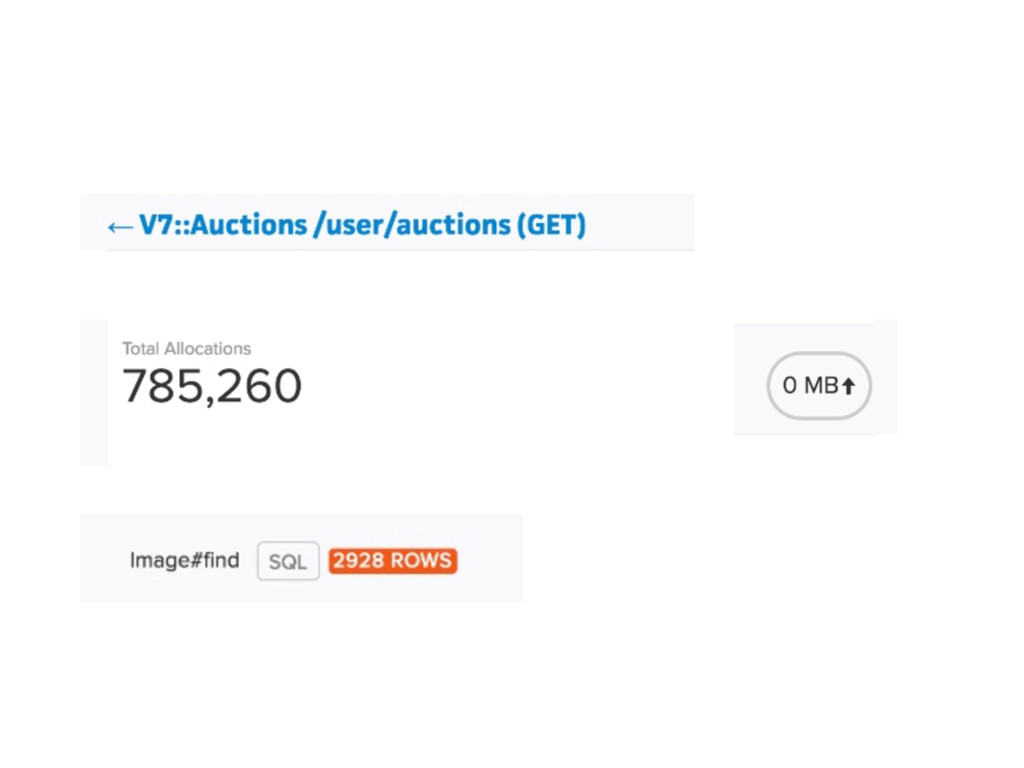
补⼀一张 scoutapp 看各个接⼝口内存分配的图; 补⼀一张 GC 执⾏行行时间的图
None
Profile
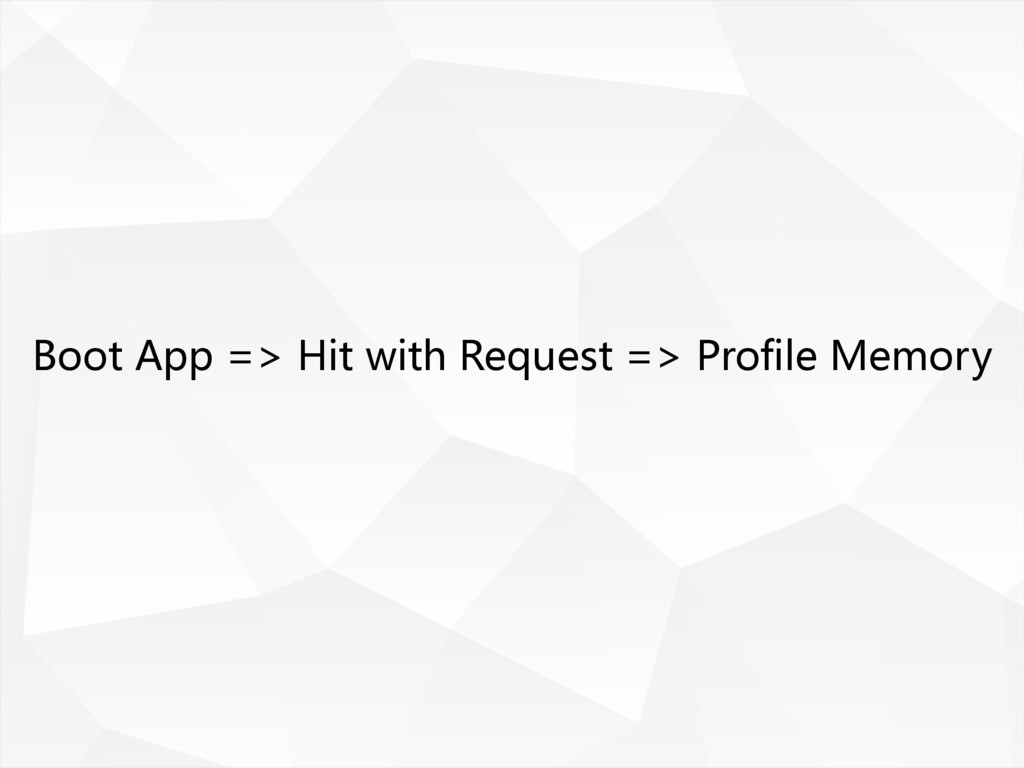
Boot App => Hit with Request => Profile Memory
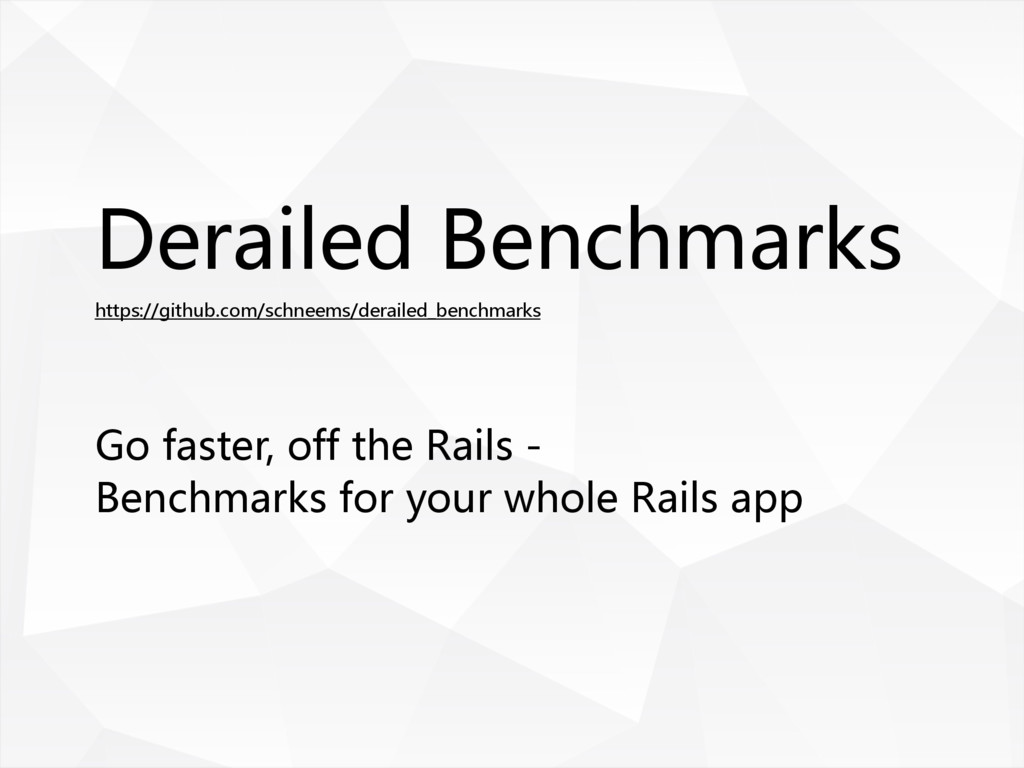
Derailed Benchmarks https://github.com/schneems/derailed_benchmarks Go faster, off the Rails - Benchmarks
for your whole Rails app
Memory Profiler https://github.com/SamSaffron/memory_profiler memory_profiler for ruby
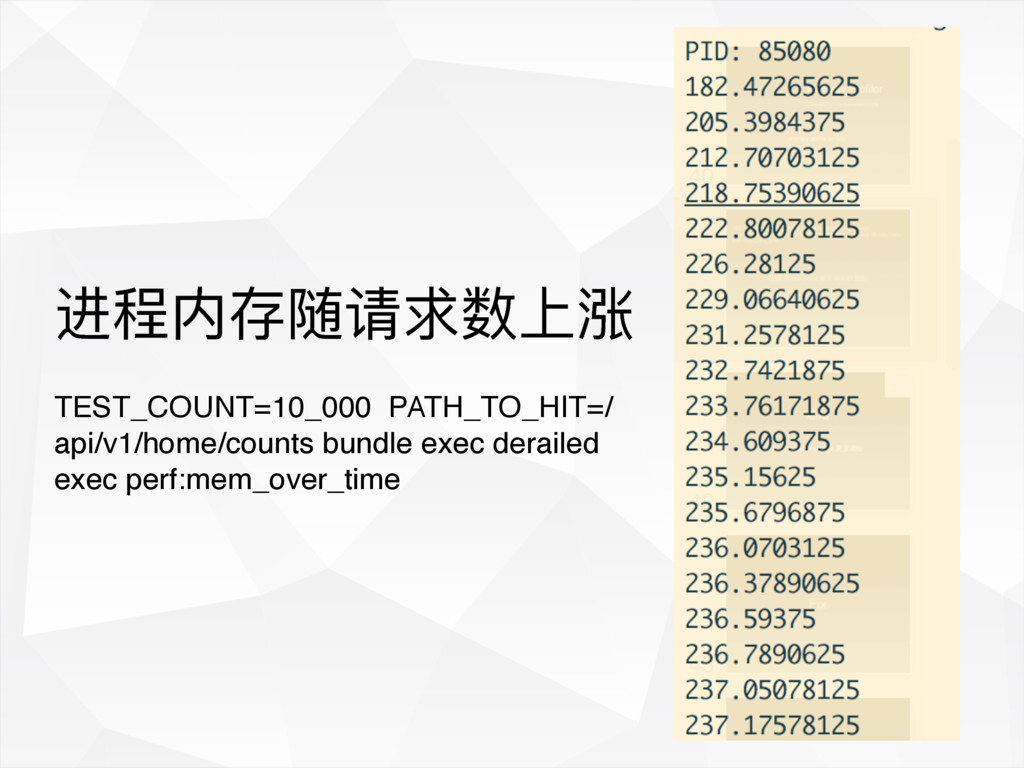
进程内存随请求数上涨 TEST_COUNT=10_000 PATH_TO_HIT=/ api/v1/home/counts bundle exec derailed exec perf:mem_over_time
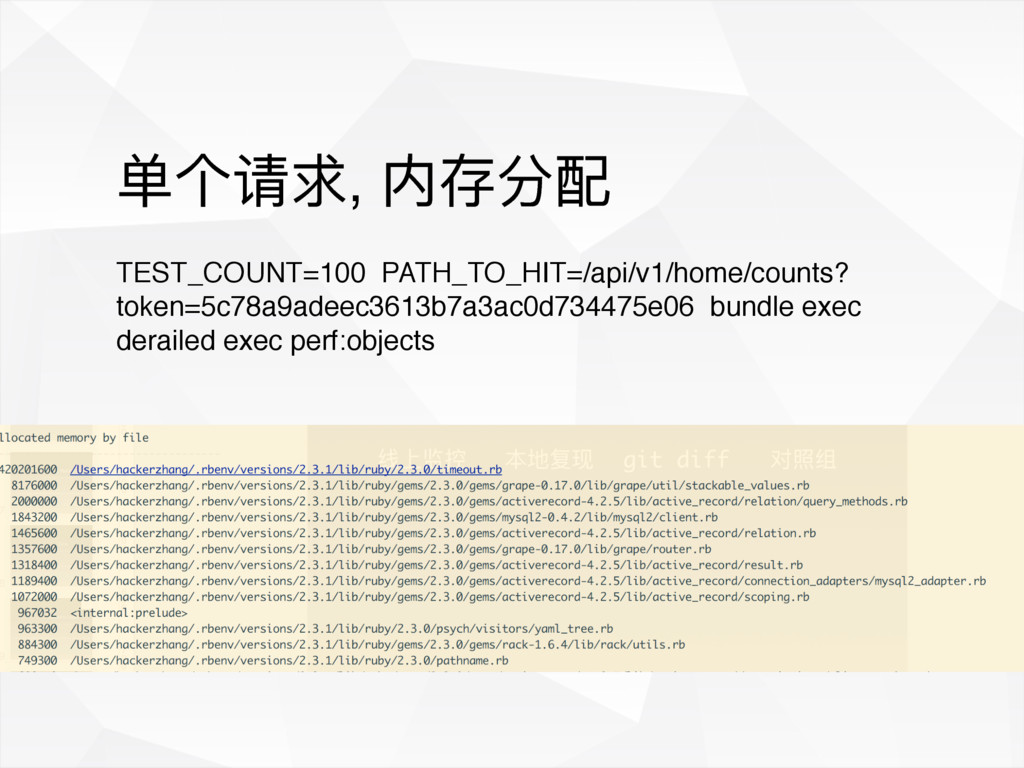
单个请求, 内存分配 TEST_COUNT=100 PATH_TO_HIT=/api/v1/home/counts? token=5c78a9adeec3613b7a3ac0d734475e06 bundle exec derailed exec perf:objects
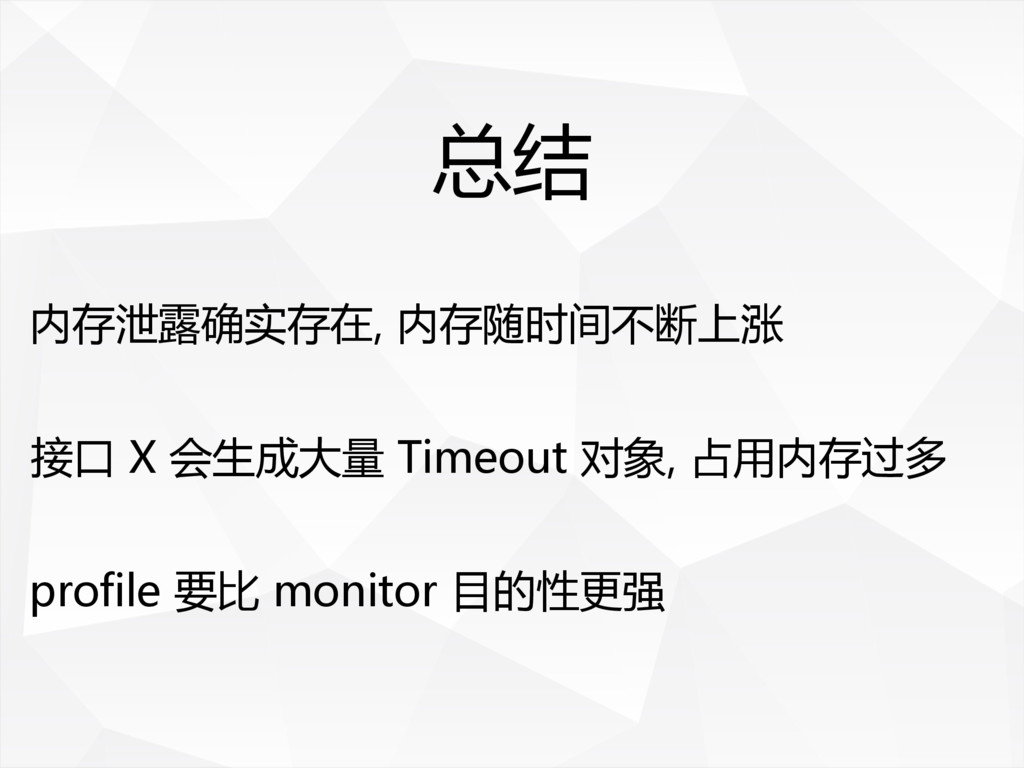
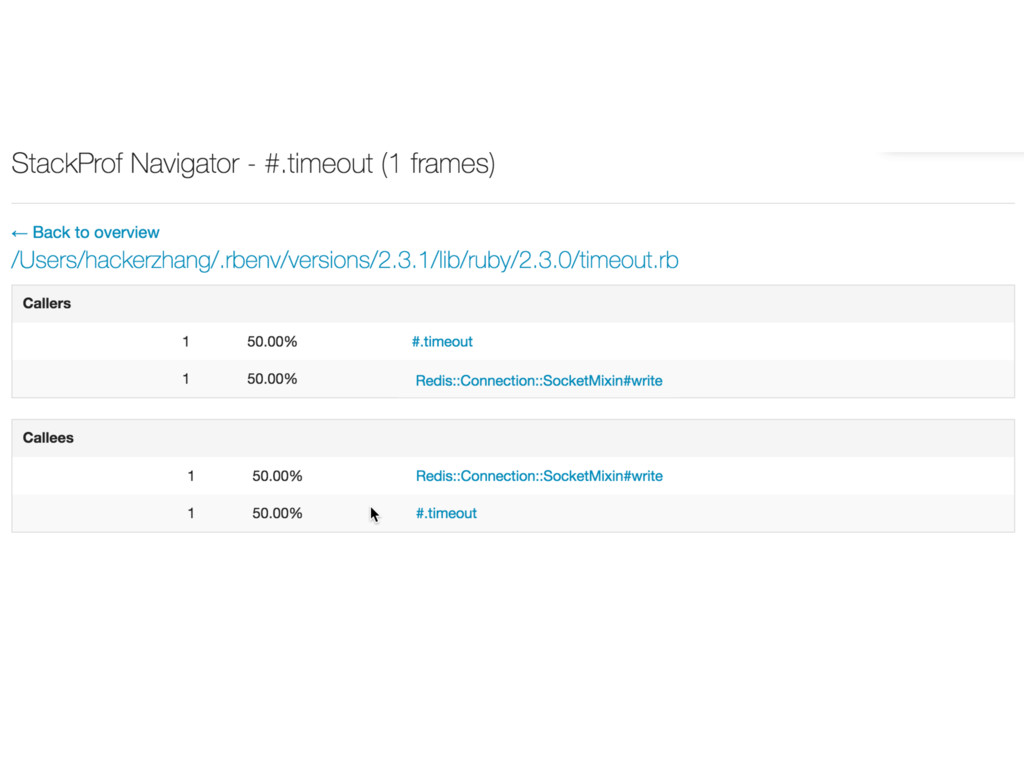
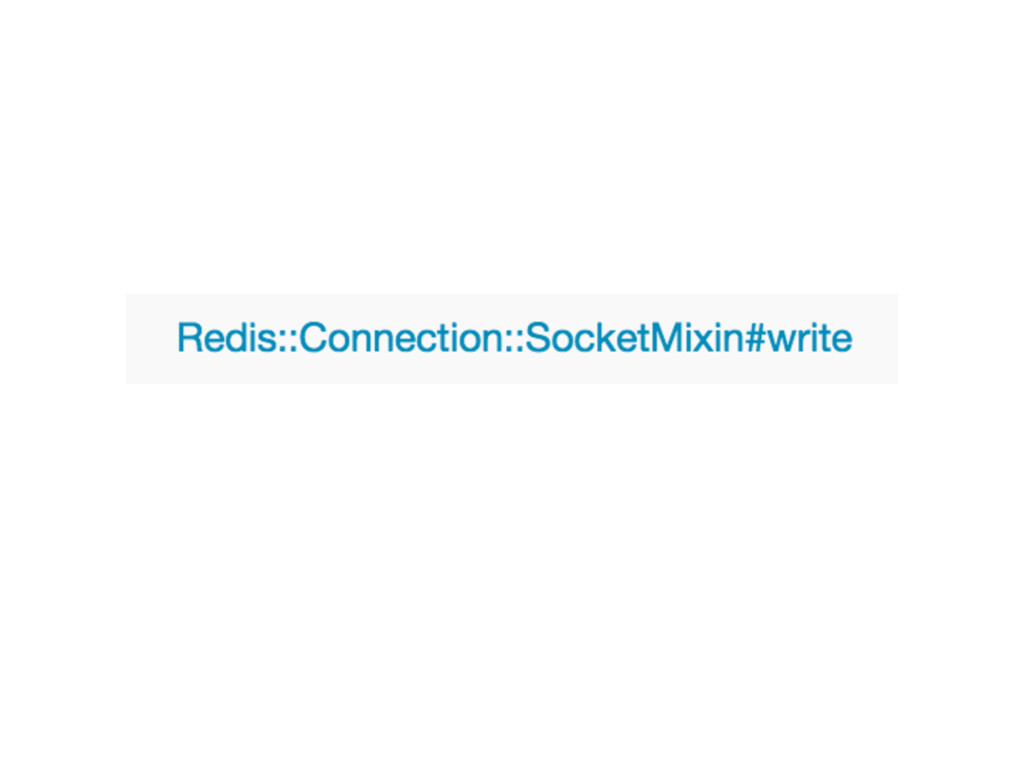
接口 X 会生成大量 Timeout 对象, 占用内存过多 总结 profile 要比 monitor
目的性更强 内存泄露确实存在, 内存随时间不断上涨
修复问题 Survive Address Fix Lesson
接口 X 做了什么? 猜是没有⽤用的,我们继续跟
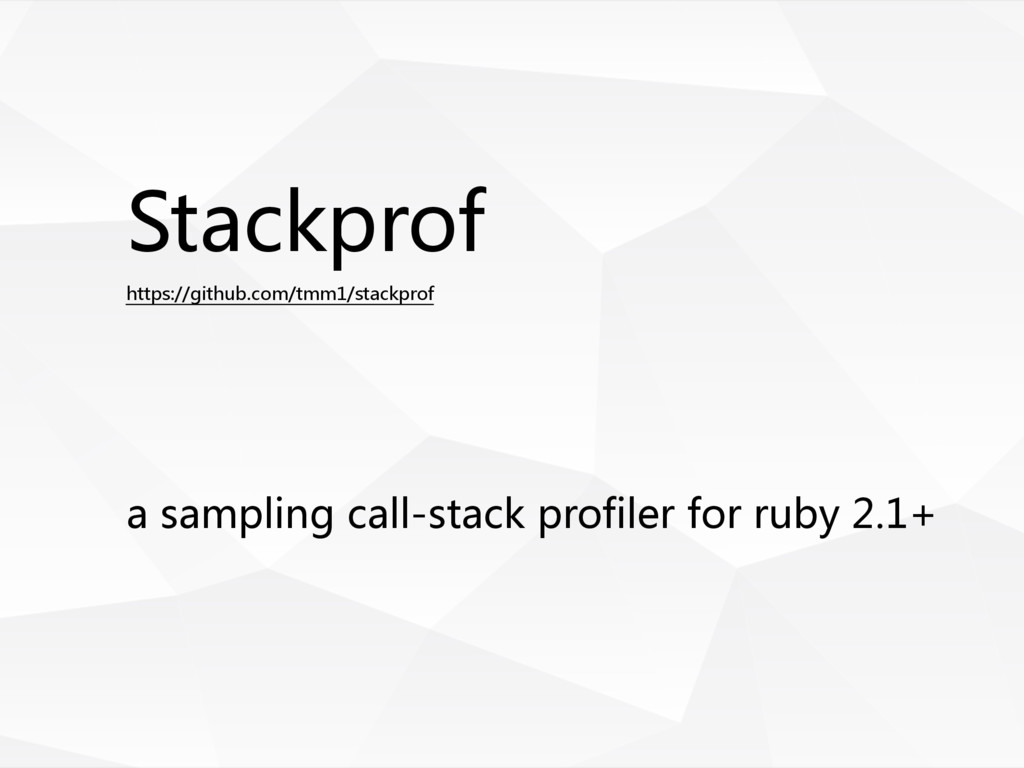
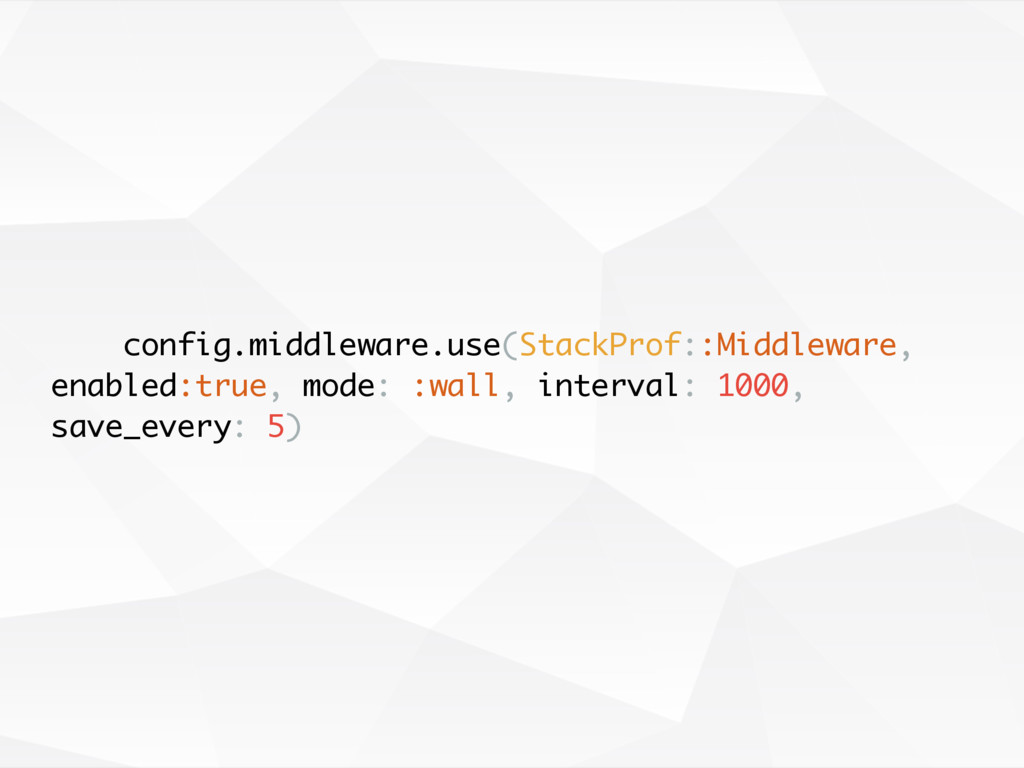
Stackprof https://github.com/tmm1/stackprof a sampling call-stack profiler for ruby 2.1+
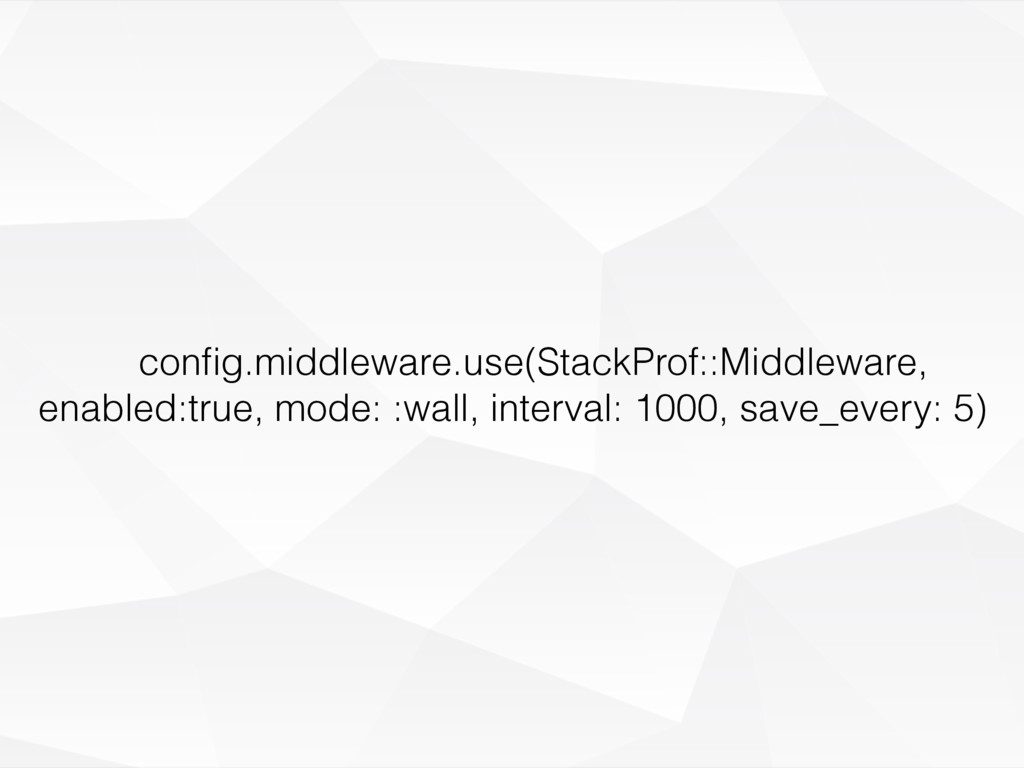
config.middleware.use(StackProf::Middleware, enabled:true, mode: :wall, interval: 1000, save_every: 5)
config.middleware.use(StackProf::Middleware, enabled:true, mode: :wall, interval: 1000, save_every: 5)
None
None
None
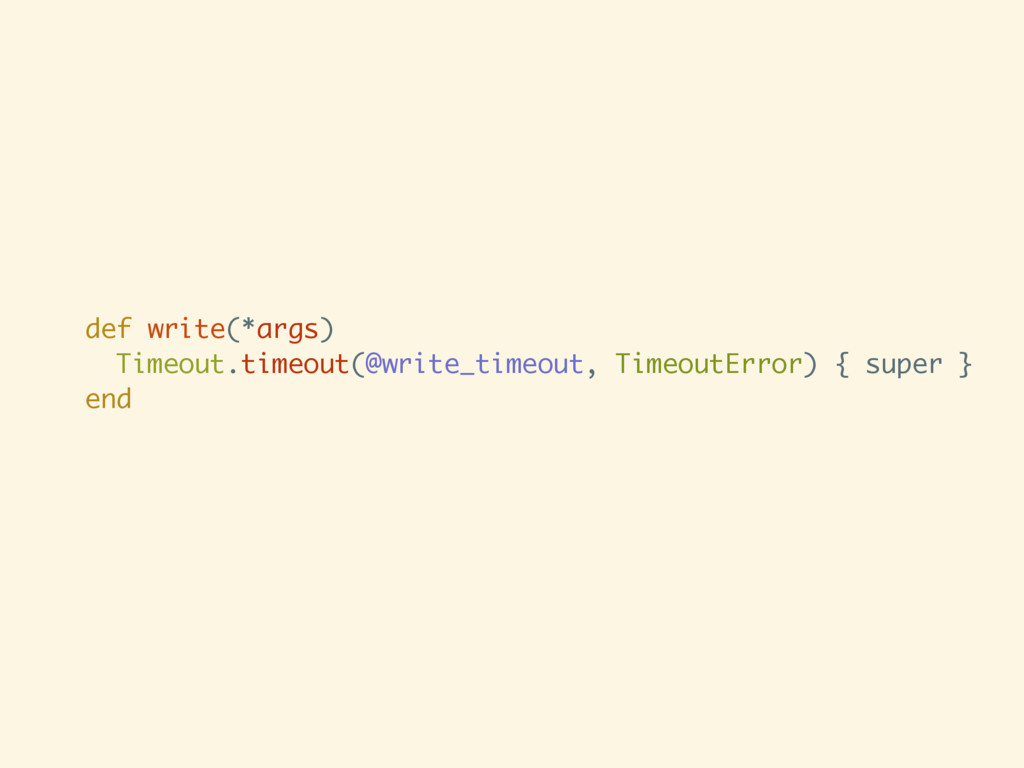
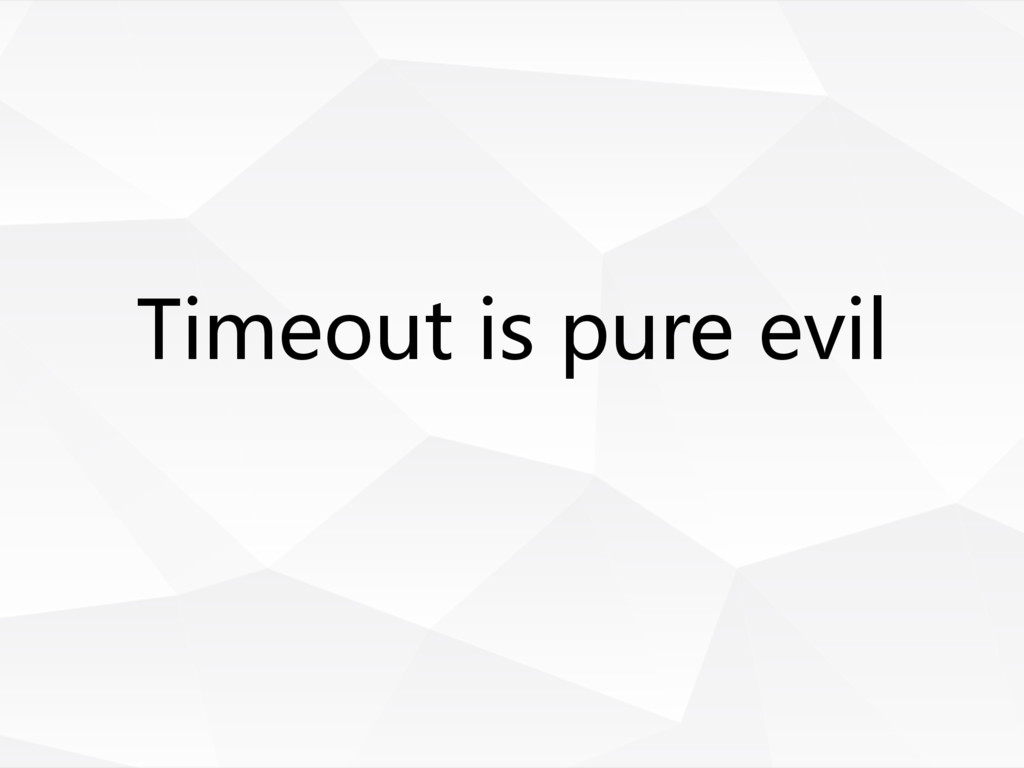
def write(*args) Timeout.timeout(@write_timeout, TimeoutError) { super } end
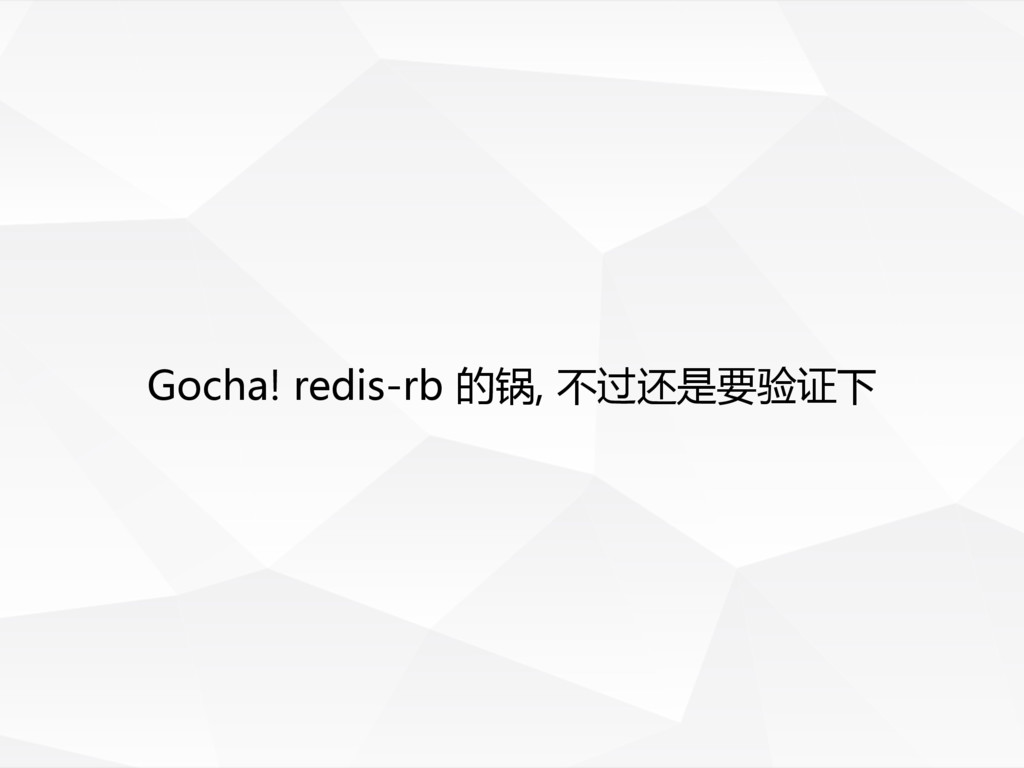
Gocha! redis-rb 的锅, 不过还是要验证下
#!/usr/bin/env ruby # encoding: utf-8 require 'memory_profiler' gem
'redis', ENV['RVERSION'] require 'redis' puts Process.pid puts Redis::VERSION MemoryProfiler.report { r = Redis.new i=0 100.times do r.set "key#{i}", "value#{i}" end }.pretty_print
None
None
None
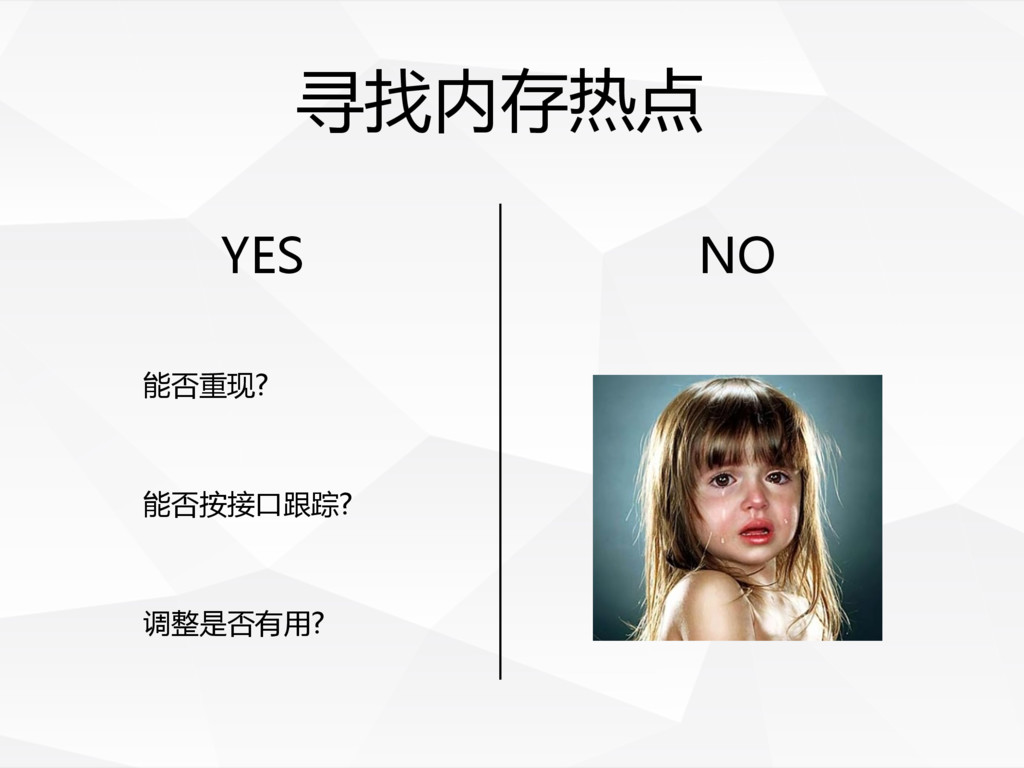
经验和教训 Survive Address Fix Lesson Learned
寻找内存热点 能否重现? 能否按接口跟踪? 调整是否有用? YES NO
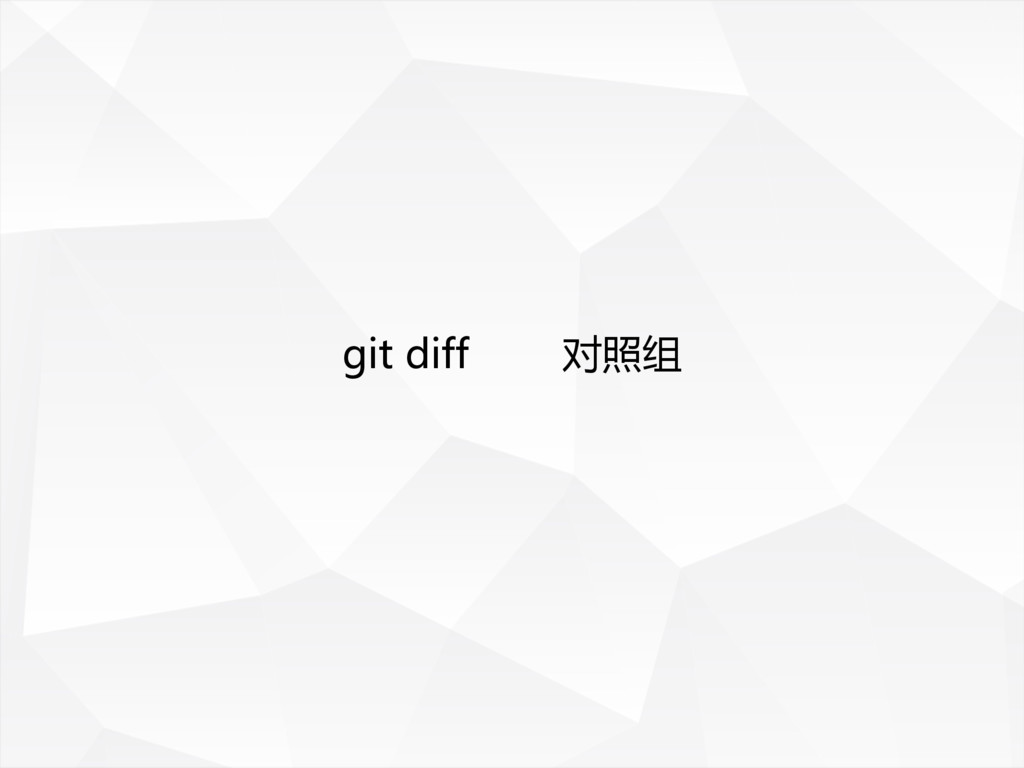
git diff 对照组
Timeout is pure evil
每个人都可能出错
None
None
None
可能其他用到的 Gem
Rbkit & Rbkit Client https://github.com/code-mancers/rbkit A new profiler for Ruby.
With a GUI http://rbkit.codemancers.com 2.3.x 下无法使用
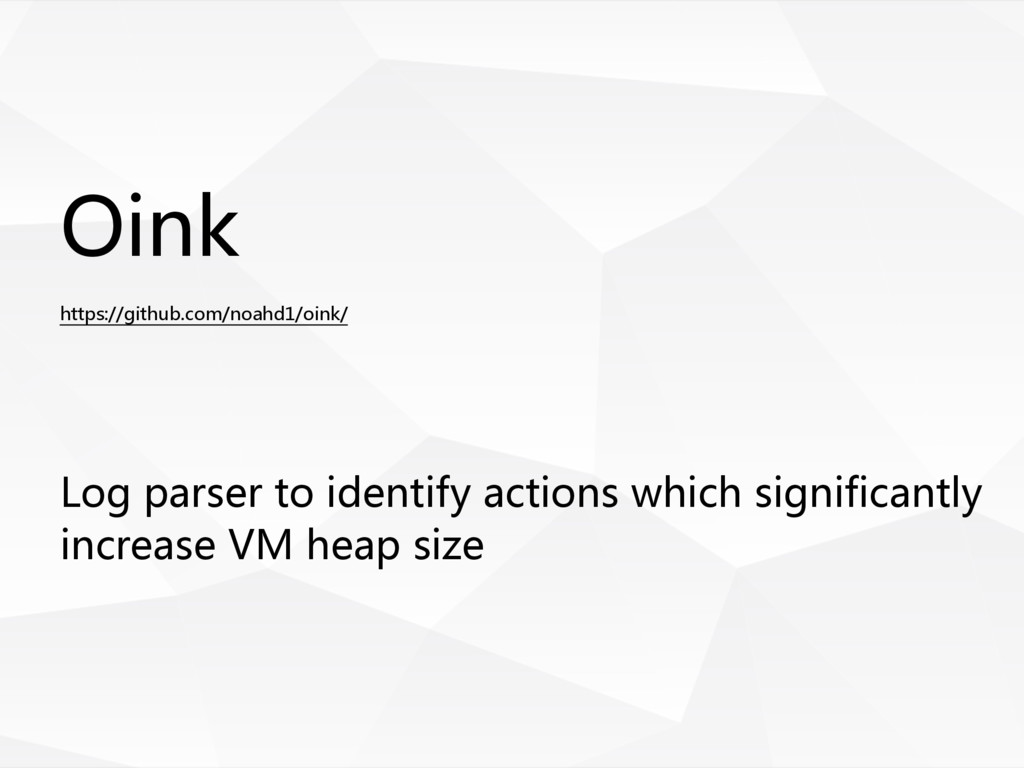
Oink https://github.com/noahd1/oink/ Log parser to identify actions which significantly increase
VM heap size
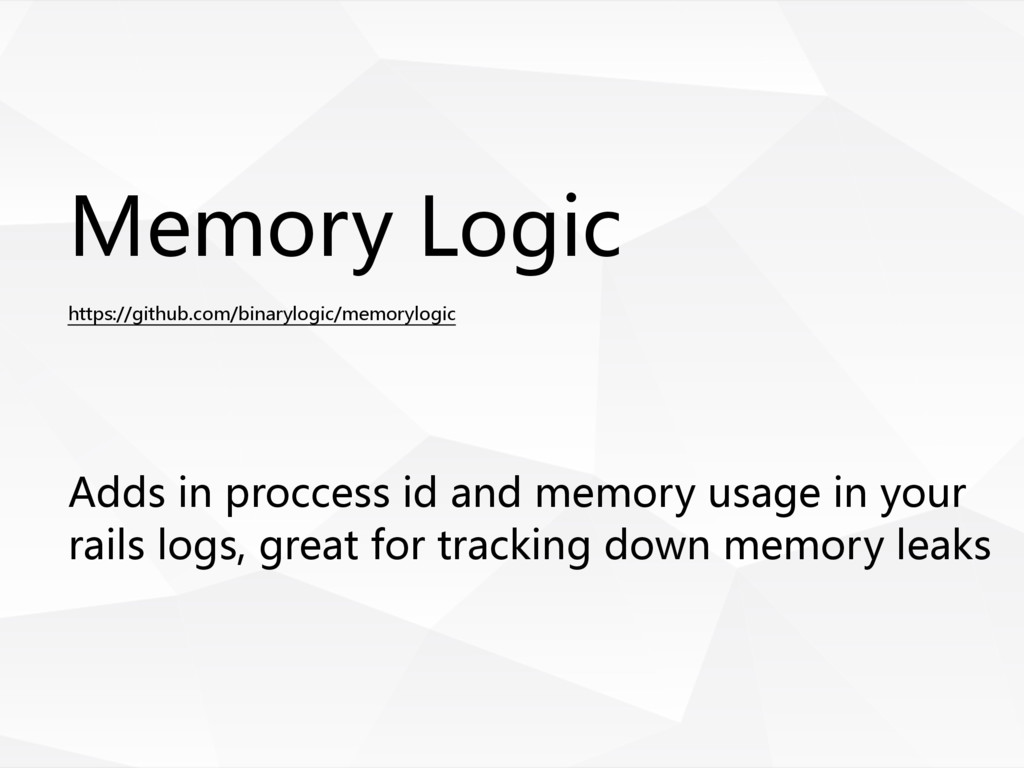
Memory Logic https://github.com/binarylogic/memorylogic Adds in proccess id and memory usage
in your rails logs, great for tracking down memory leaks
参考资料 • Ruby Under a Microscope • 垃圾回收的算法与实现 • Ruby
Performance Optimization
THANKS
Q & A
![passenger-memory-stats passenger-status top && htop cat /proc/pid/status & cat /proc/[pid]/mem](https://files.speakerdeck.com/presentations/2ad877f2e8654e92ae7391b942ab21a0/slide_26.jpg)