Upgrade to Pro — share decks privately, control downloads, hide ads and more …

CS 331E Project Phase 3

Sponsored · Your Podcast. Everywhere. Effortlessly. Share. Educate. Inspire. Entertain. You do you. We'll handle the rest. →

CS 331E Project Phase 3

Avatar for Aali Sahay

Aali Sahay

April 23, 2020

Other Decks in Technology

Transcript

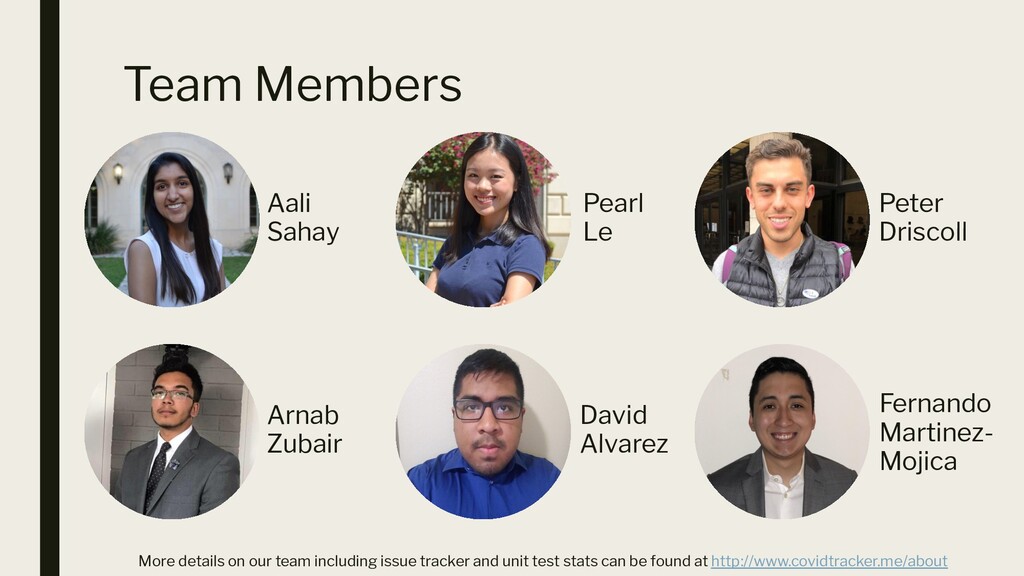
  1. Team Members Aali Sahay Arnab Zubair Peter Driscoll Pearl Le

    David Alvarez Fernando Martinez- Mojica More details on our team including issue tracker and unit test stats can be found at http://www.covidtracker.me/about
  2. Problem How to present accurate and up-to-date information about COVID-19

    and the actions being taken to address it in an easily digestible manner.
  3. Goals of the project ▪ Showcase data and visualizations regarding

    the coronavirus outbreak for people in an easily accessible manner ▪ Provide a template for displaying information about other policy issues
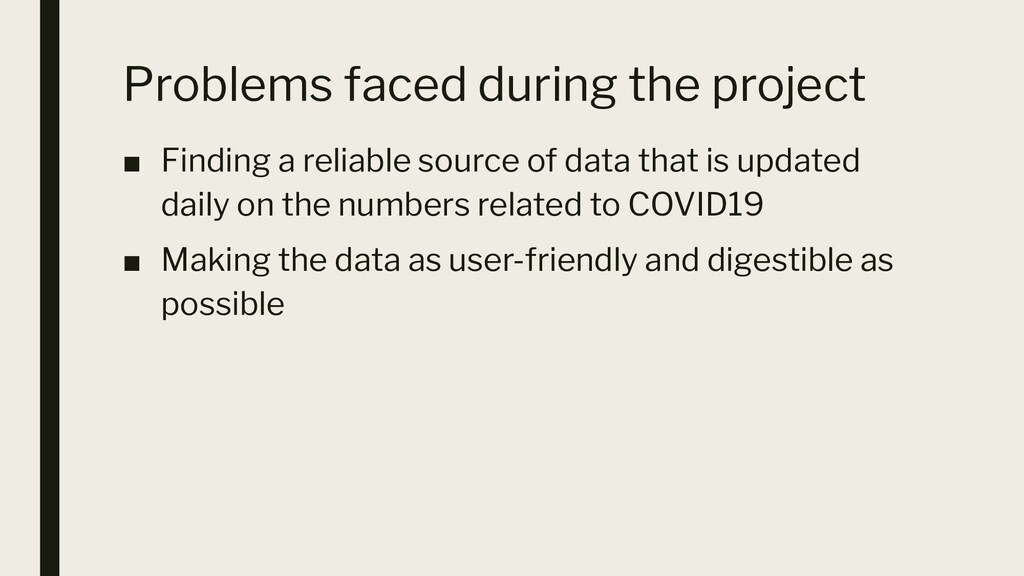
  4. Problems faced during the project ▪ Finding a reliable source

    of data that is updated daily on the numbers related to COVID19 ▪ Making the data as user-friendly and digestible as possible
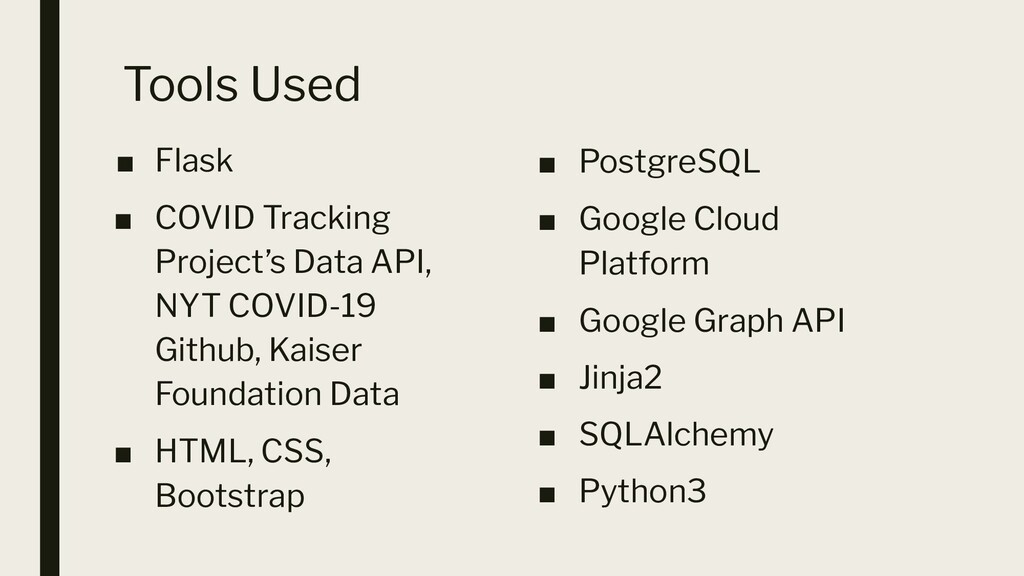
  5. Tools Used ▪ Flask ▪ COVID Tracking Project’s Data API,

    NYT COVID-19 Github, Kaiser Foundation Data ▪ HTML, CSS, Bootstrap ▪ PostgreSQL ▪ Google Cloud Platform ▪ Google Graph API ▪ Jinja2 ▪ SQLAlchemy ▪ Python3
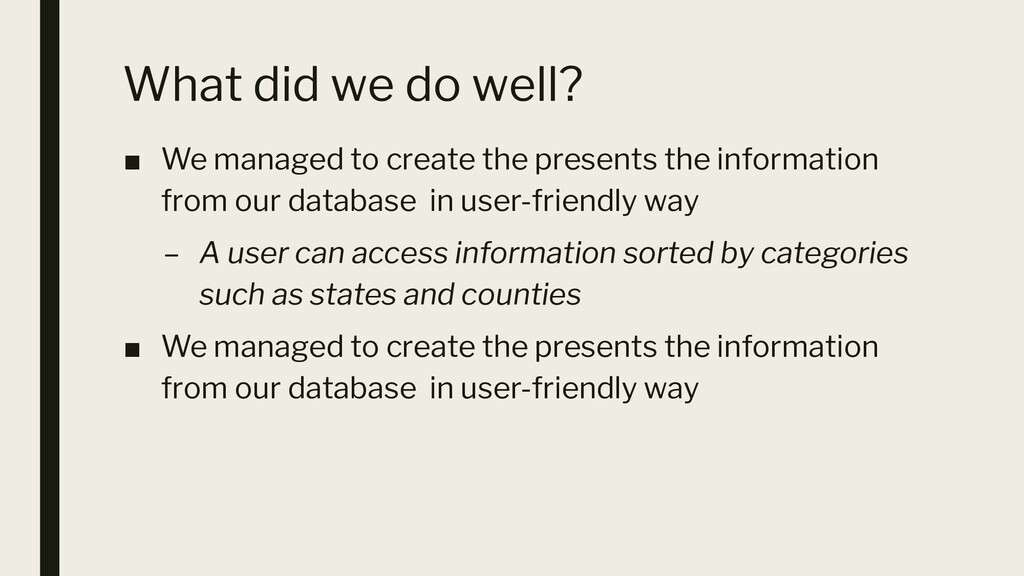
  6. What did we do well? ▪ We managed to create

    the presents the information from our database in user-friendly way – A user can access information sorted by categories such as states and counties ▪ We managed to create the presents the information from our database in user-friendly way
  7. What did we learn? ▪ The seriousness of the crisis

    with having to deal with the daily updated number we got to see the rapidly growing number ▪ With the numbers changing daily, we had to judge data sources for our project with more scrutiny as we had to make sure that the source would update daily and were as accurate as possible
  8. What can we do better? ▪ Include information about different

    countries ▪ Create more interactive maps ▪ Develop a system where you could pull up a relevant map when searching state and county information
  9. What puzzles us? ▪ We were not sure how to

    figure out how to make our visualizations more granular, such as having a county-by-county map inside of our existing state-by-state map