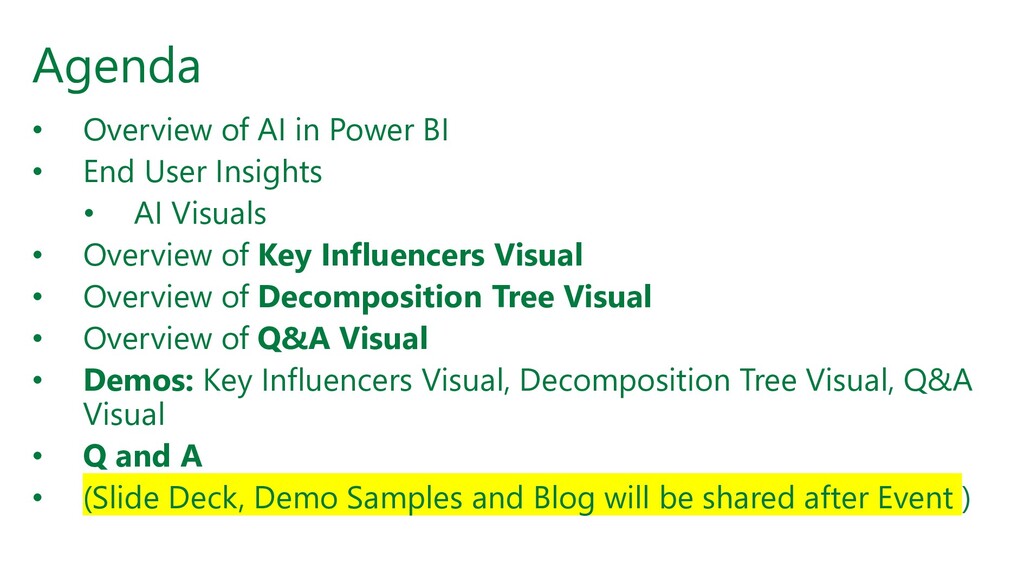
User Insights • AI Visuals • Overview of Key Influencers Visual • Overview of Decomposition Tree Visual • Overview of Q&A Visual • Demos: Key Influencers Visual, Decomposition Tree Visual, Q&A Visual • Q and A • (Slide Deck, Demo Samples and Blog will be shared after Event )
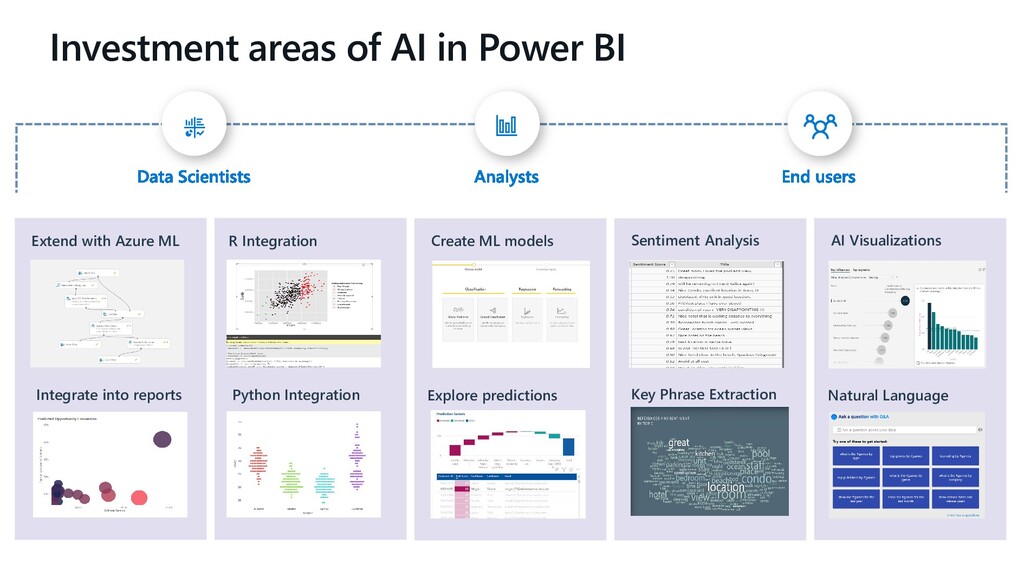
Phrase Extraction Create ML models Explore predictions Python Integration R Integration Extend with Azure ML Integrate into reports AI Visualizations Natural Language
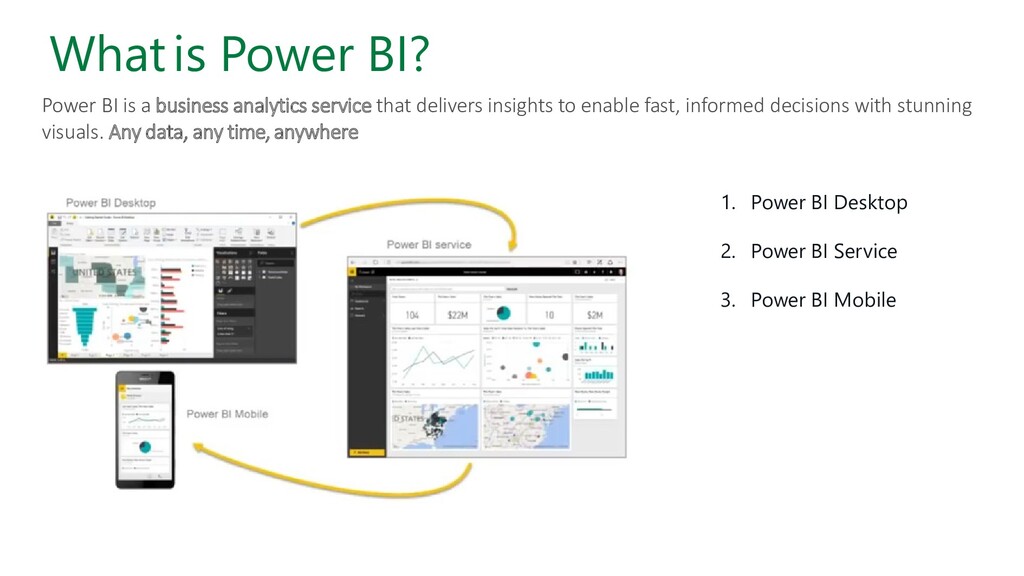
to enable fast, informed decisions with stunning visuals. Any data, any time, anywhere Whatis Power BI? 1. Power BI Desktop 2. Power BI Service 3. Power BI Mobile
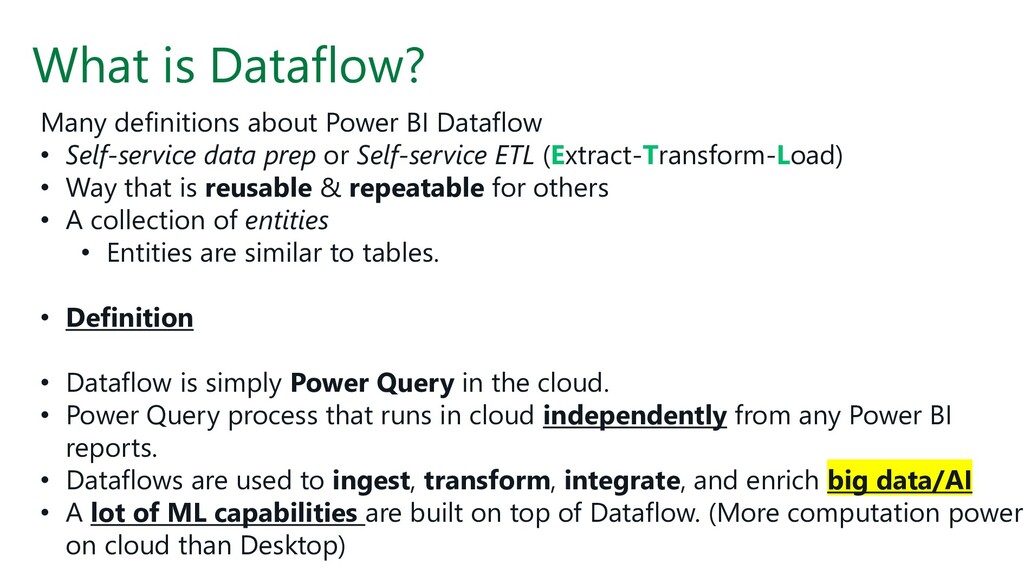
Self-service data prep or Self-service ETL (Extract-Transform-Load) • Way that is reusable & repeatable for others • A collection of entities • Entities are similar to tables. • Definition • Dataflow is simply Power Query in the cloud. • Power Query process that runs in cloud independently from any Power BI reports. • Dataflows are used to ingest, transform, integrate, and enrich big data/AI • A lot of ML capabilities are built on top of Dataflow. (More computation power on cloud than Desktop)
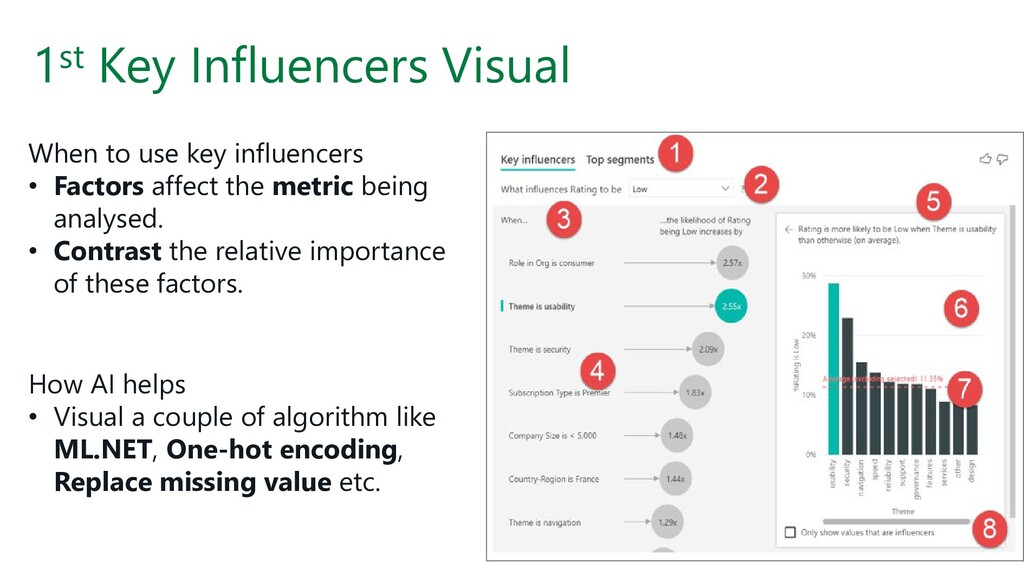
Factors affect the metric being analysed. • Contrast the relative importance of these factors. How AI helps • Visual a couple of algorithm like ML.NET, One-hot encoding, Replace missing value etc.
not supported • Azure Analysis Services and SSAS is not supported • Publish to Web is not supported • .NET FX 4.6 above or higher is required • Aggregates and measures are not supported.
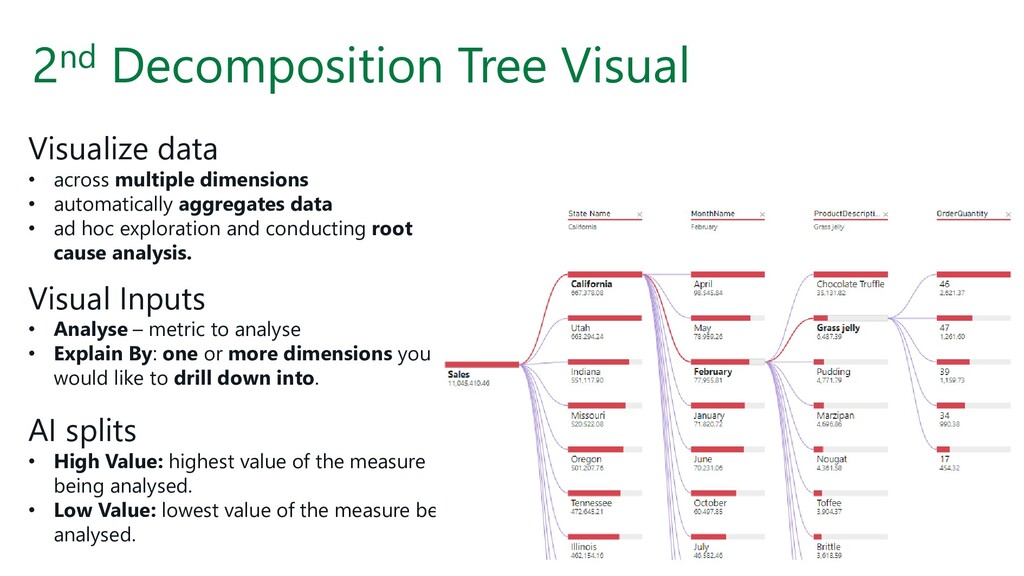
• automatically aggregates data • ad hoc exploration and conducting root cause analysis. Visual Inputs • Analyse – metric to analyse • Explain By: one or more dimensions you would like to drill down into. AI splits • High Value: highest value of the measure being analysed. • Low Value: lowest value of the measure being analysed.
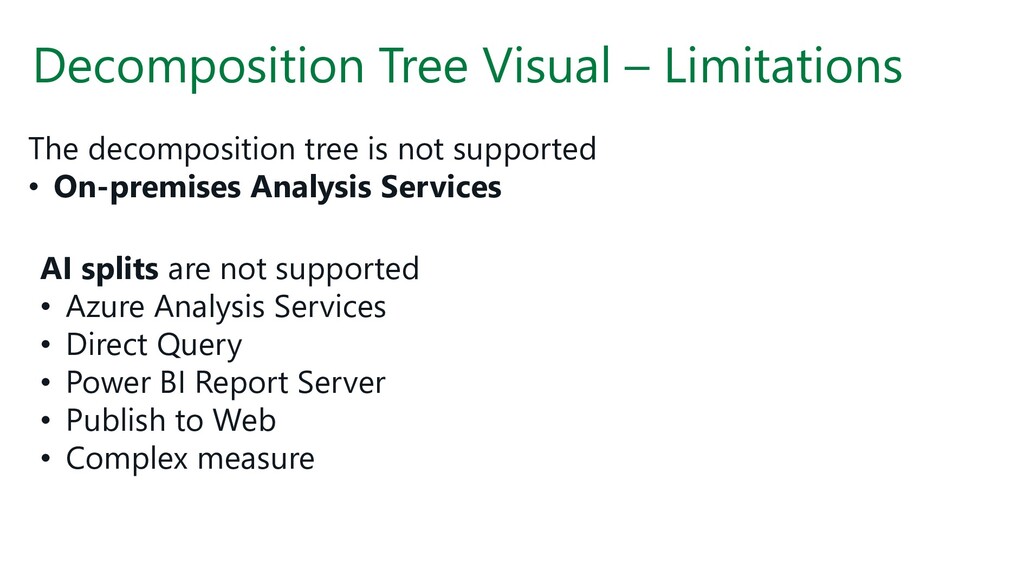
supported • On-premises Analysis Services AI splits are not supported • Azure Analysis Services • Direct Query • Power BI Report Server • Publish to Web • Complex measure
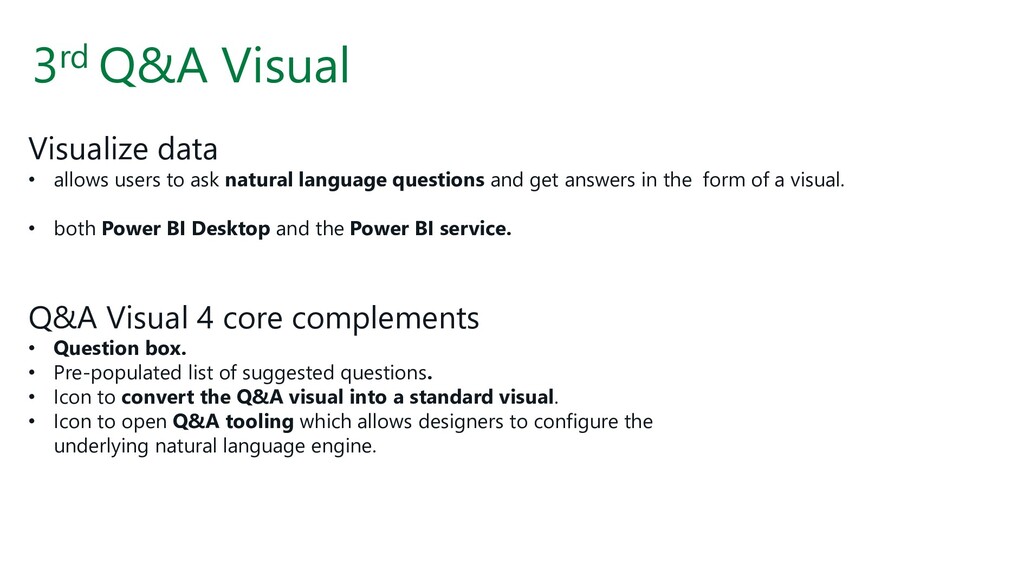
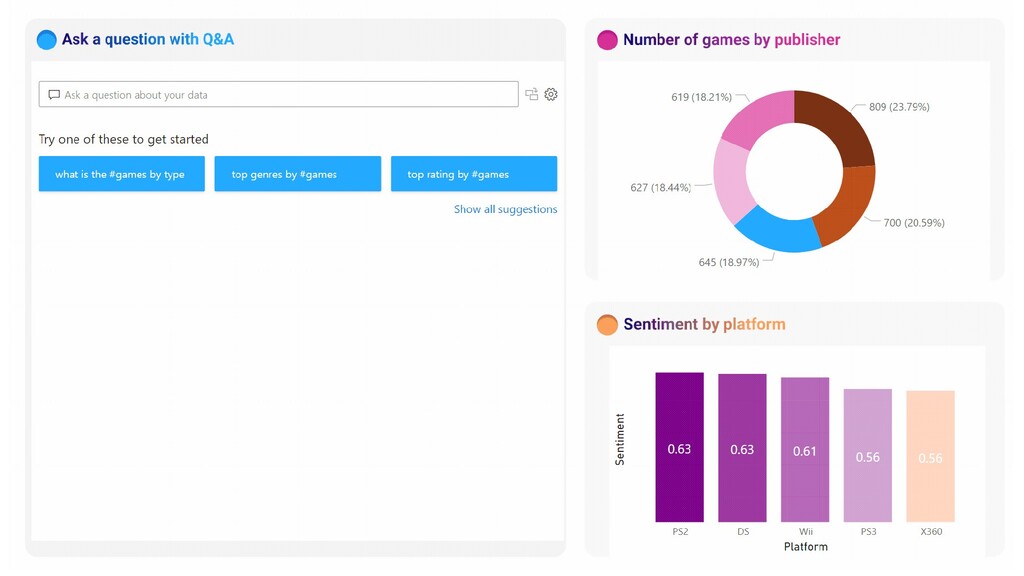
natural language questions and get answers in the form of a visual. • both Power BI Desktop and the Power BI service. Q&A Visual 4 core complements • Question box. • Pre-populated list of suggested questions. • Icon to convert the Q&A visual into a standard visual. • Icon to open Q&A tooling which allows designers to configure the underlying natural language engine.
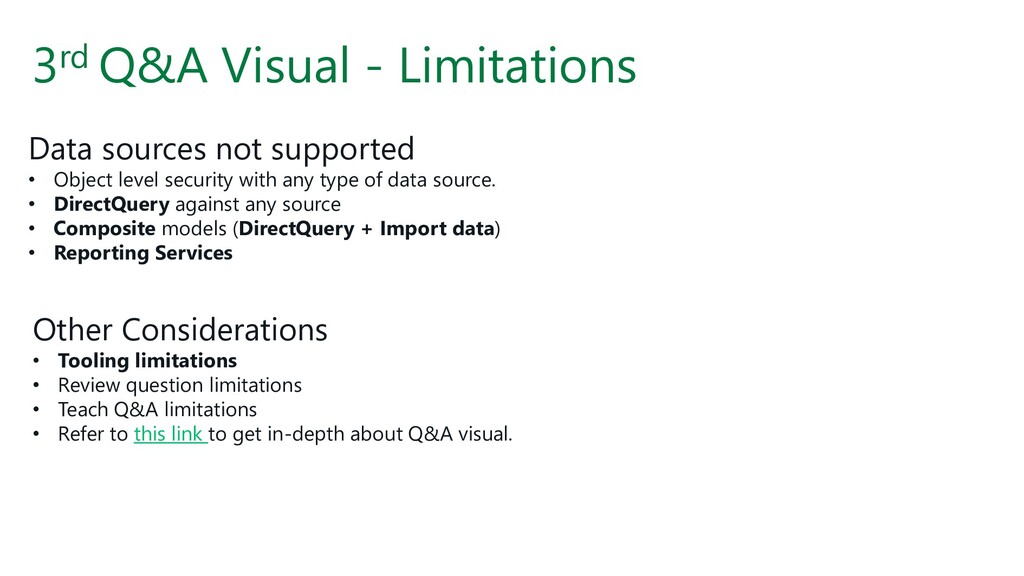
Object level security with any type of data source. • DirectQuery against any source • Composite models (DirectQuery + Import data) • Reporting Services Other Considerations • Tooling limitations • Review question limitations • Teach Q&A limitations • Refer to this link to get in-depth about Q&A visual.