Upgrade to Pro — share decks privately, control downloads, hide ads and more …

Debugging PHP Applications

Aaron Holbrook
November 03, 2023
37

Debugging PHP Applications

Discover the art of debugging PHP applications with finesse in this dynamic session. Debugging is a vital skill for developers, enabling efficient issue identification and resolution. Join us as we explore proven techniques and powerful tools that will empower you to become a master troubleshooter.

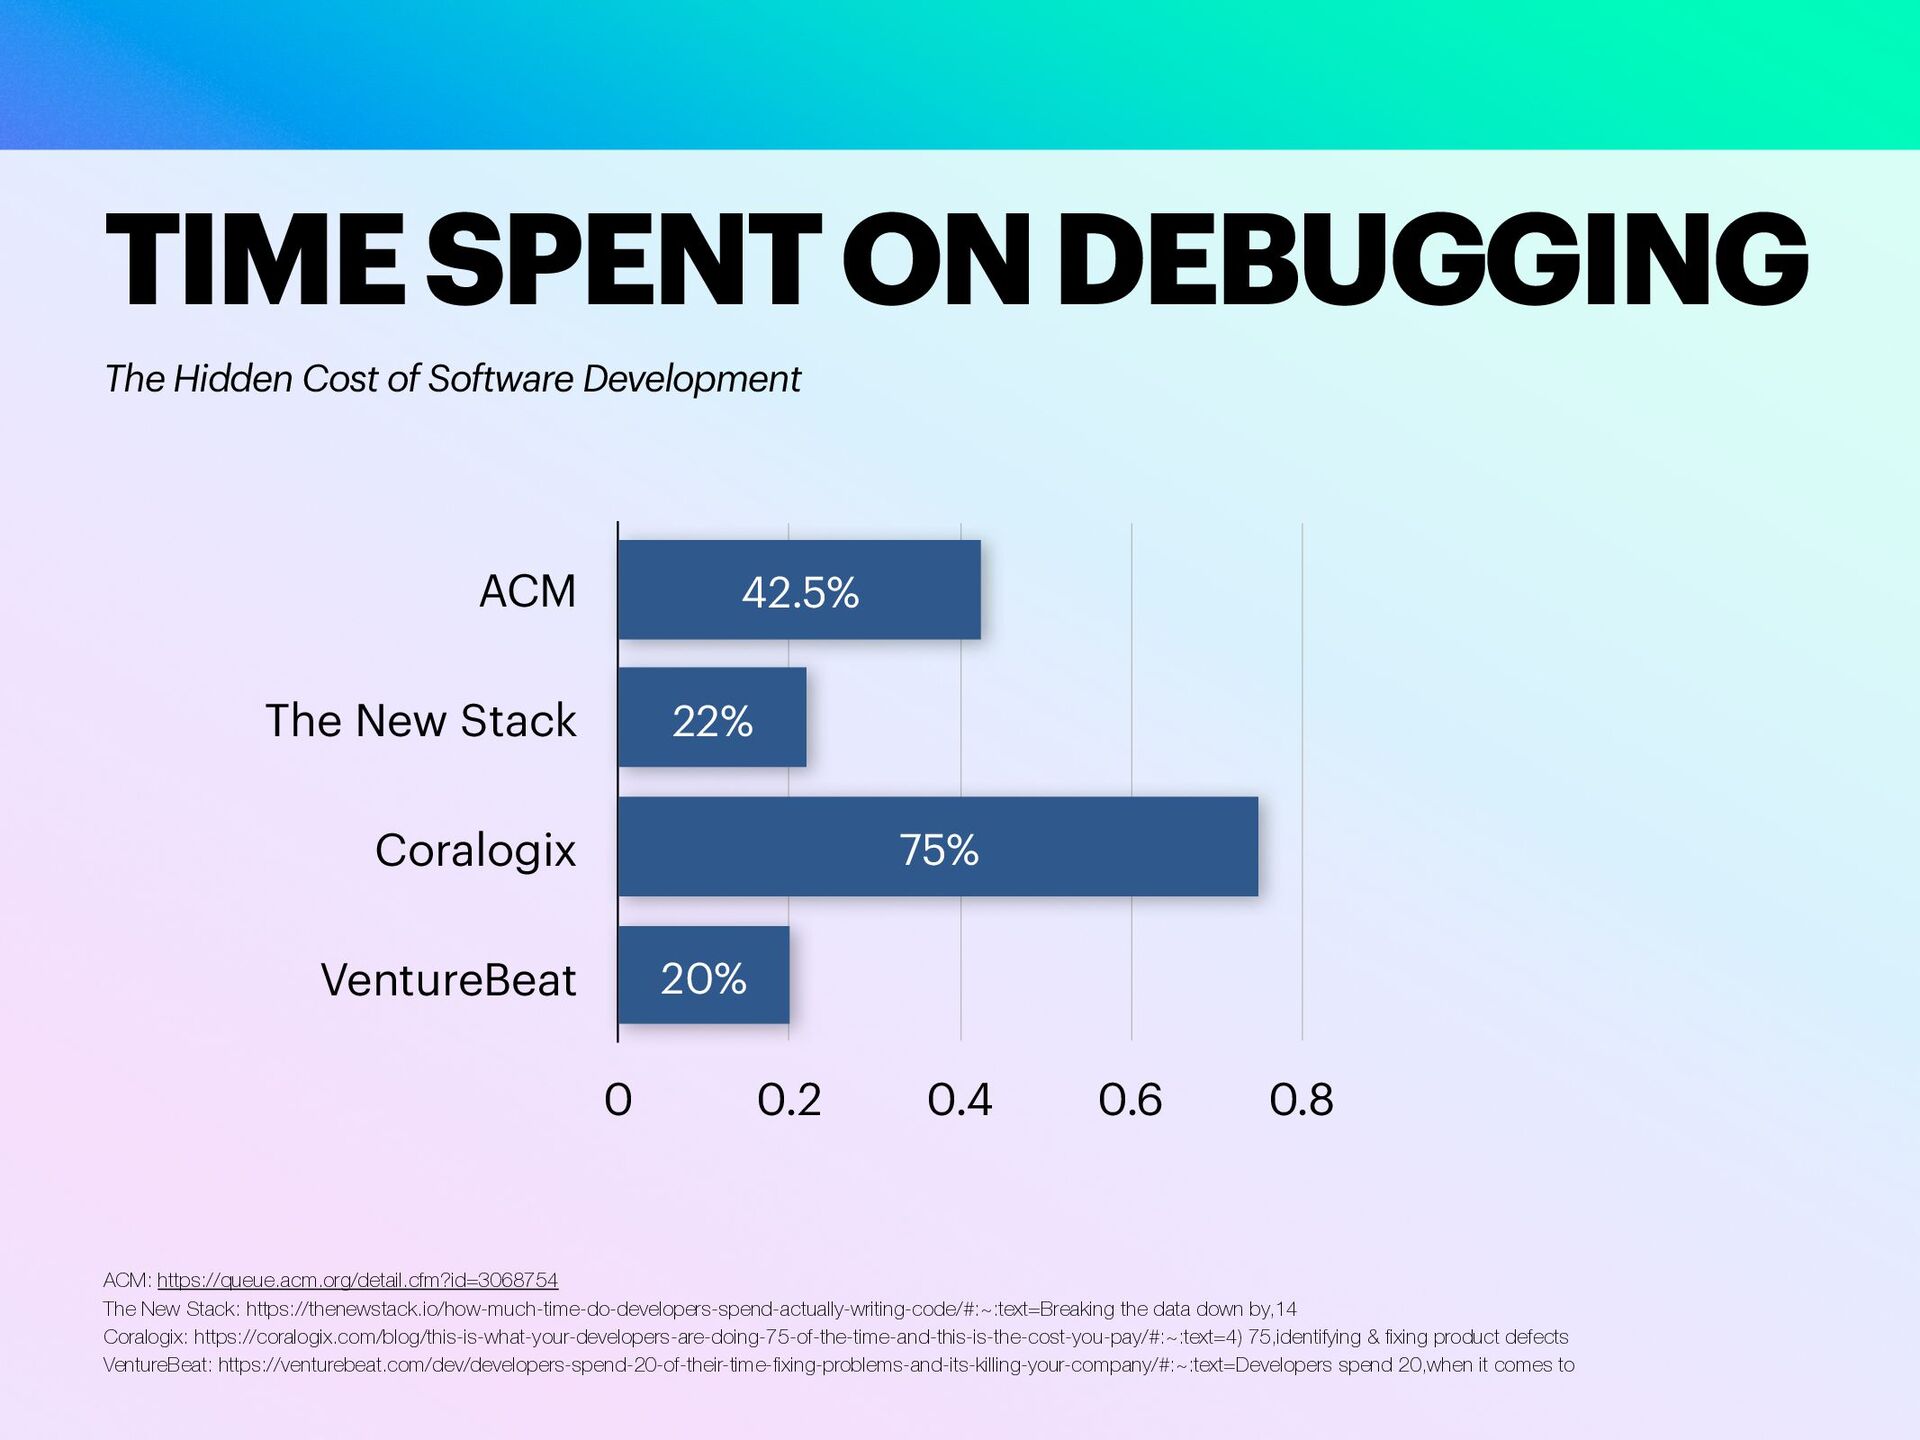
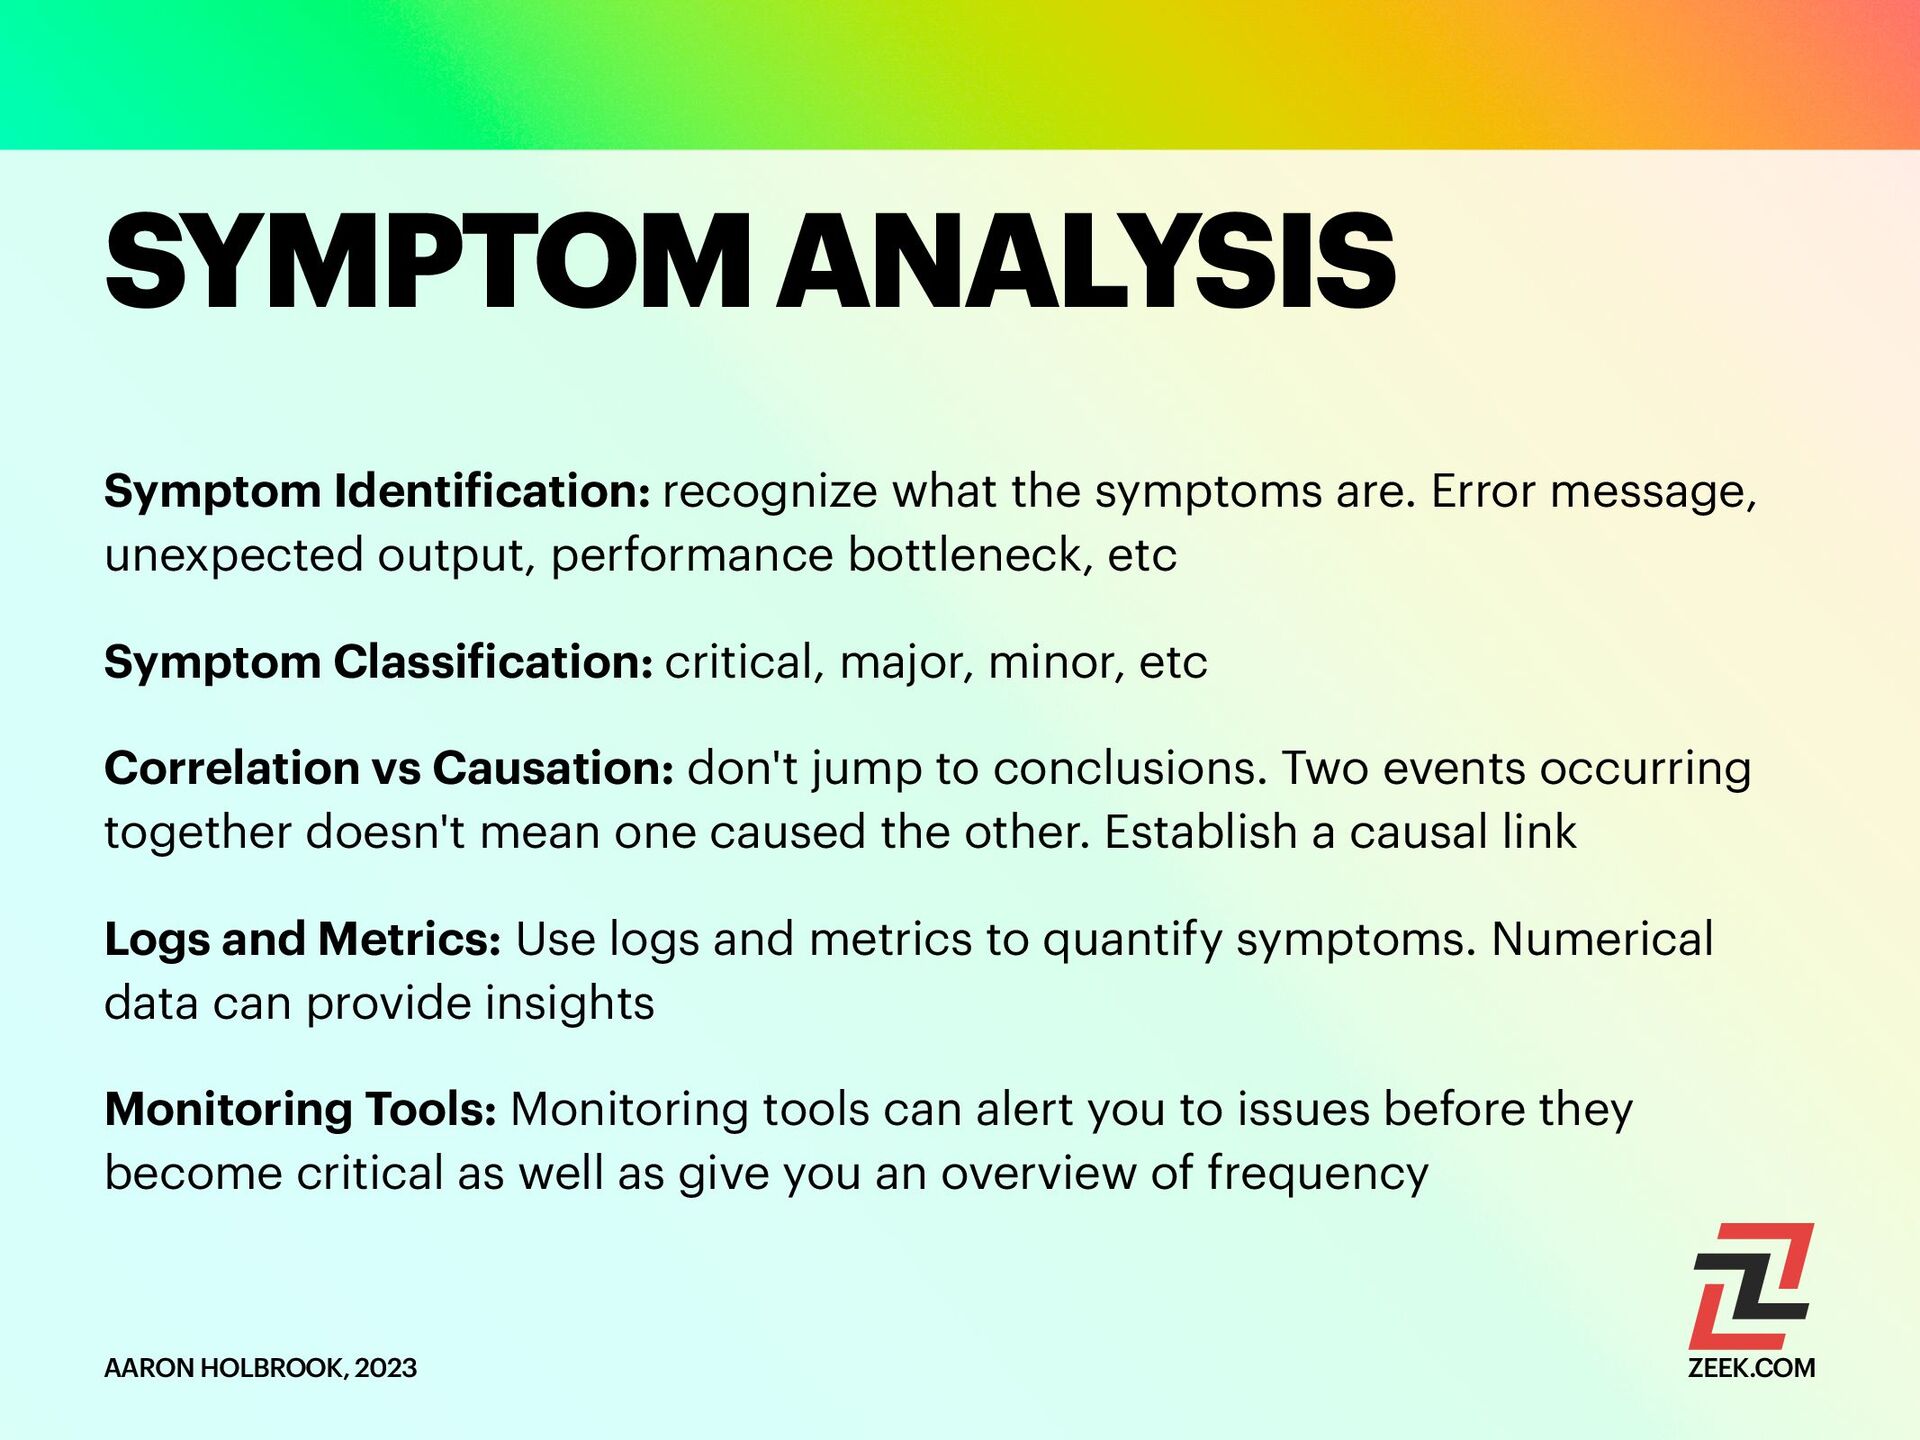
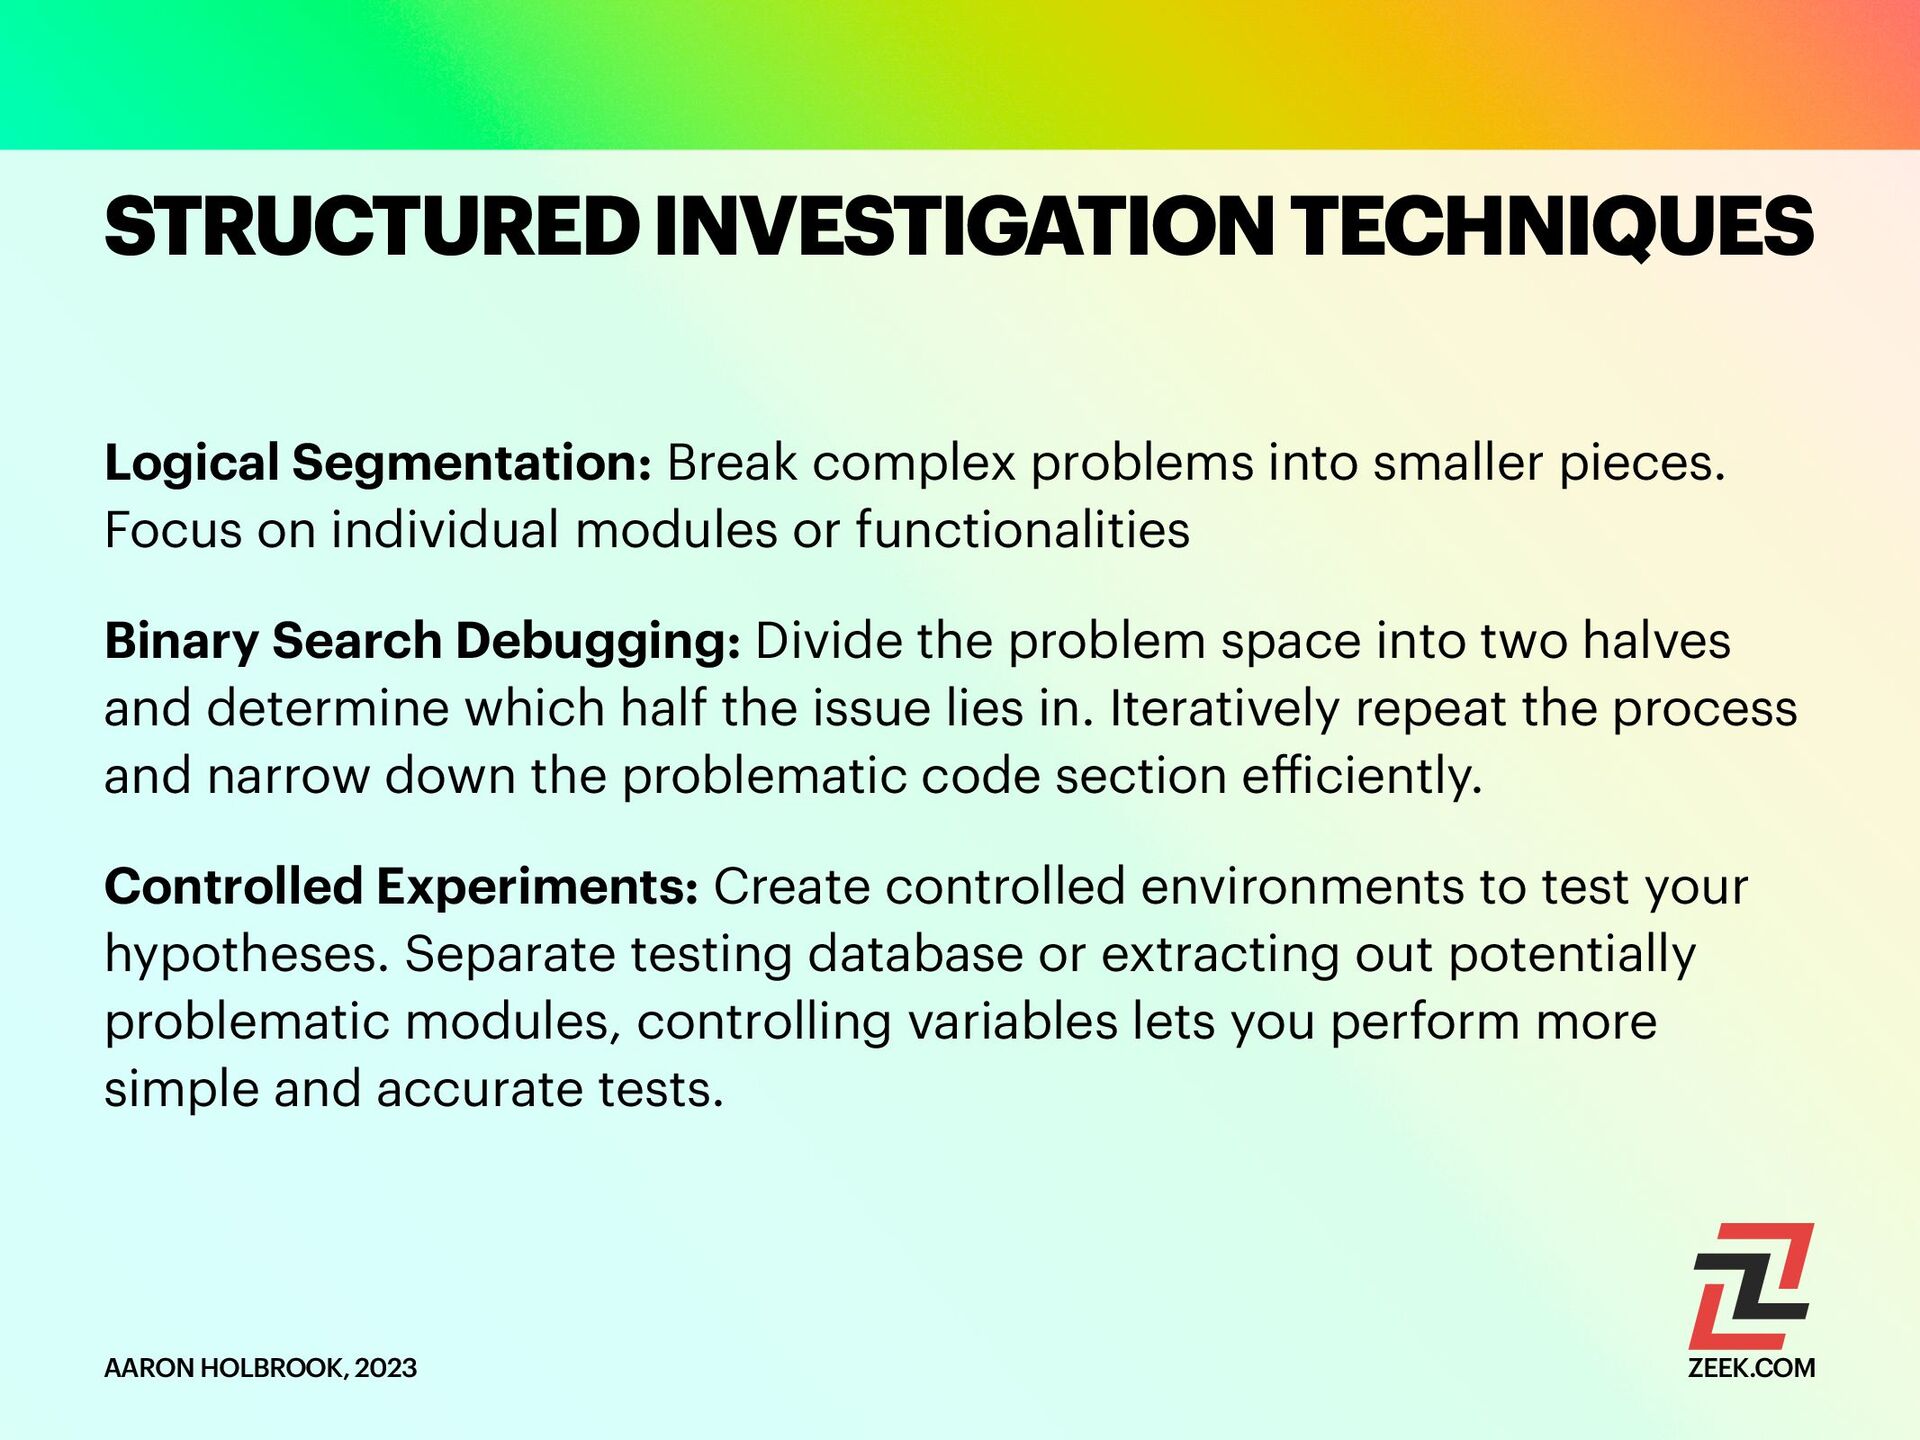
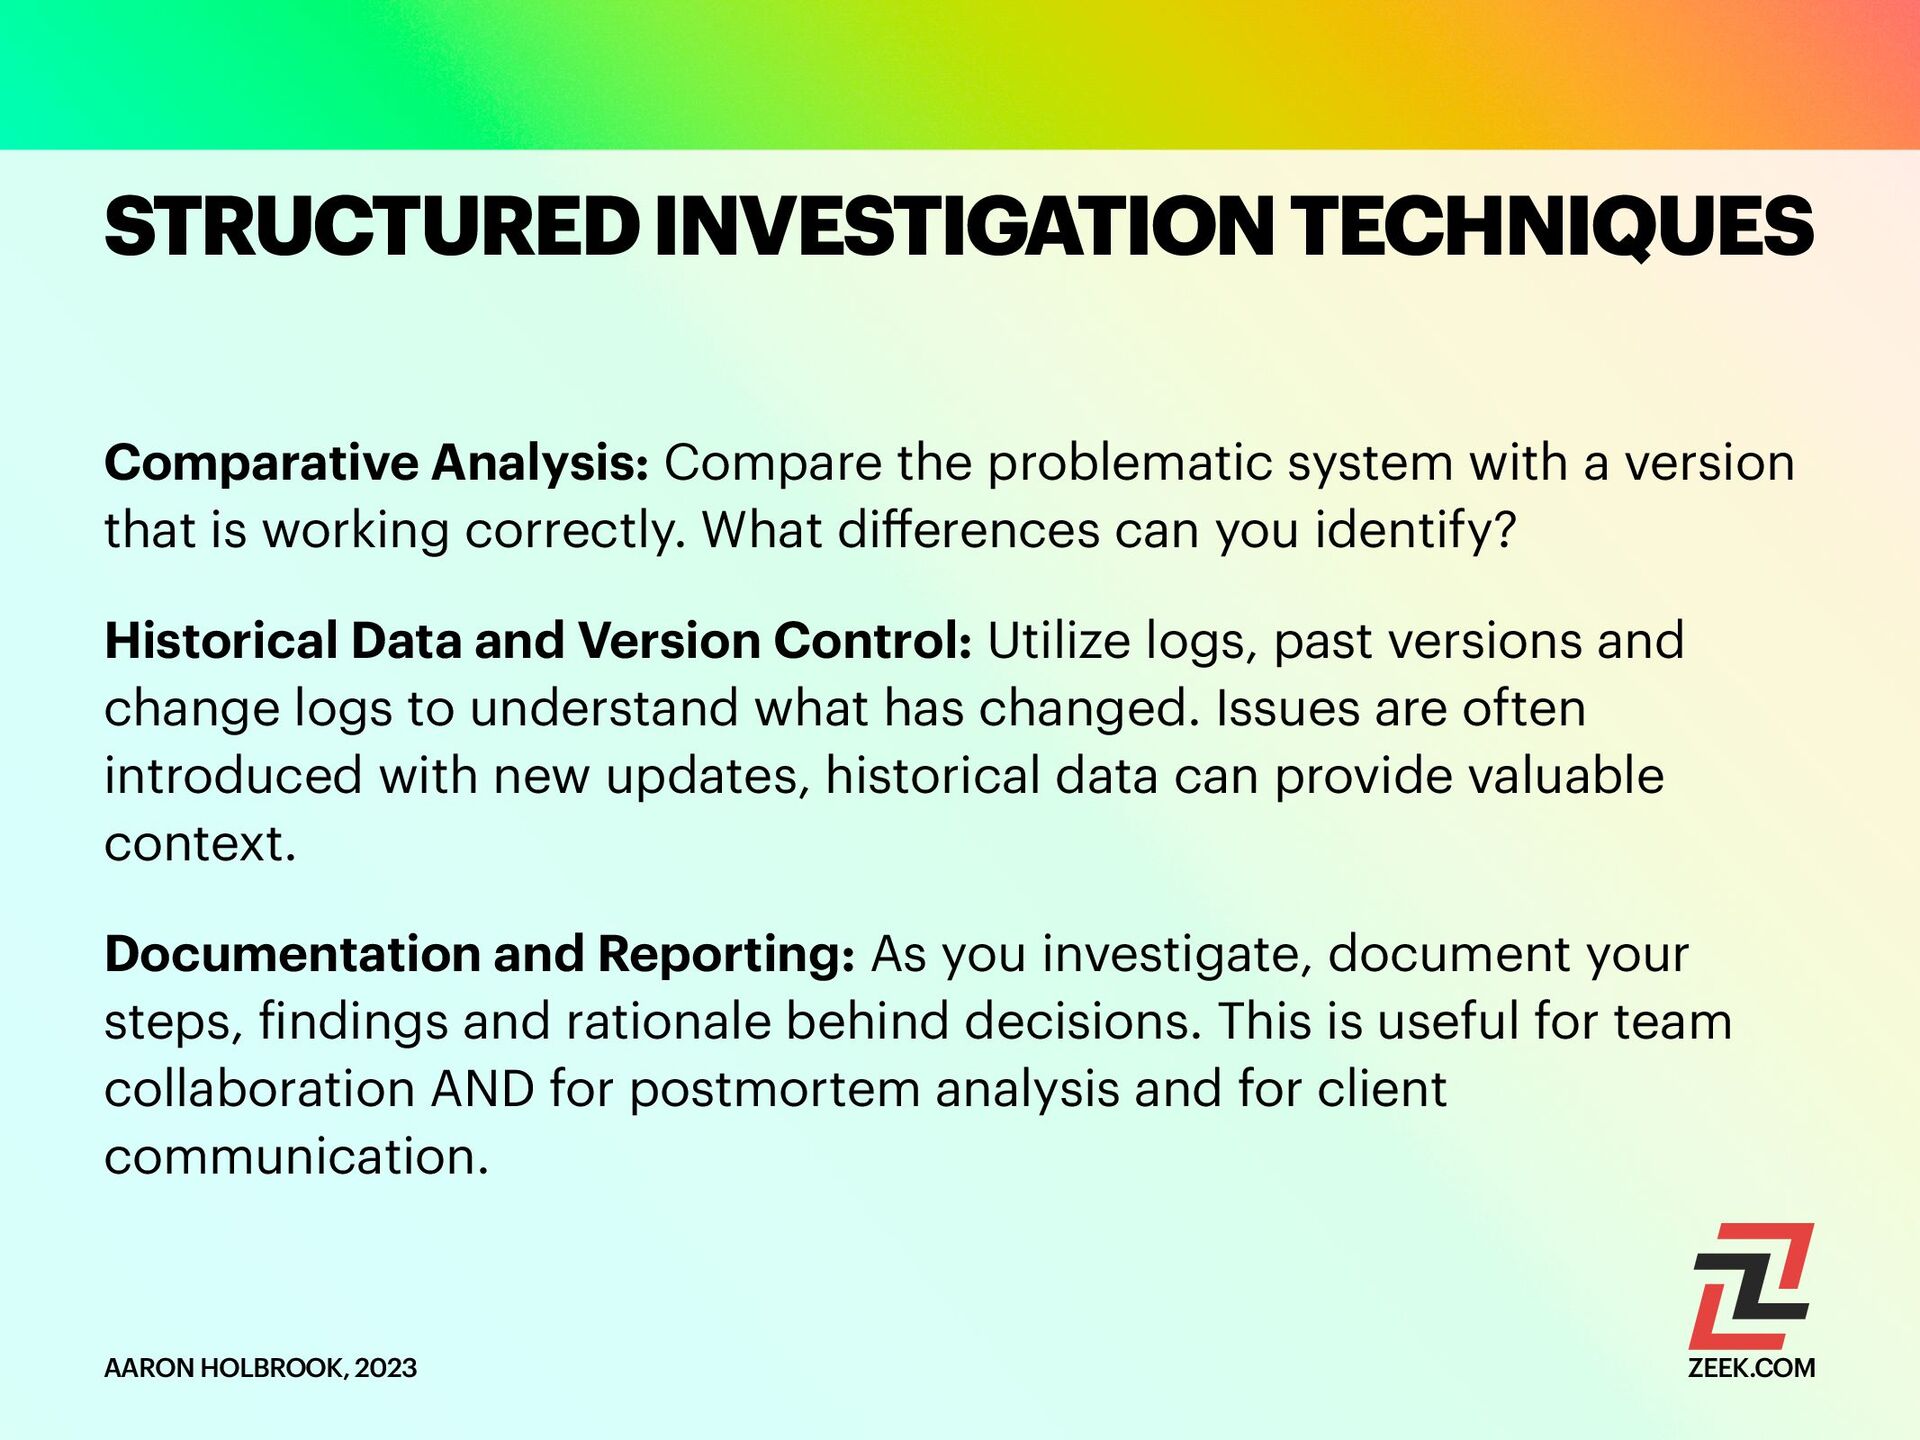
During this session, we will start by discussing the fundamental principles of problem-solving. We will explore strategies for dissecting complex issues and narrowing down the problem space effectively. Discover how to ask the right questions, analyze symptoms, and perform systematic investigations that lead you closer to the root cause.

Next, we will explore the indispensable role of tools in the debugging process. Explore how to leverage the capabilities of integrated development environments (IDEs) to streamline your debugging workflow. Learn how to set breakpoints, inspect variables, and step through code execution for precise analysis.

One of the most powerful tools at your disposal is xDebug. Dive into its advanced features and gain practical insights on utilizing it effectively. Discover how to set up xDebug, capture stack traces, and leverage its remote debugging capabilities to solve even the trickiest bugs.

Key Takeaways:

Fundamental techniques for efficient debugging and problem-solving
Strategies for narrowing down the problem space and identifying root causes
Harnessing the power of integrated development environments (IDEs) for effective debugging

Deep dive into xDebug: setup, advanced features, and remote debugging
Practical tips and best practices for troubleshooting PHP applications
Join me for an enlightening session where we will unravel the secrets of debugging PHP applications. Equip yourself with the skills, techniques, and tools necessary to become an adept troubleshooter confidently untangling even the most intricate bugs. Elevate your debugging prowess and master the art of efficient troubleshooting in PHP!

Aaron Holbrook

November 03, 2023
Tweet

Transcript

  1. Techniques and Tools for Ef f icient Troubleshooting DEBUGGING PHP

    APPLICATIONS AARON HOLBROOK, 2023 ZEEK.COM
  2. THE FIRST STEP OF DEBUGGING IS TO KNOW THAT A

    PROBLEM EXISTS. THE FINAL STEP IS FIXING IT. EVERYTHING IN BETWEEN IS PROBLEM-SOLVING.
  3. The Hidden Cost of Software Development TIME SPENT ON DEBUGGING

    ACM The New Stack Coralogix VentureBeat 0 0.2 0.4 0.6 0.8 20% 75% 22% 42.5% ACM: https://queue.acm.org/detail.cfm?id=3068754 The New Stack: https://thenewstack.io/how-much-time-do-developers-spend-actually-writing-code/#:~:text=Breaking the data down by,14 Coralogix: https://coralogix.com/blog/this-is-what-your-developers-are-doing-75-of-the-time-and-this-is-the-cost-you-pay/#:~:text=4) 75,identifying & fi xing product defects VentureBeat: https://venturebeat.com/dev/developers-spend-20-of-their-time- fi xing-problems-and-its-killing-your-company/#:~:text=Developers spend 20,when it comes to
  4. The Hidden Cost of Software Development FINANCIAL IMPACT OF DEBUGGING

    Debugging Cost in the US Annual Cost (in billions) $113 Coralogix: https://coralogix.com/blog/this-is-what-your-developers-are-doing-75-of-the-time-and-this-is-the-cost-you-pay/#:~:text=4) 75,identifying & fi xing product defects
  5. AARON HOLBROOK Over 20 years of development experience Public Speaker

    & Workshop Leader Driven by E ff iciency & Problem-Solving A Lifelong Builder: Digital & Physical AARON HOLBROOK, 2023 ZEEK.COM Your Debugging Expert for the Day Principal Engineer at Zeek: Specializing in Solving Problems
  6. A Strategic Guide to Mastering PHP Troubleshooting Debugging Fundamentals Analyzing

    Symptoms Asking the Right Questions Forming Hypotheses Finding the Root Cause Git Bisect The xDebug Deep Dive Practical Tips THE DEBUGGERS TOOLKIT AARON HOLBROOK, 2023 ZEEK.COM
  7. THE SCIENTIFIC METHOD A Tried and True Framework for Systematic

    Inquiry Observation Question Hypothesis Experimentation Analysis Conclusion AARON HOLBROOK, 2023 ZEEK.COM
  8. SYMPTOM ANALYSIS Symptom Identi f ication: recognize what the symptoms

    are. Error message, unexpected output, performance bottleneck, etc Symptom Classi f ication: critical, major, minor, etc Correlation vs Causation: don't jump to conclusions. Two events occurring together doesn't mean one caused the other. Establish a causal link Logs and Metrics: Use logs and metrics to quantify symptoms. Numerical data can provide insights Monitoring Tools: Monitoring tools can alert you to issues before they become critical as well as give you an overview of frequency AARON HOLBROOK, 2023 ZEEK.COM
  9. TYPES OF QUESTIONS Diagnostic: When does this error occur? Causal:

    What changed recently? Exploratory: Could this issue be related to another feature? AARON HOLBROOK, 2023 ZEEK.COM
  10. STRUCTURED INVESTIGATION TECHNIQUES Logical Segmentation: Break complex problems into smaller

    pieces. Focus on individual modules or functionalities Binary Search Debugging: Divide the problem space into two halves and determine which half the issue lies in. Iteratively repeat the process and narrow down the problematic code section e ff iciently. Controlled Experiments: Create controlled environments to test your hypotheses. Separate testing database or extracting out potentially problematic modules, controlling variables lets you perform more simple and accurate tests. AARON HOLBROOK, 2023 ZEEK.COM
  11. STRUCTURED INVESTIGATION TECHNIQUES Comparative Analysis: Compare the problematic system with

    a version that is working correctly. What di ff erences can you identify? Historical Data and Version Control: Utilize logs, past versions and change logs to understand what has changed. Issues are often introduced with new updates, historical data can provide valuable context. Documentation and Reporting: As you investigate, document your steps, f indings and rationale behind decisions. This is useful for team collaboration AND for postmortem analysis and for client communication. AARON HOLBROOK, 2023 ZEEK.COM
  12. GIT BISECT A Git command-line tool for isolating the commit

    that introduced a bug. AARON HOLBROOK, 2023 ZEEK.COM What Is It
  13. GIT BISECT AARON HOLBROOK, 2023 ZEEK.COM How It Works The

    Algorithm: Uses binary search to quickly identify problematic commits Good vs Bad Commits: Mark a known good commit and a known bad commit to start the search
  14. GIT BISECT AARON HOLBROOK, 2023 ZEEK.COM Practical Application Why It's

    a Game-Changer: Saves time and increases accuracy in debugging PHP projects. Quick Walkthrough: A brief example of using git bisect in a PHP codebase
  15. MASTERING XDEBUG Breakpoints Variable Inspection Evaluating Expressions Call Stack /

    Stack Trace Watches Your Ultimate Debugging Companion AARON HOLBROOK, 2023 ZEEK.COM
  16. Reproducibility is Key Divide and Conquer Observe and Note Everything

    Learn Keyboard Shortcuts Keep the Code Base Clean Know When to Step Away Add Tracing When Stuck Think Outside the Box
  17. CONCLUSION Debugging Fundamentals Analyzing Symptoms Asking the Right Questions Forming

    Hypotheses Finding the Root Cause Git Bisect xDebug Practical Tips Key Takeaways AARON HOLBROOK, 2023 ZEEK.COM
  18. Q&A

  19. 🌐 Flexible Work Environment 💡 Innovative Projects 🌱 Growth and

    Development Opportunities ⚖ Work-Life Balance 🏡 100% remote 📜 Seasoned company history with top talent 💰 Competitive Compensation 🛌 Flexible Fridays Program 🏖 Flexible PTO 🩺 401k, Health, Dental, Vision Insurance 🎉 Fun as a Core Value: We believe life's too long to be so serious– enjoy the journey with us! Join our Team! Inspired or curious? Reach out and let's discuss further! [email protected] Scan To Explore Opportunities