$30 off During Our Annual Pro Sale. View Details »

Introduction to IDEs and Debugging

Introduction to IDEs and Debugging

Integrated Development Environments (IDEs) and Debugging – discover what the fuss is all about!

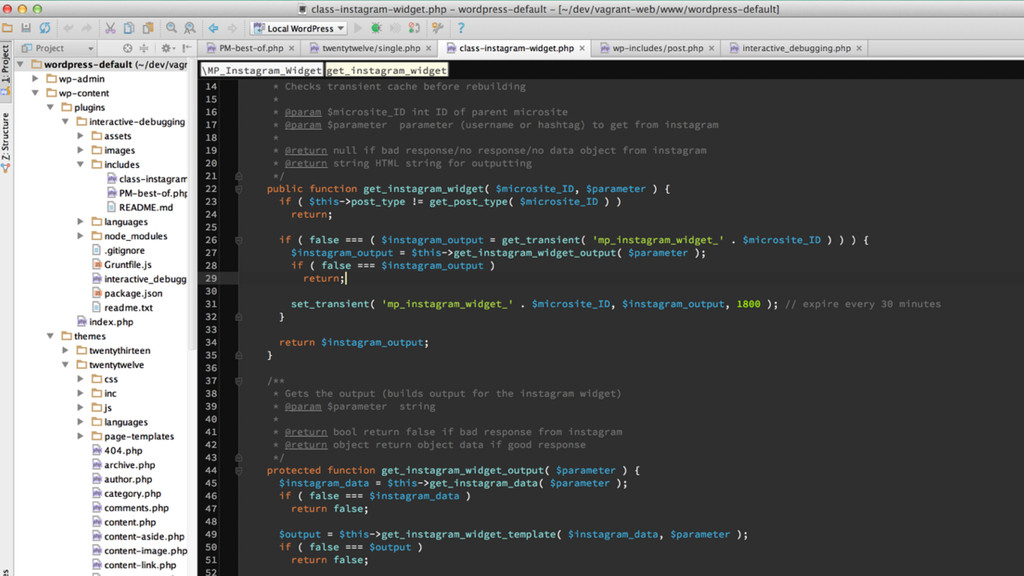
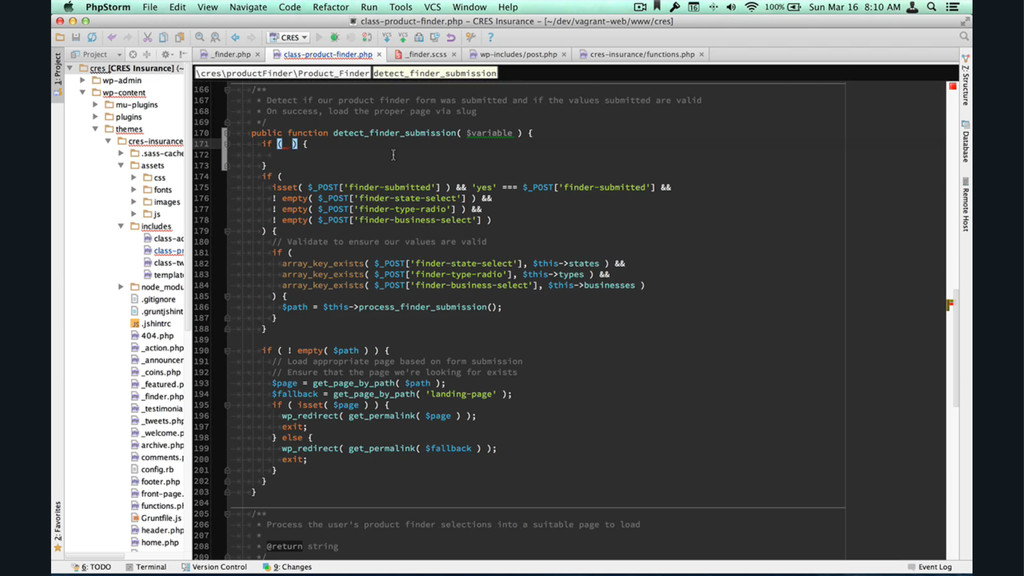
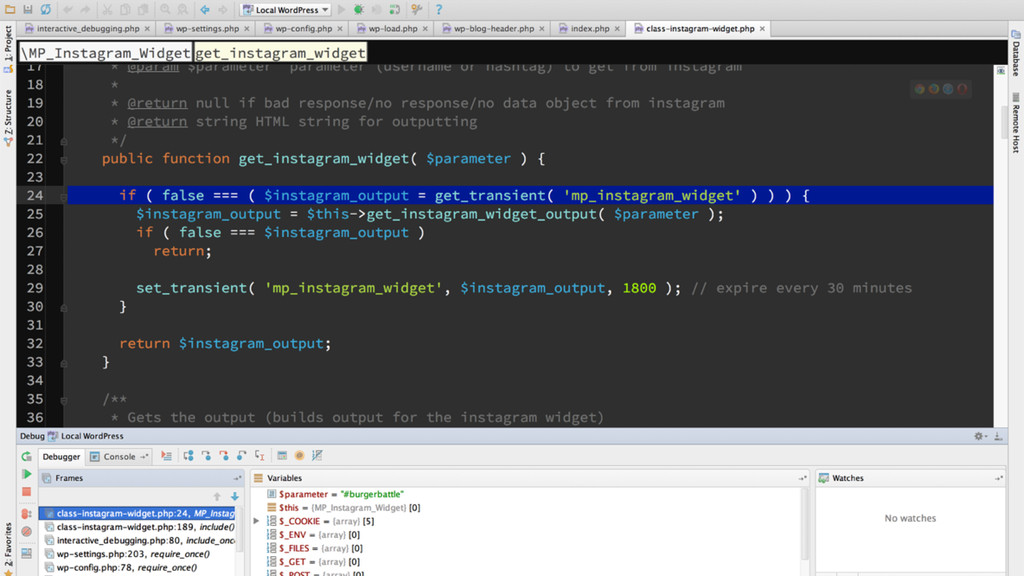
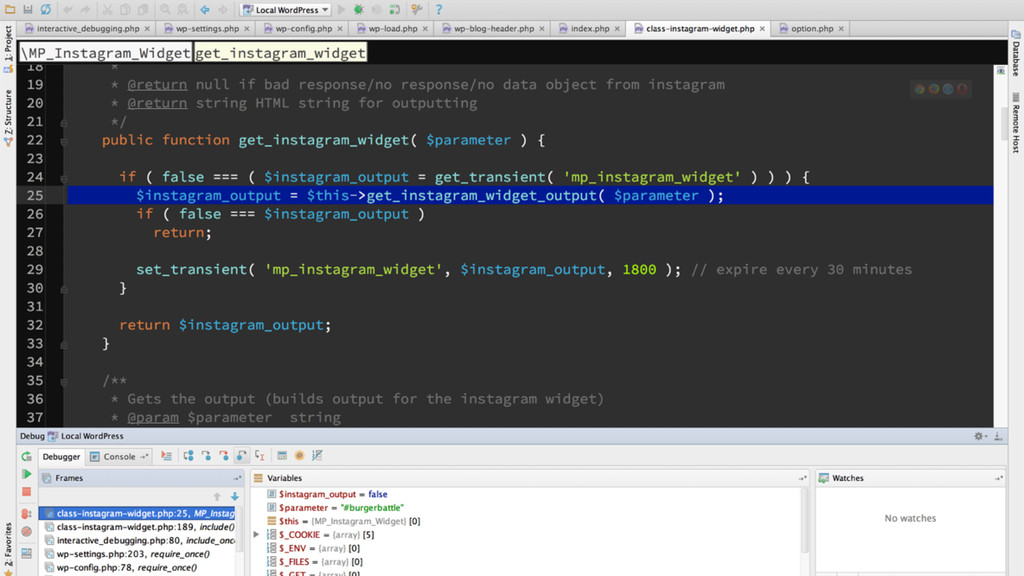
An IDE is a very powerful tool that helps you to understand your code. Imagine being able to jump to a function’s declaration, find all usages of said function, and even be able to step through the function line by line to truly understand what is happening in your program (and fix those pesky, hard to find bugs!).

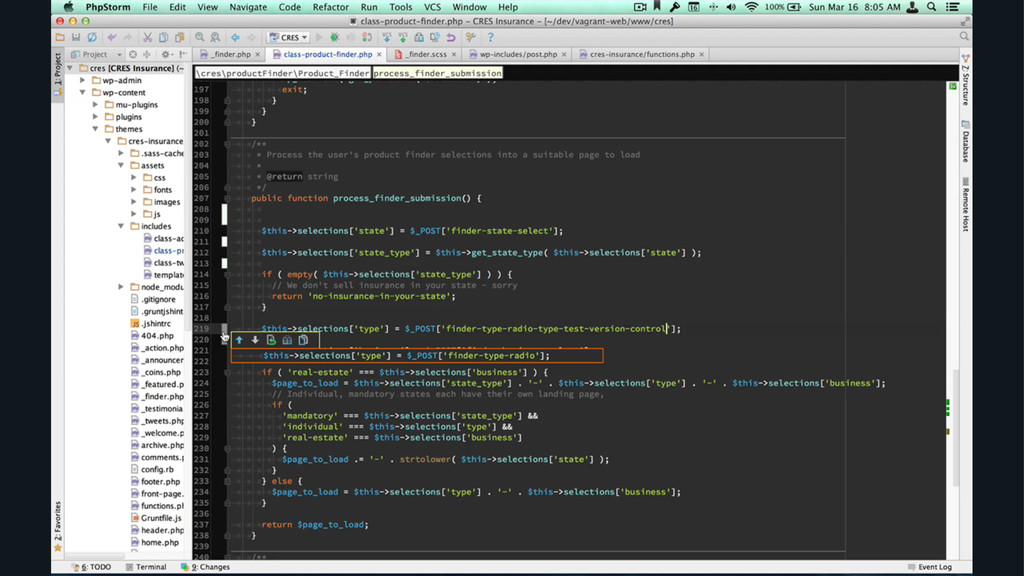
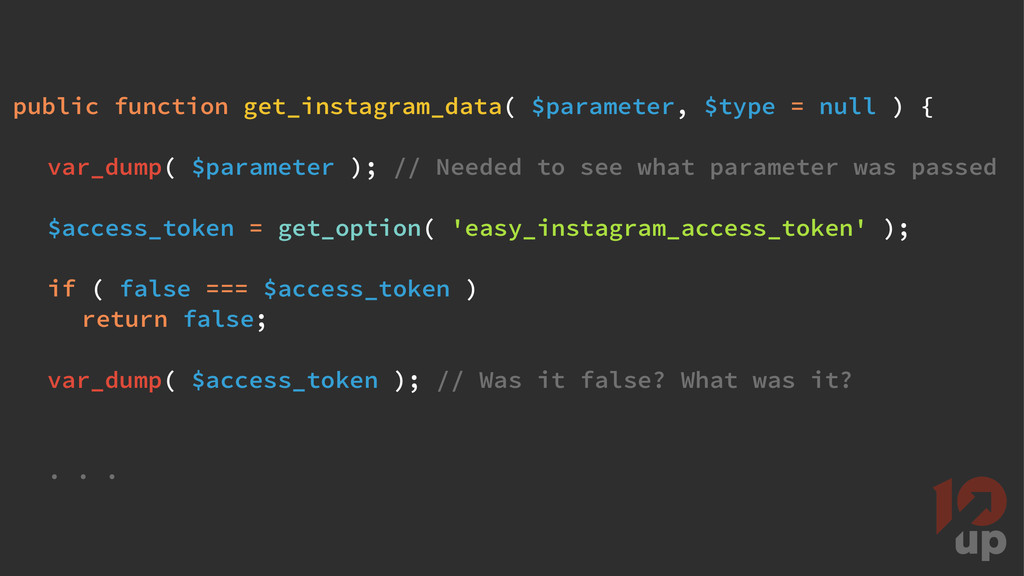
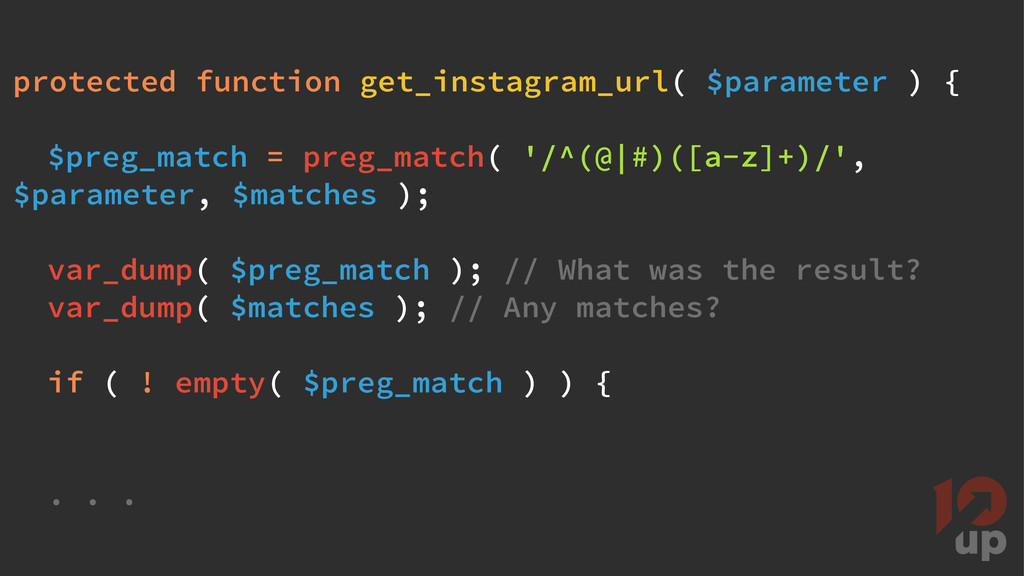
For a long time I thought using a simple text editor like Sublime or Textmate was all a web developer needed. You make a code change, save the file, refresh your browser and it either works or it doesn’t!. If you wanted to be fancy you could even output your variables in a ‘var_dump’!

However, using ‘var_dump’ interjected in your code is not always the best solution (and would sometimes be impossible in an XMLRPC or delayed script), and relying on your editor’s ‘Find’ to search through your entire project to find a function’s declaration is disjointed and can be extremely time consuming.

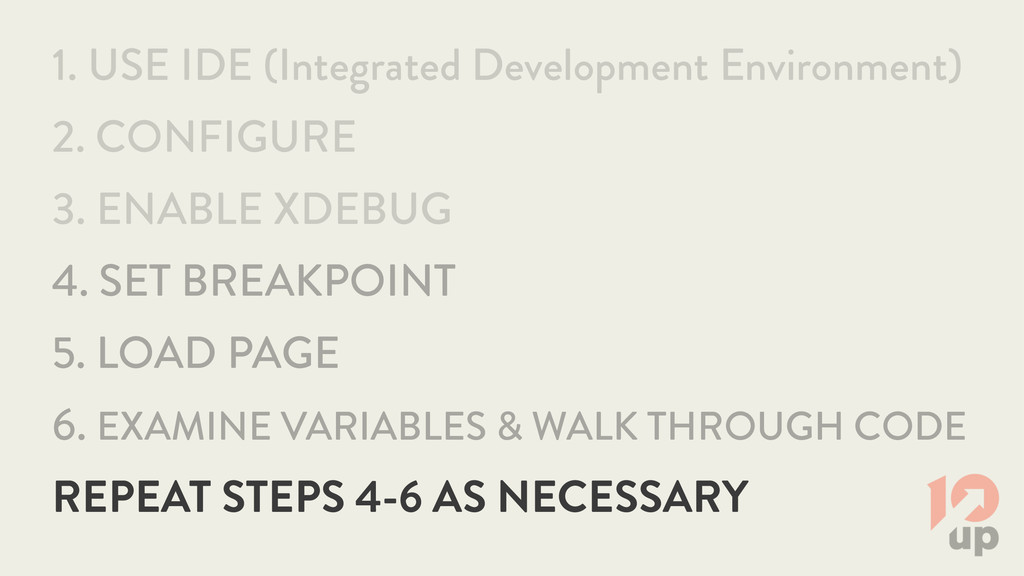
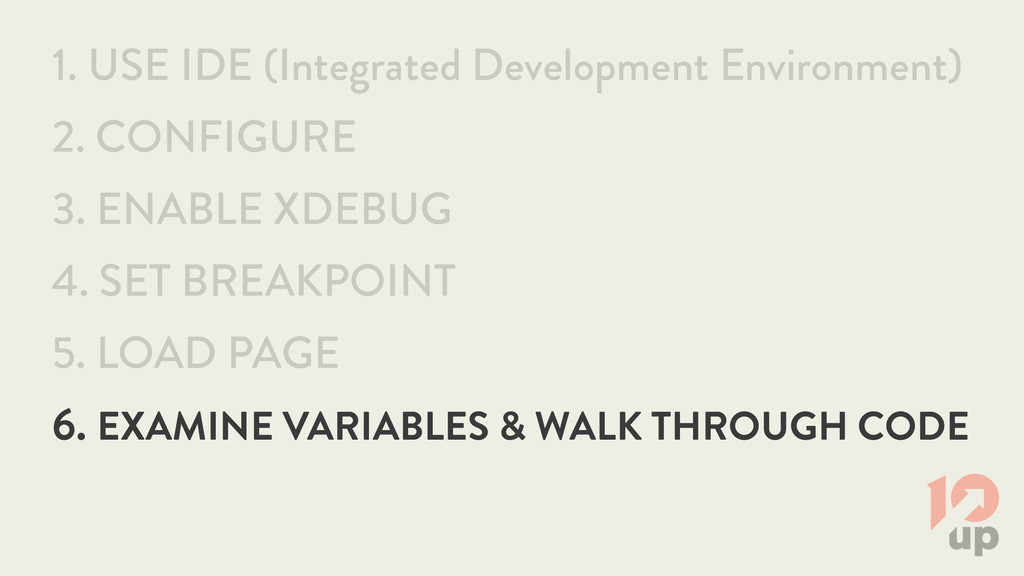
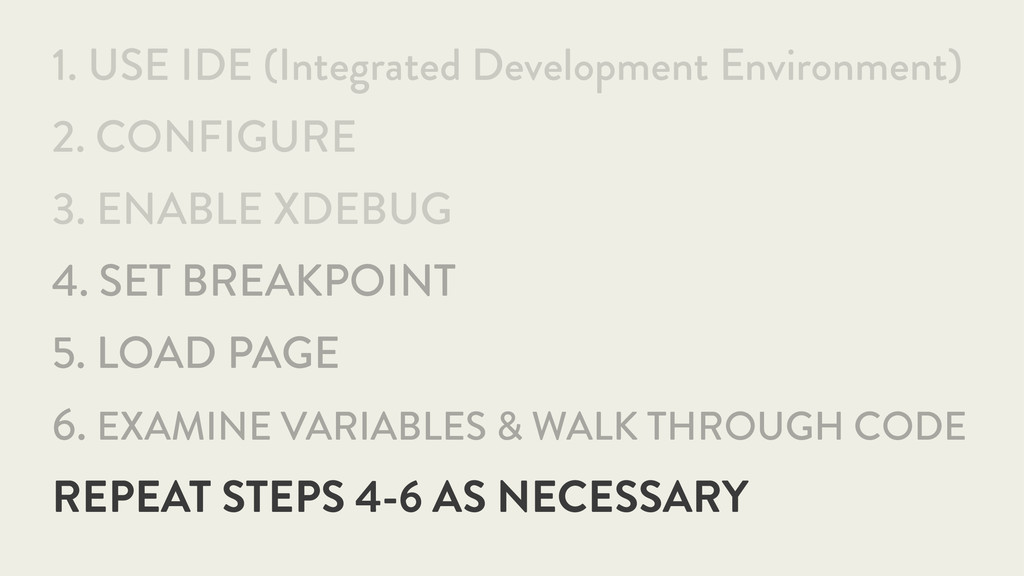
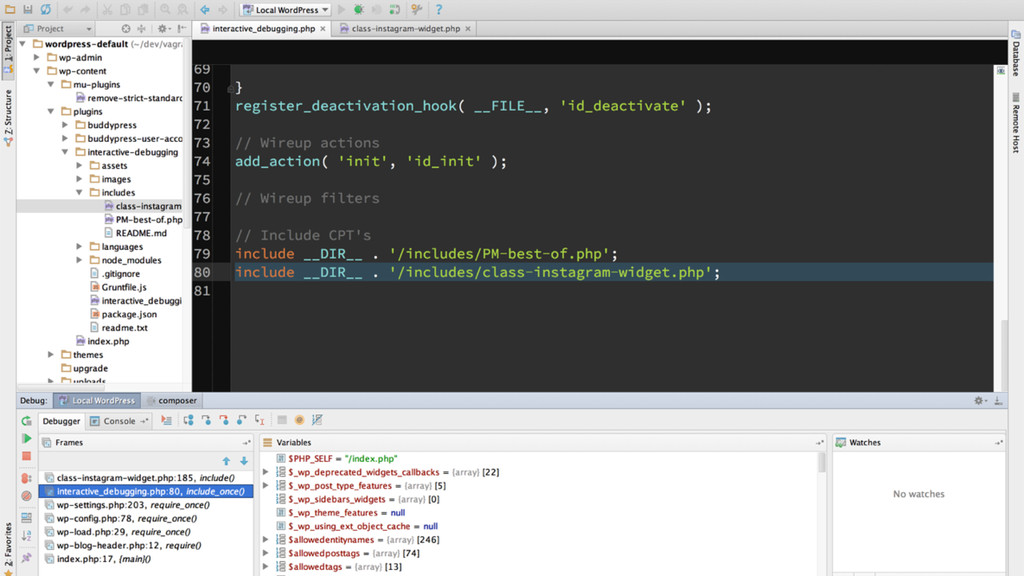
We’ll walk through using and understanding an IDE (the basics) as well as run through how to set up and step through our code, line by line.

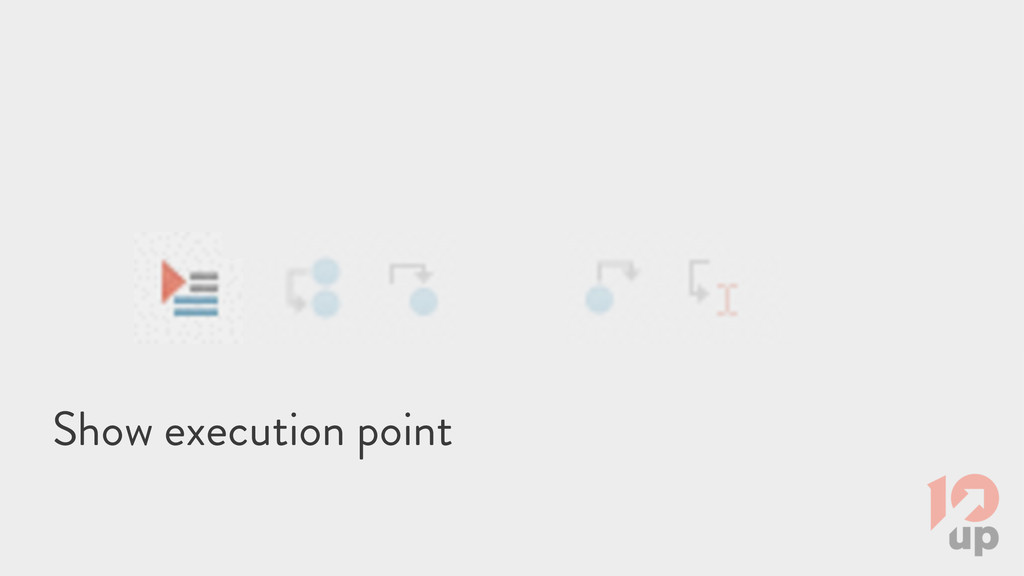
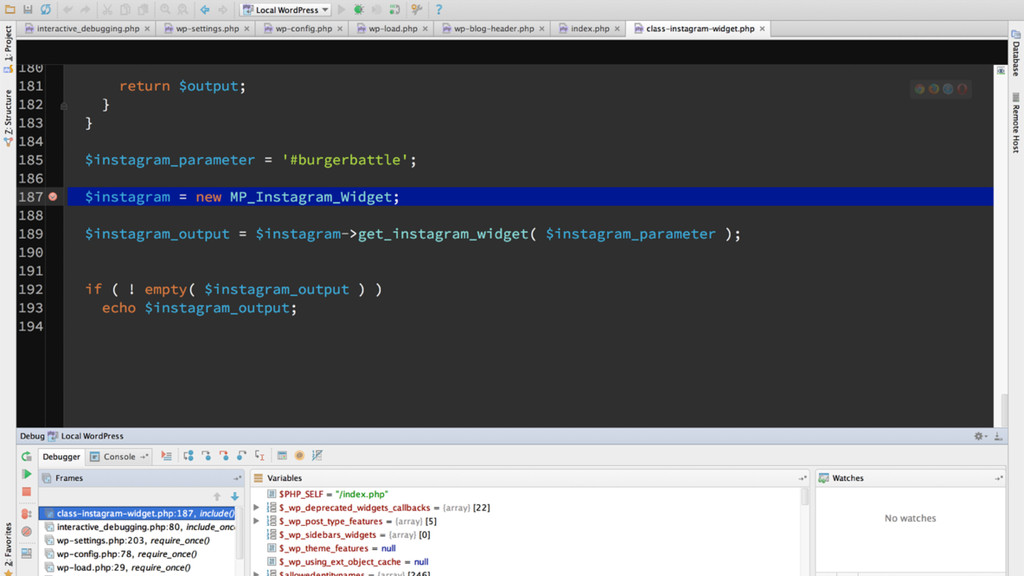
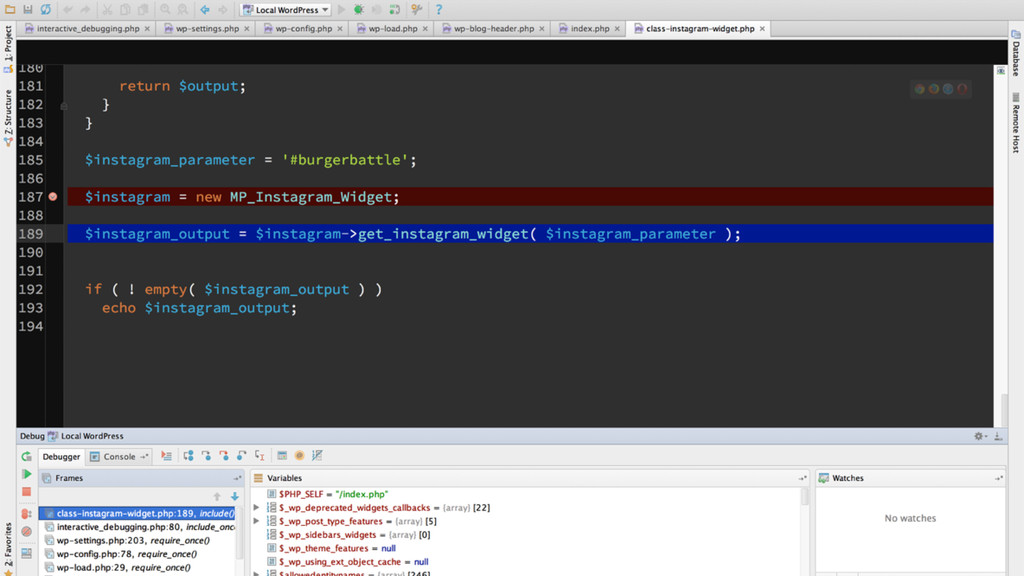
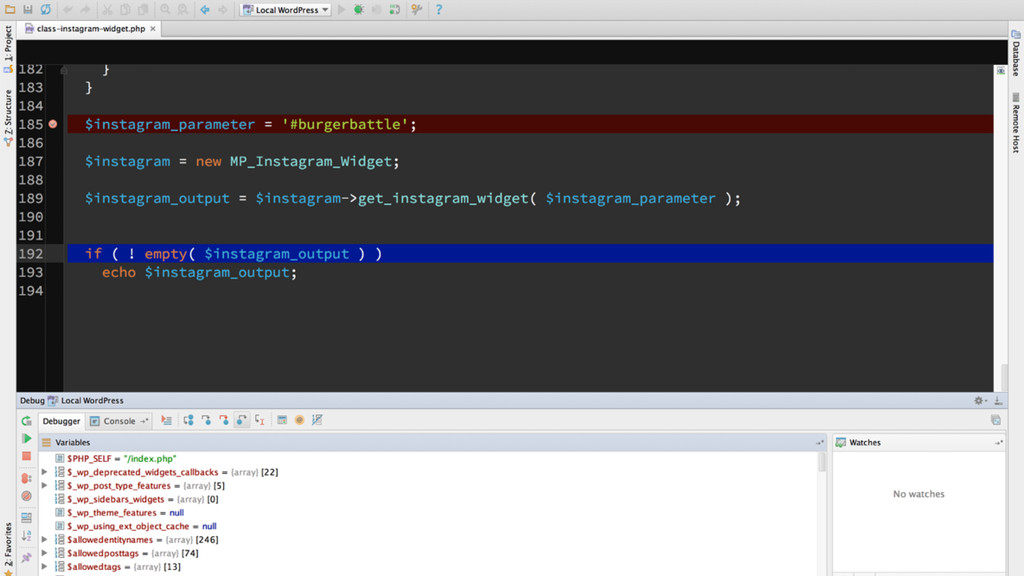
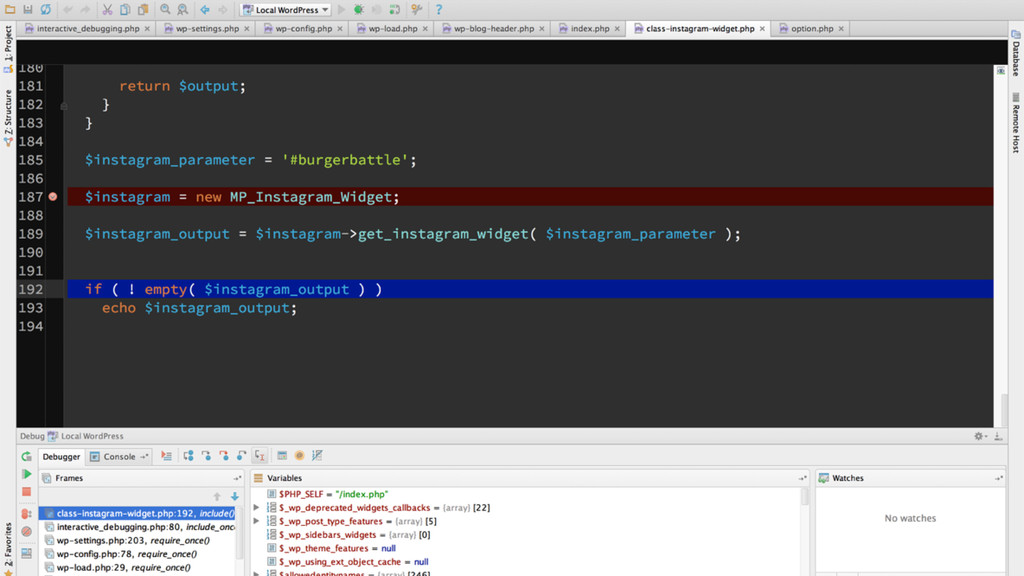
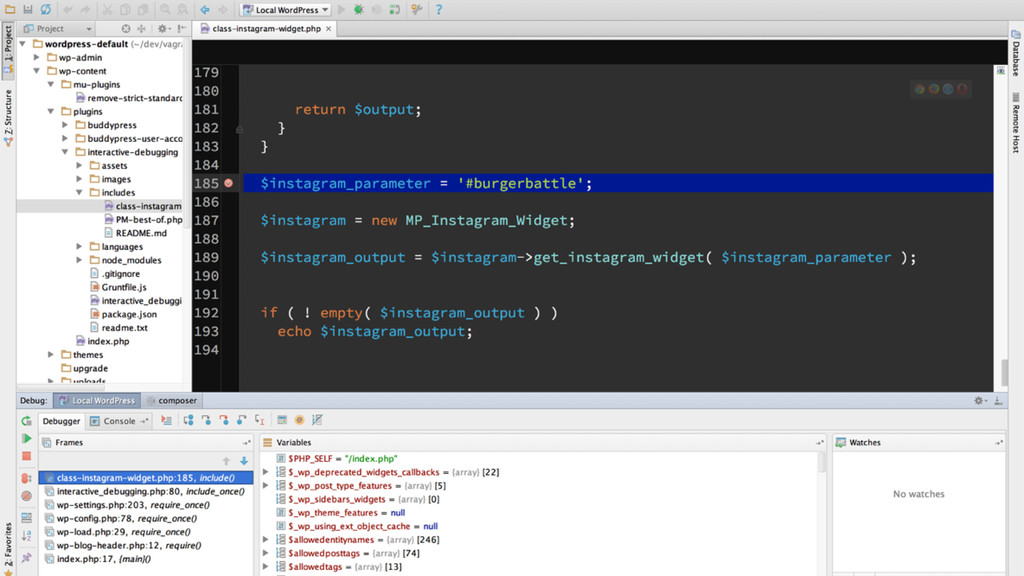
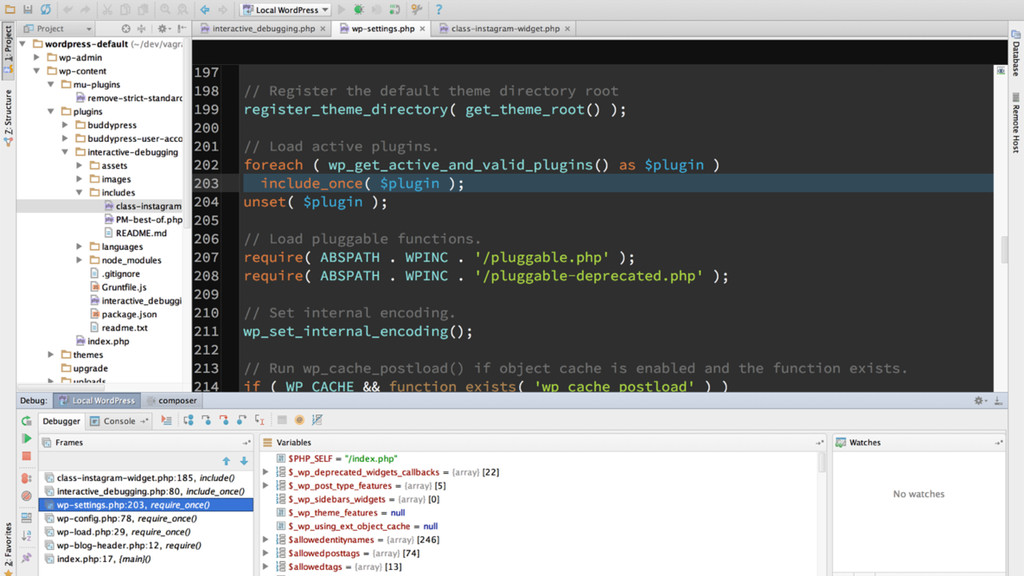
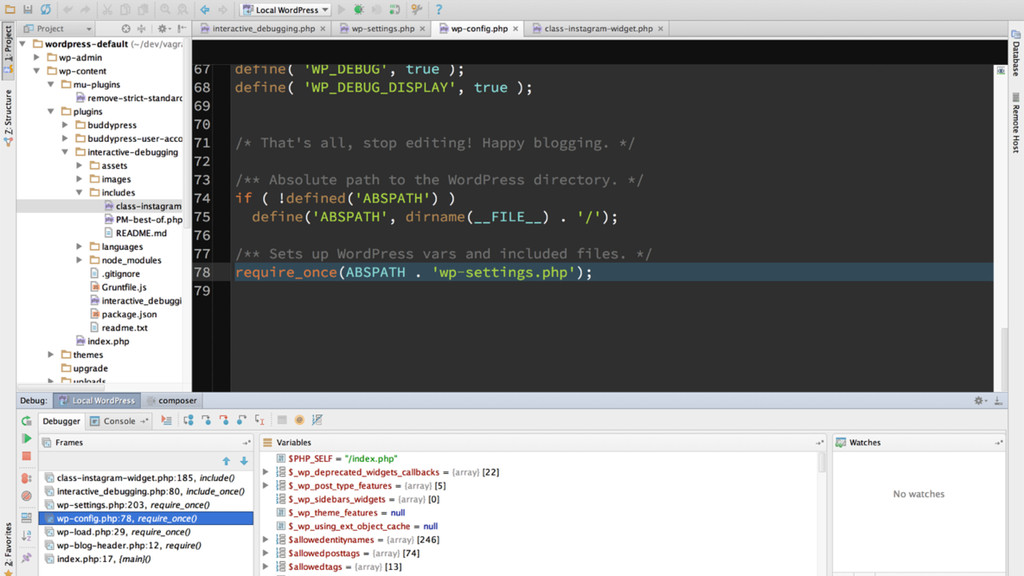
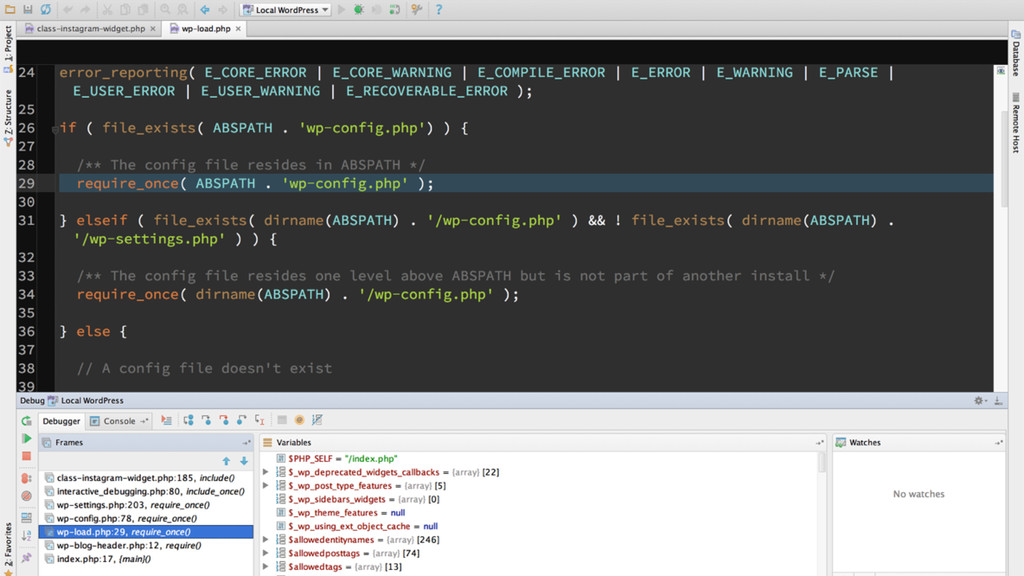
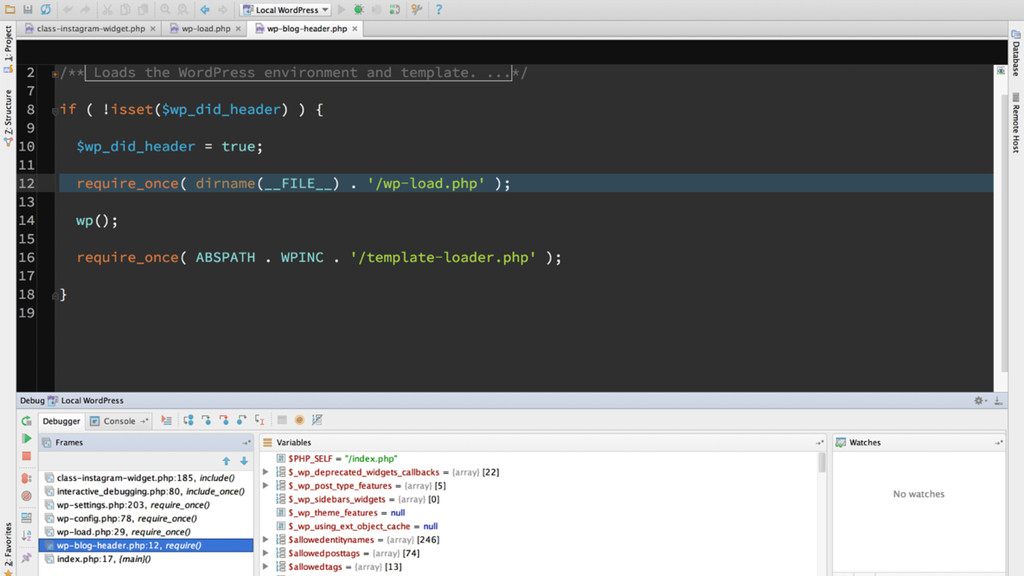
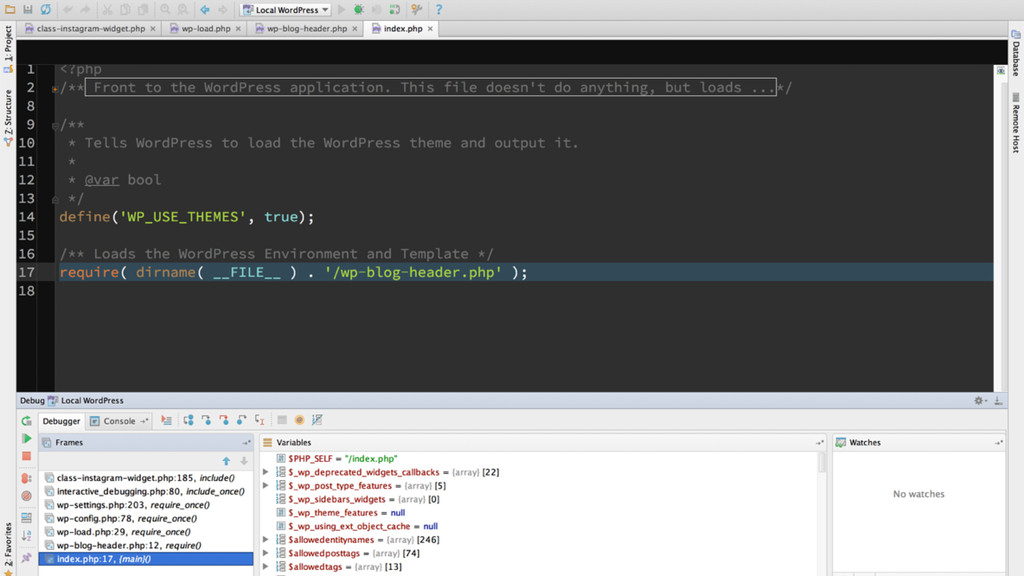
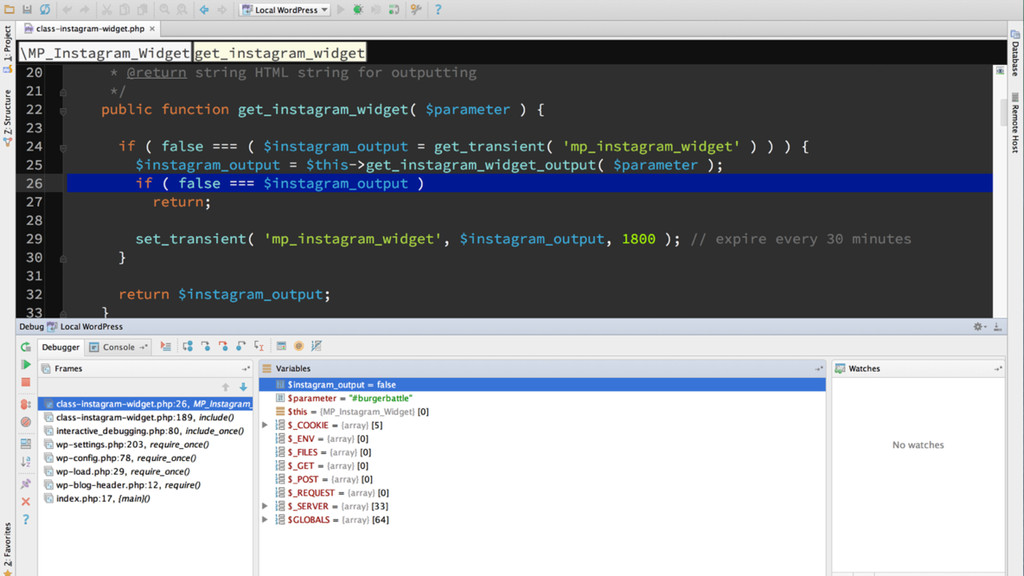
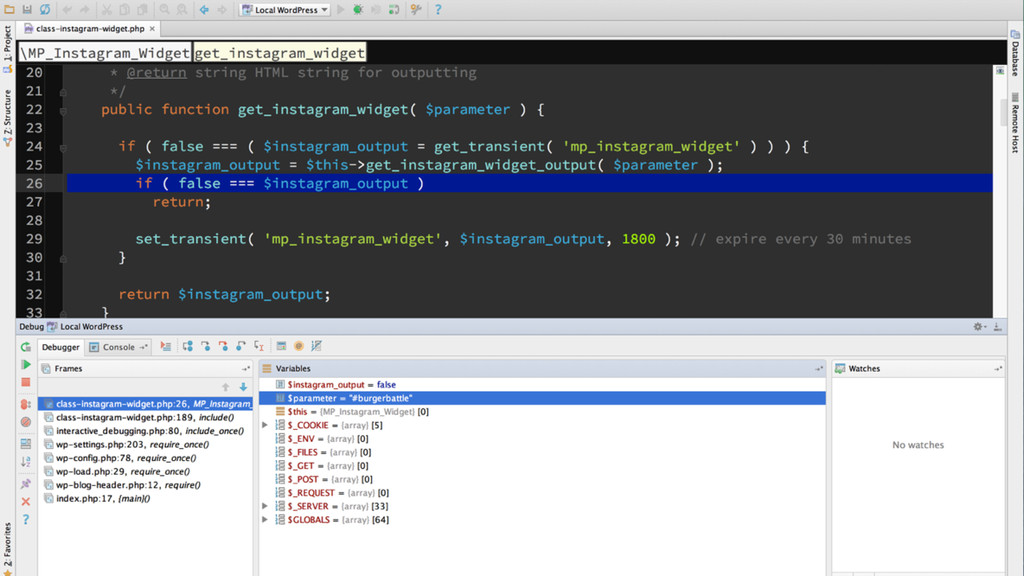
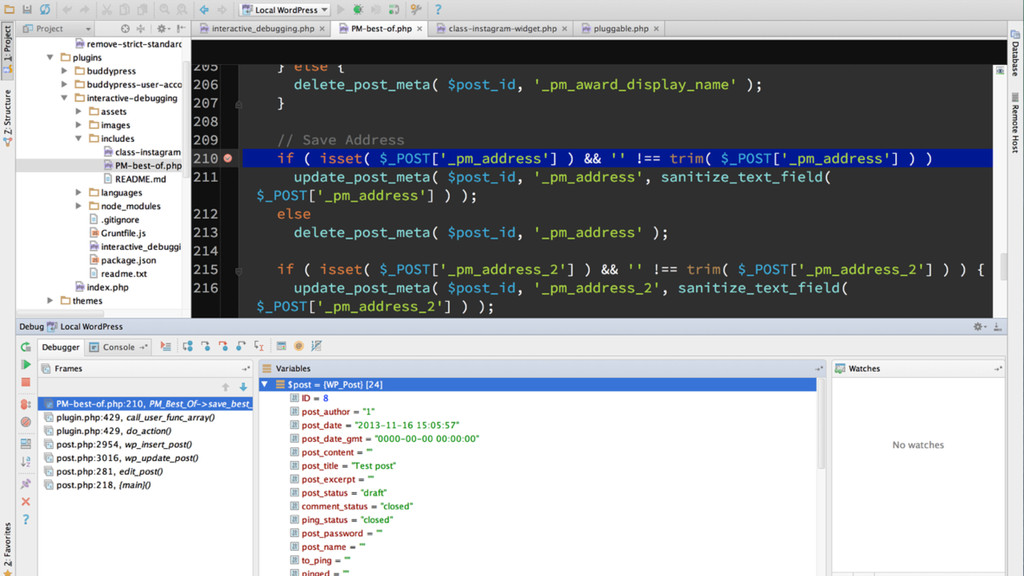
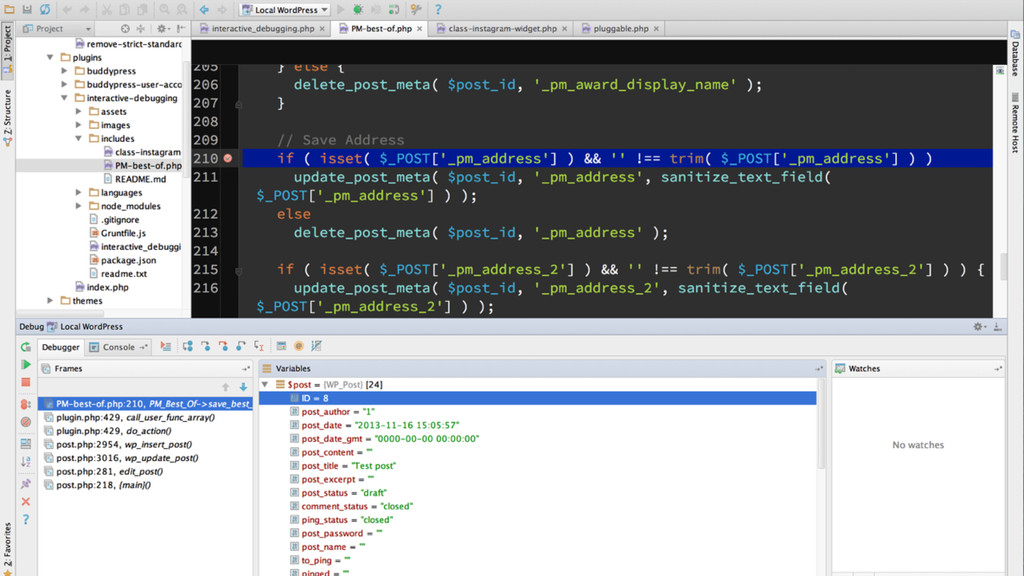
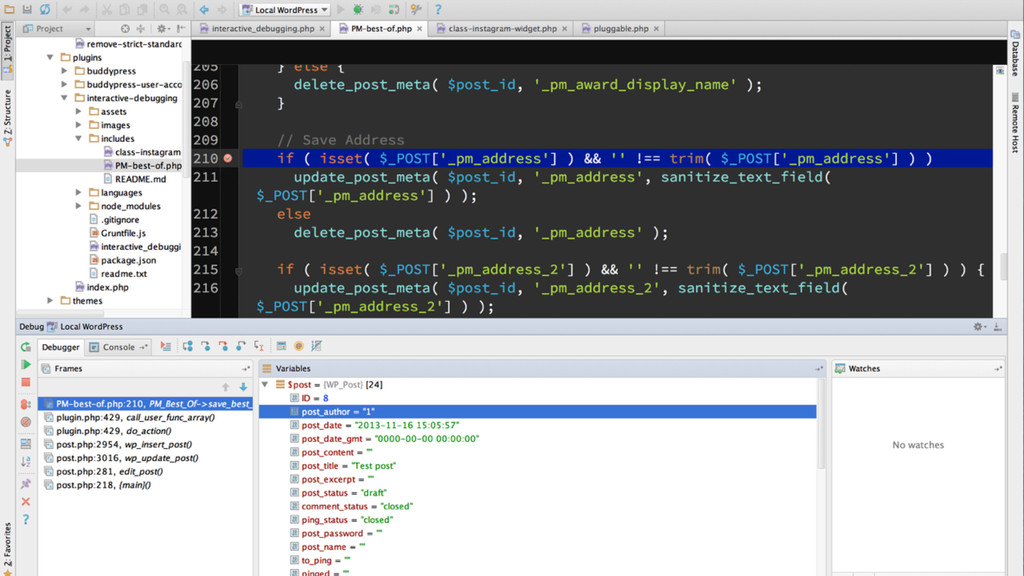
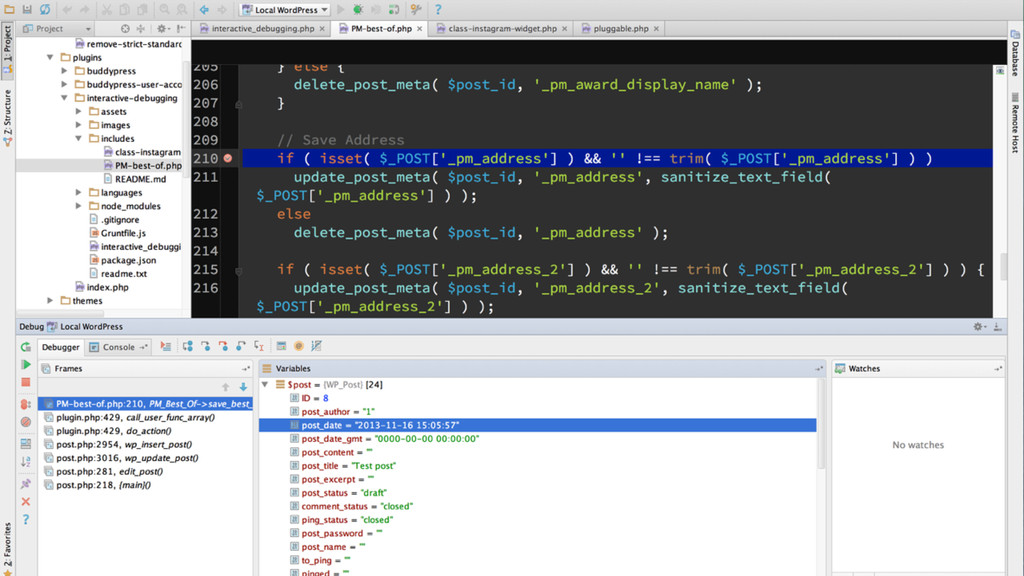
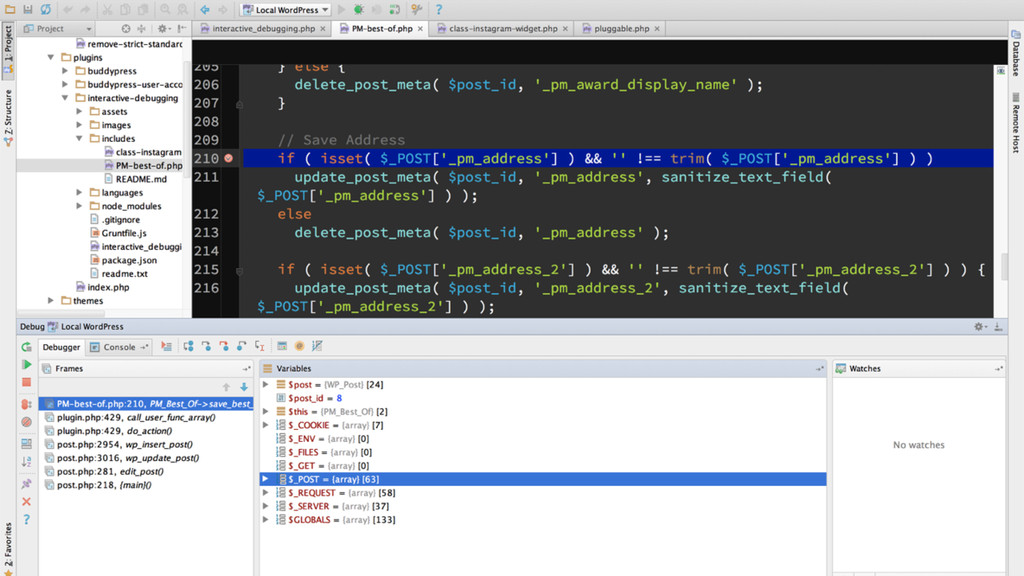
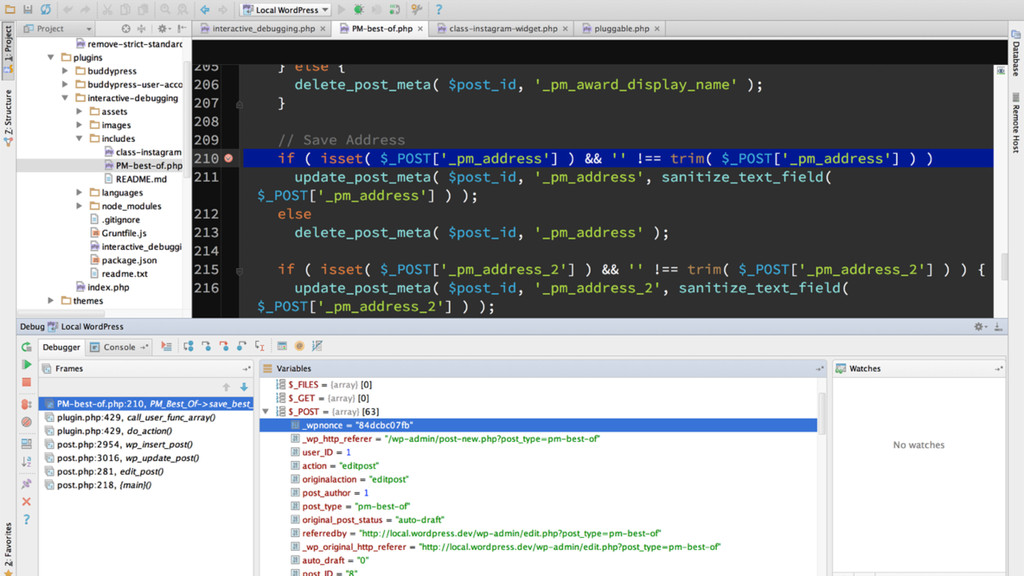
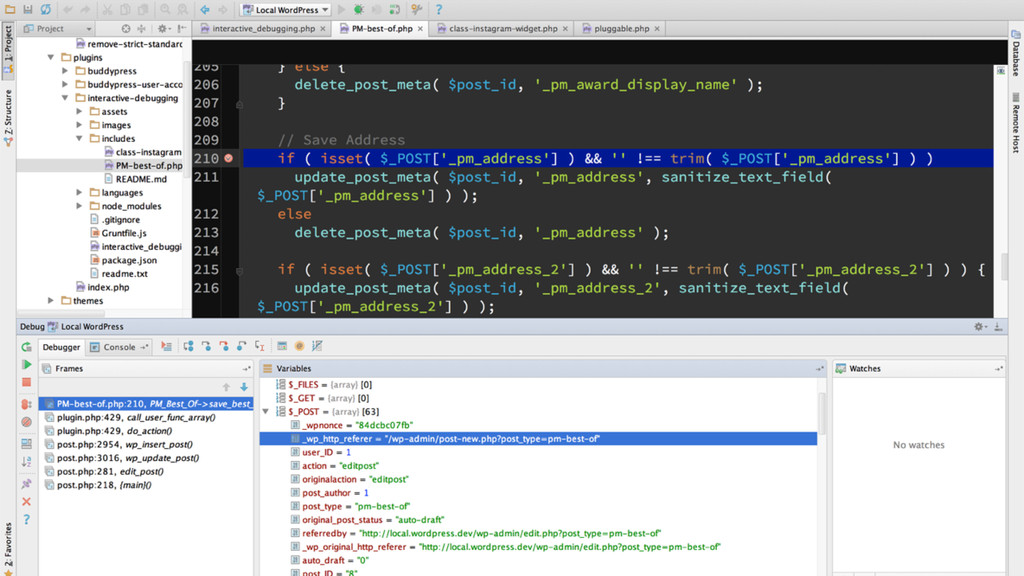
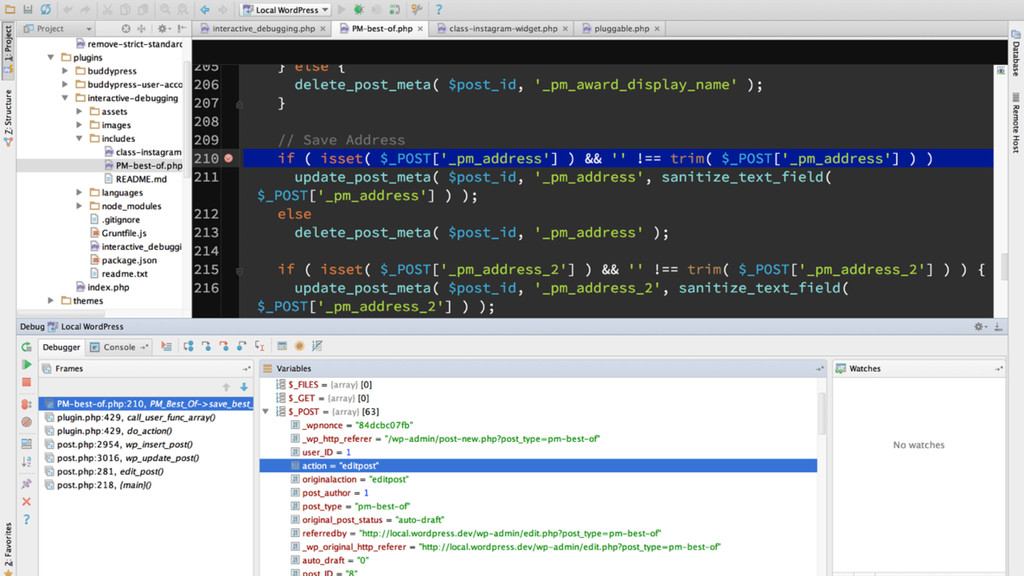
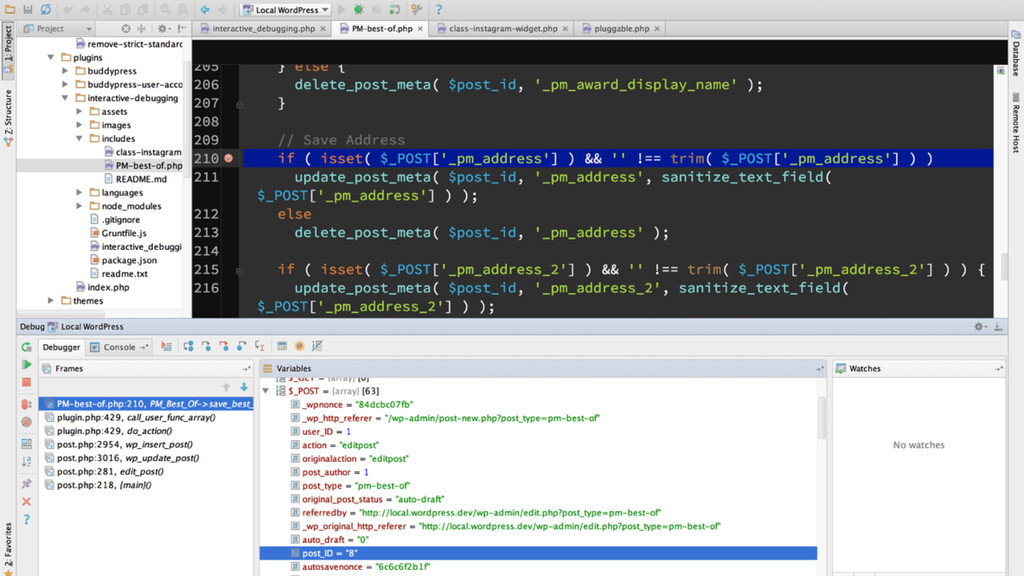
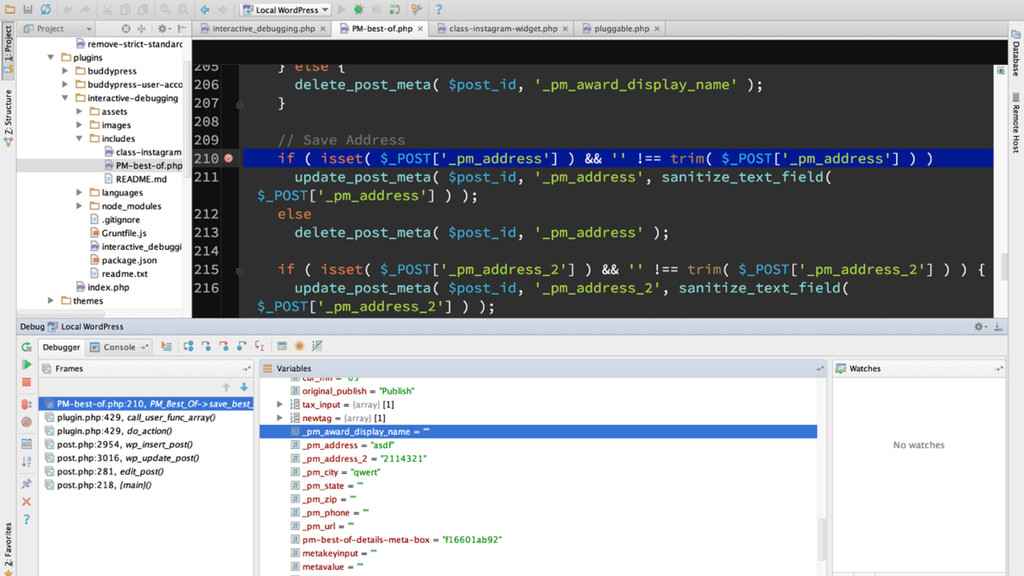
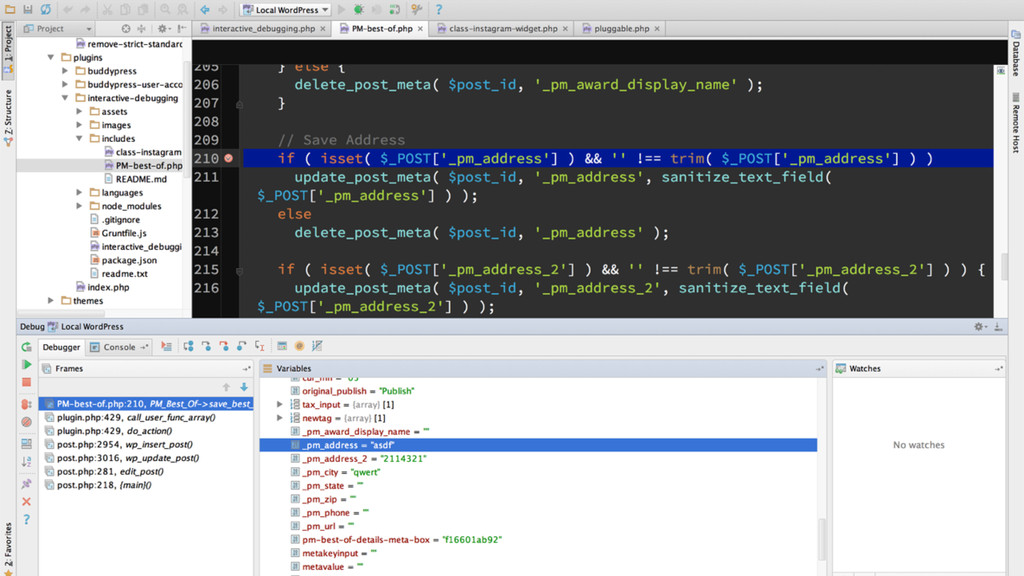
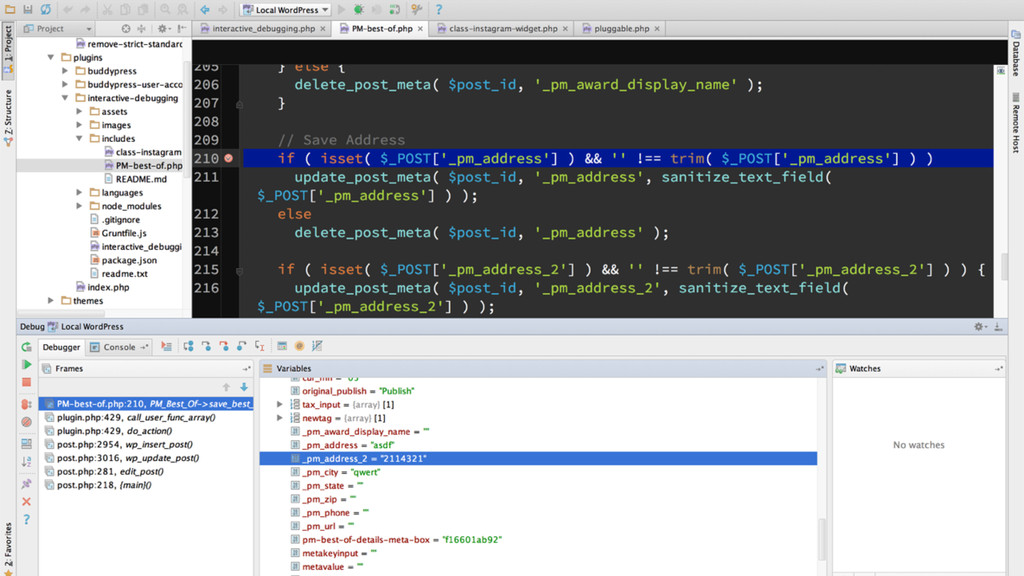
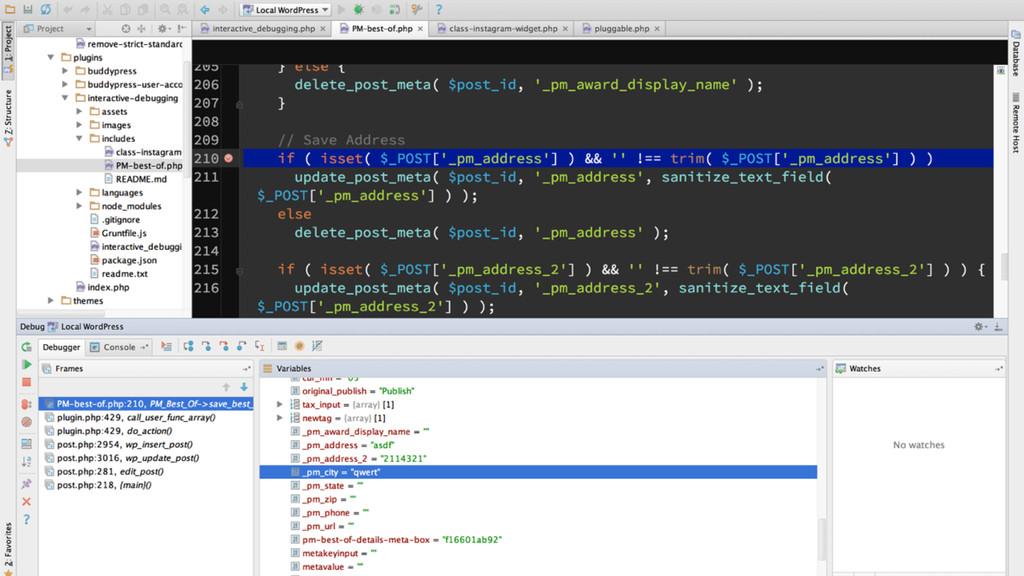
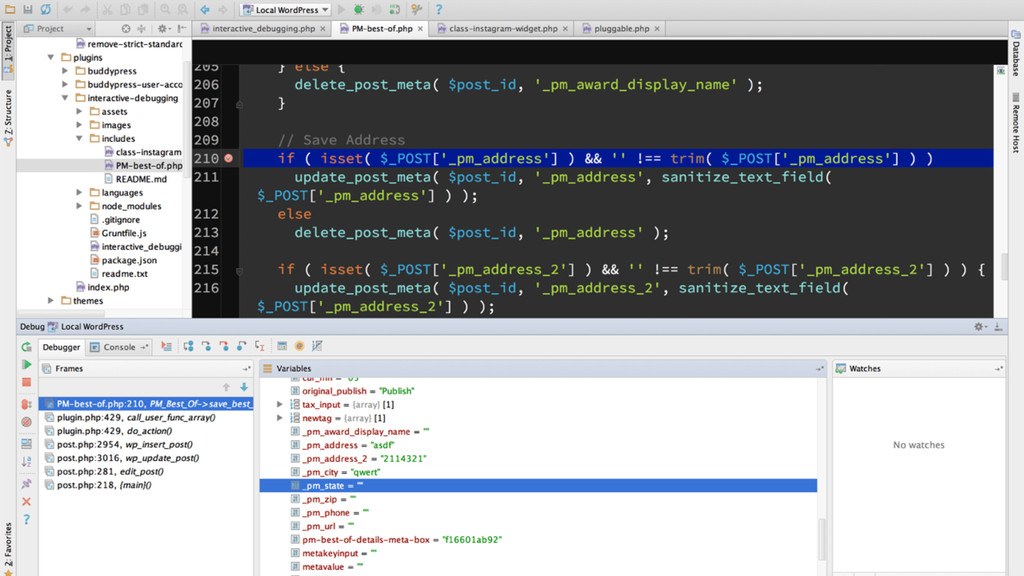
Just imagine, being able to stop at any point of execution in your code, walk line-by-line through it and at any point see what variables are alive and what values they hold. It’s analogous to taking the blindfold off and truly seeing (and understanding) your code.

Aaron Holbrook

June 15, 2014
Tweet

More Decks by Aaron Holbrook

Other Decks in Technology

Transcript

  1. Introduction to IDEs and Debugging
    aaronjholbrook.com
    aaronjholbrook

    View Slide

  2. get_info( ‘aaronholbrook’ );

    View Slide

  3. View Slide

  4. View Slide

  5. View Slide

  6. View Slide

  7. How I Learned to Stop Worrying and Love
    Interactive Debugging
    (Also IDEs are the shit)

    View Slide

  8. How I Learned to Stop Worrying and Love
    Interactive Debugging
    (Also IDEs are the shit)

    View Slide

  9. Integrated
    Development
    Environment

    View Slide

  10. A software application that provides comprehensive facilities
    to computer programmers for software development

    View Slide

  11. View Slide

  12. It is more than a text editor

    View Slide

  13. View Slide

  14. Use the right tool for the job

    View Slide

  15. View Slide

  16. Jump to a declaration (function, method, variable, etc)

    View Slide

  17. View Slide

  18. Visualize version control changes

    View Slide

  19. View Slide

  20. See unused variables and syntax errors

    View Slide

  21. View Slide

  22. How I Learned to Stop Worrying and Love
    Interactive Debugging
    (Also IDEs are the shit)

    View Slide

  23. How I Learned to Stop Worrying and Love
    Interactive Debugging
    (Also IDEs are the shit)

    View Slide

  24. what IS debugging?

    View Slide

  25. Debugging is a process of finding and reducing the number of
    bugs in a computer program, thus making it behave as
    expected

    View Slide

  26. WHY INTERACTIVE
    DEBUGGING?

    View Slide

  27. Ever do this?

    View Slide

  28. echo( $variable );

    View Slide

  29. print_r( $array );
    var_dump( $array );

    View Slide

  30. public function get_instagram_data( $parameter, $type = null ) {
    !
    var_dump( $parameter ); // Needed to see what parameter was passed
    !
    $access_token = get_option( 'easy_instagram_access_token' );
    !
    if ( false === $access_token )
    return false;
    !
    var_dump( $access_token ); // Was it false? What was it?
    !
    !
    . . .

    View Slide

  31. protected function get_instagram_url( $parameter ) {
    !
    $preg_match = preg_match( '/^(@|#)([a-z]+)/',
    $parameter, $matches );
    var_dump( $preg_match ); // What was the result?
    var_dump( $matches ); // Any matches?
    !
    if ( ! empty( $preg_match ) ) {
    !
    !
    . . .

    View Slide

  32. var_dump( );

    View Slide

  33. Well - there IS a better way.

    View Slide

  34. Follow program execution

    View Slide

  35. Examine variables at a specific
    point of execution

    View Slide

  36. Achieve a quicker and greater
    understanding of new code

    View Slide

  37. View Slide

  38. HOW TO:
    INTERACTIVELY
    DEBUG

    View Slide

  39. 1. USE IDE (Integrated Development Environment)

    View Slide

  40. 1. USE IDE (Integrated Development Environment)
    2. CONFIGURE

    View Slide

  41. 1. USE IDE (Integrated Development Environment)
    2. CONFIGURE
    3. ENABLE XDEBUG

    View Slide

  42. 1. USE IDE (Integrated Development Environment)
    2. CONFIGURE
    3. ENABLE XDEBUG
    4. SET BREAKPOINT

    View Slide

  43. 1. USE IDE (Integrated Development Environment)
    2. CONFIGURE
    3. ENABLE XDEBUG
    4. SET BREAKPOINT
    5. LOAD PAGE

    View Slide

  44. 1. USE IDE (Integrated Development Environment)
    2. CONFIGURE
    3. ENABLE XDEBUG
    4. SET BREAKPOINT
    5. LOAD PAGE
    6. EXAMINE VARIABLES & WALK THROUGH CODE

    View Slide

  45. 1. USE IDE (Integrated Development Environment)
    2. CONFIGURE
    3. ENABLE XDEBUG
    4. SET BREAKPOINT
    5. LOAD PAGE
    6. EXAMINE VARIABLES & WALK THROUGH CODE
    REPEAT STEPS 4-6 AS NECESSARY

    View Slide

  46. 1. USE IDE (Integrated Development Environment)

    View Slide

  47. 1. USE IDE (Integrated Development Environment)
    2. CONFIGURE

    View Slide

  48. View Slide

  49. 1. USE IDE (Integrated Development Environment)
    2. CONFIGURE

    View Slide

  50. 1. USE IDE (Integrated Development Environment)
    2. CONFIGURE
    3. ENABLE XDEBUG

    View Slide

  51. View Slide

  52. View Slide

  53. 1. USE IDE (Integrated Development Environment)
    2. CONFIGURE
    3. ENABLE XDEBUG

    View Slide

  54. 1. USE IDE (Integrated Development Environment)
    2. CONFIGURE
    3. ENABLE XDEBUG
    4. SET BREAKPOINT

    View Slide

  55. 1. USE IDE (Integrated Development Environment)
    2. CONFIGURE
    3. ENABLE XDEBUG
    4. SET BREAKPOINT
    5. LOAD PAGE

    View Slide

  56. 1. USE IDE (Integrated Development Environment)
    2. CONFIGURE
    3. ENABLE XDEBUG
    4. SET BREAKPOINT
    5. LOAD PAGE
    6. EXAMINE VARIABLES & WALK THROUGH CODE

    View Slide

  57. 1. USE IDE (Integrated Development Environment)
    2. CONFIGURE
    3. ENABLE XDEBUG
    4. SET BREAKPOINT
    5. LOAD PAGE
    6. EXAMINE VARIABLES & WALK THROUGH CODE
    REPEAT STEPS 4-6 AS NECESSARY

    View Slide

  58. THE DEBUGGER

    View Slide

  59. Program Execution

    View Slide

  60. View Slide

  61. Show execution point

    View Slide

  62. View Slide

  63. Show execution point

    View Slide

  64. Step over

    View Slide

  65. View Slide

  66. View Slide

  67. Step over

    View Slide

  68. Step into

    View Slide

  69. View Slide

  70. View Slide

  71. Step into

    View Slide

  72. Step out

    View Slide

  73. View Slide

  74. .2

    View Slide

  75. Step out

    View Slide

  76. Run to cursor

    View Slide

  77. View Slide

  78. View Slide

  79. Run to cursor

    View Slide

  80. Program Flow

    View Slide

  81. View Slide

  82. Rerun

    View Slide

  83. Resume

    View Slide

  84. Stop

    View Slide

  85. Call Stack

    View Slide

  86. In computer science, a call stack is a stack data structure that
    stores information about the active subroutines of a
    computer program

    View Slide

  87. View Slide

  88. View Slide

  89. View Slide

  90. View Slide

  91. View Slide

  92. View Slide

  93. View Slide

  94. Variables

    View Slide

  95. View Slide

  96. View Slide

  97. View Slide

  98. View Slide

  99. View Slide

  100. View Slide

  101. View Slide

  102. View Slide

  103. View Slide

  104. View Slide

  105. View Slide

  106. View Slide

  107. View Slide

  108. View Slide

  109. View Slide

  110. View Slide

  111. Contrived Example
    problem happens on page load

    View Slide

  112. View Slide

  113. Real life debugging
    not seeing correct ad zone in author archive

    View Slide

  114. Questions?

    View Slide

  115. Aaron Holbrook
    THANKS!
    aaronjholbrook
    aaronjholbrook.com
    aaronjholbrook.com/interactive-debugging

    View Slide