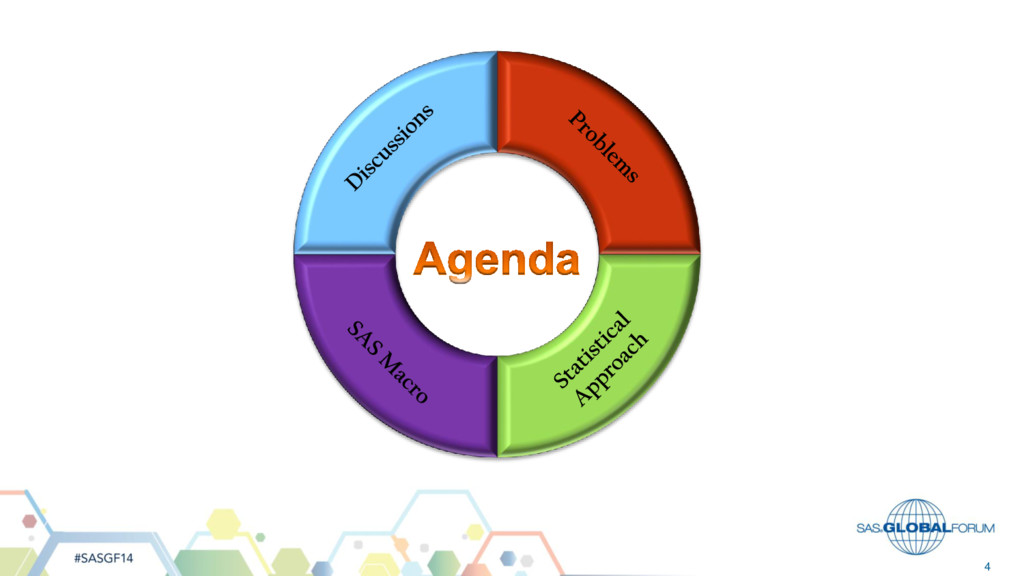
to manage more information with limited time and resources Sampling becomes one of the solutions to satisfy people’s needs to more information Different sampling methods would be applied under different study scenarios
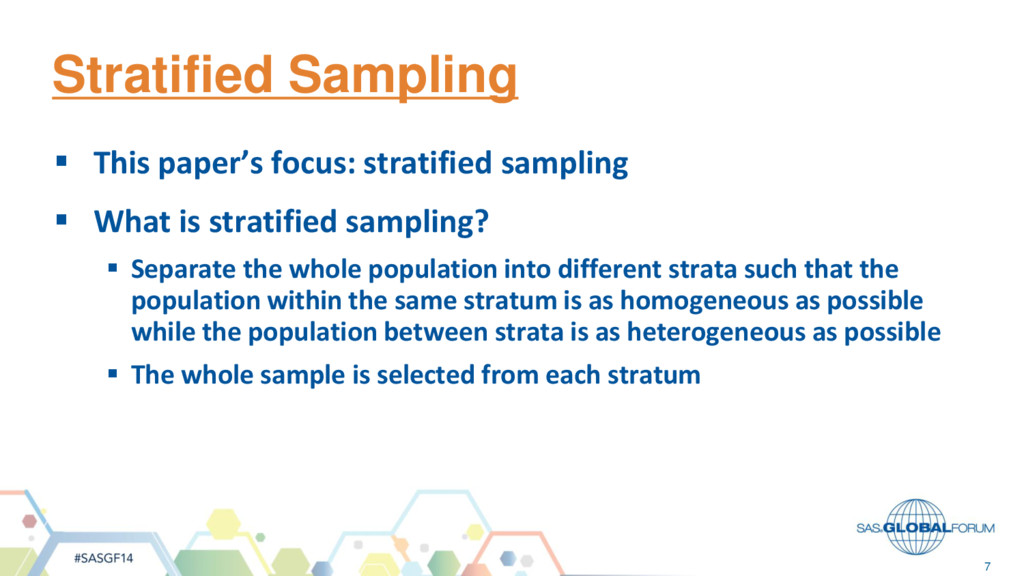
What is stratified sampling? Separate the whole population into different strata such that the population within the same stratum is as homogeneous as possible while the population between strata is as heterogeneous as possible The whole sample is selected from each stratum
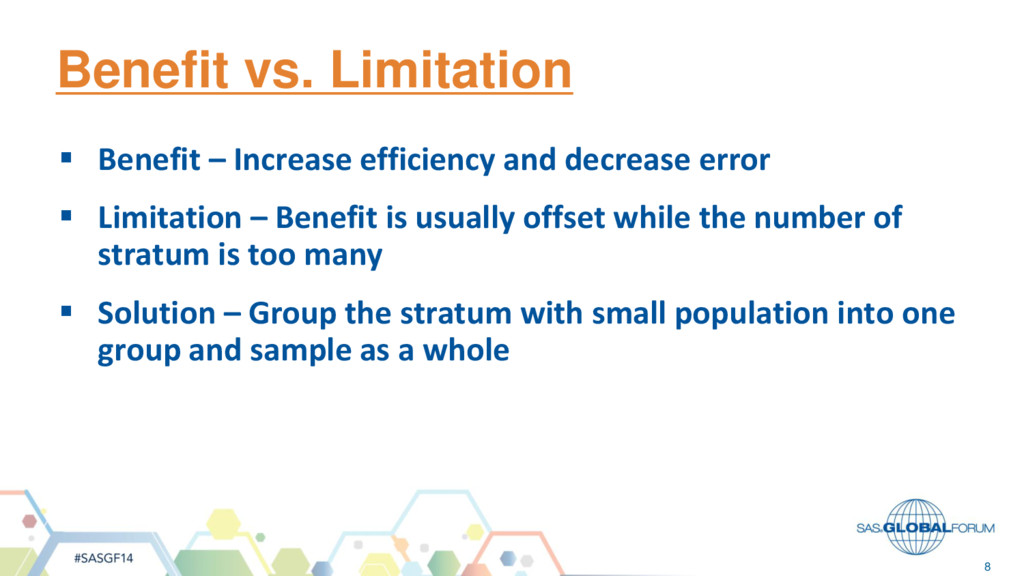
decrease error Limitation – Benefit is usually offset while the number of stratum is too many Solution – Group the stratum with small population into one group and sample as a whole
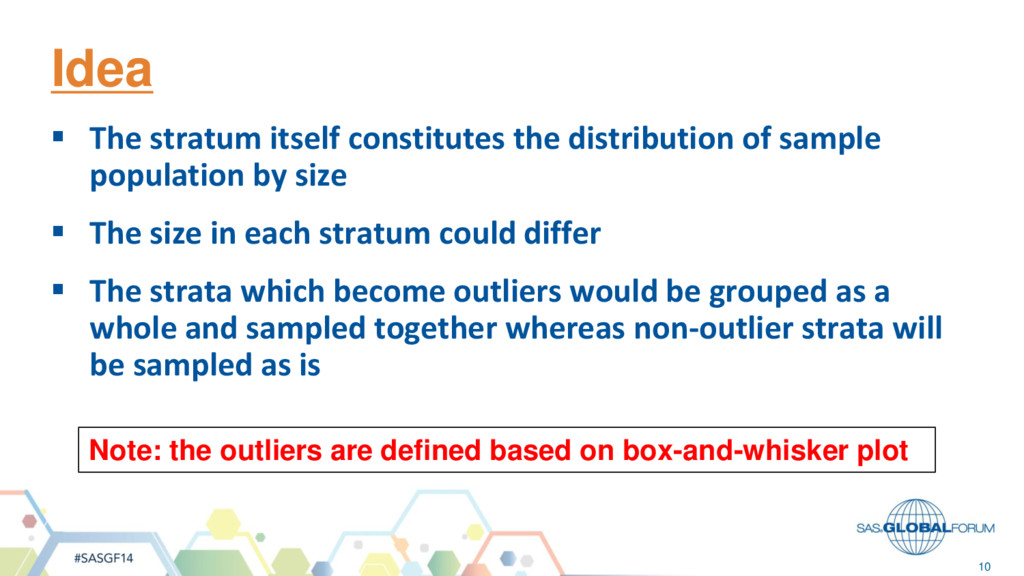
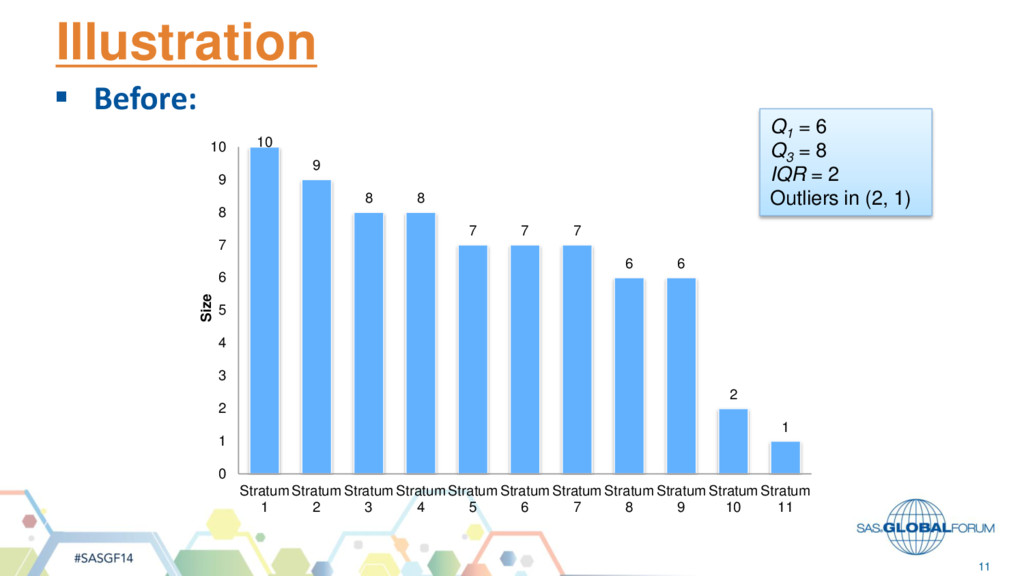
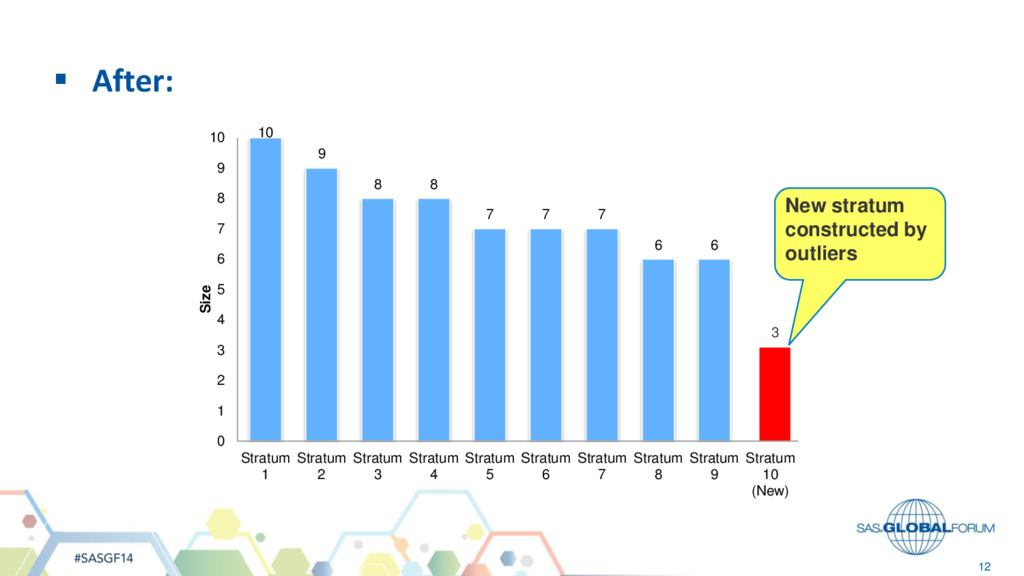
sample population by size The size in each stratum could differ The strata which become outliers would be grouped as a whole and sampled together whereas non-outlier strata will be sampled as is Note: the outliers are defined based on box-and-whisker plot
the total sample size would be allocated among strata with optimal allocation method Two more key pieces of information need to be defined: Variance Cost
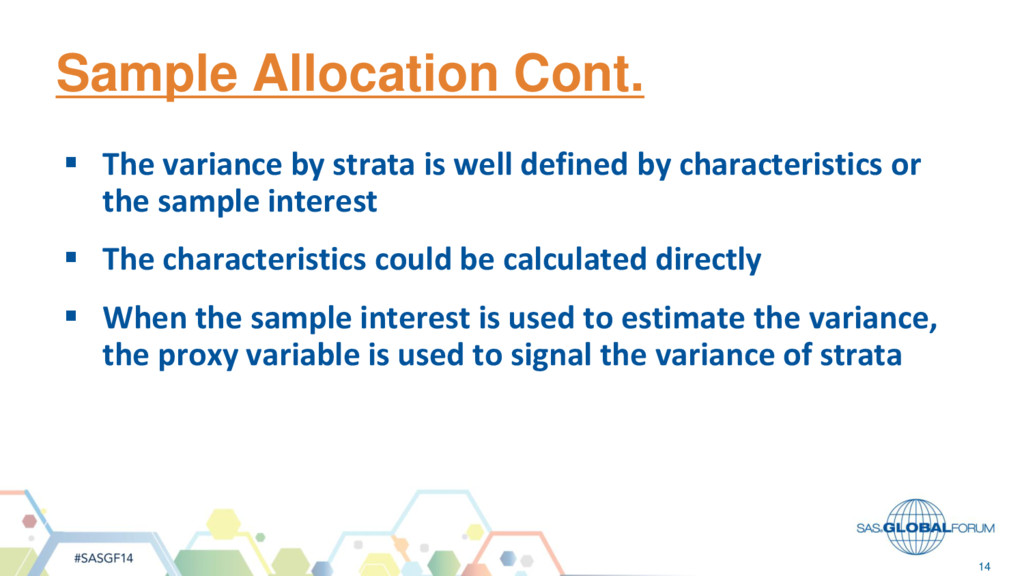
well defined by characteristics or the sample interest The characteristics could be calculated directly When the sample interest is used to estimate the variance, the proxy variable is used to signal the variance of strata
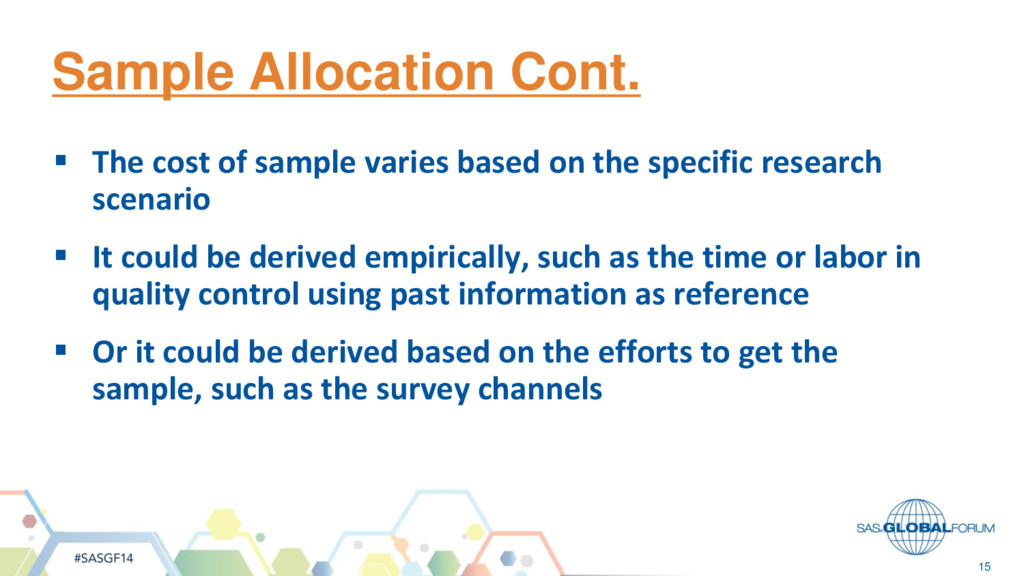
based on the specific research scenario It could be derived empirically, such as the time or labor in quality control using past information as reference Or it could be derived based on the efforts to get the sample, such as the survey channels
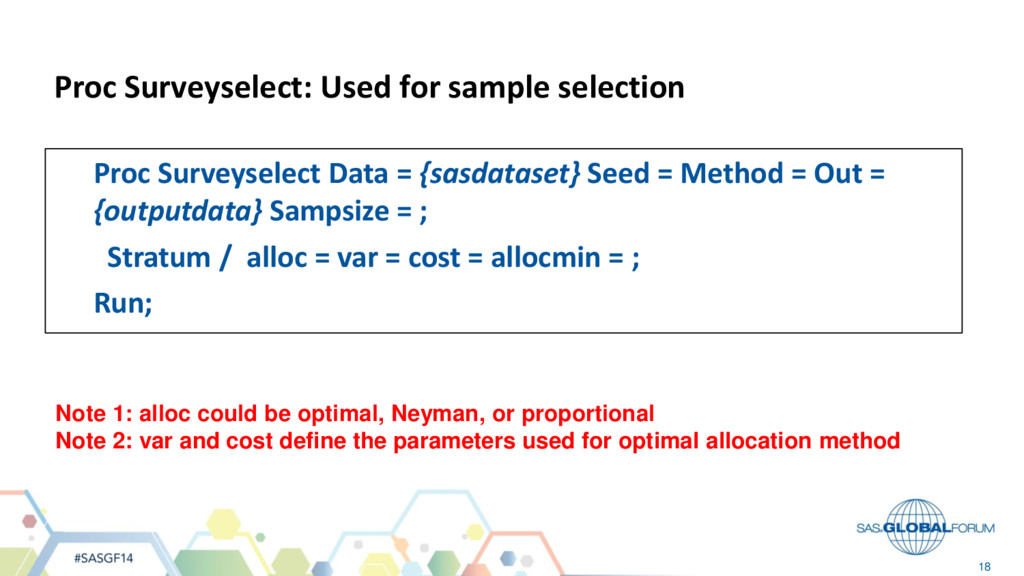
could be optimal, Neyman, or proportional Note 2: var and cost define the parameters used for optimal allocation method Proc Surveyselect Data = {sasdataset} Seed = Method = Out = {outputdata} Sampsize = ; Stratum / alloc = var = cost = allocmin = ; Run;
solve the problem when stratified sampling is applied with too many strata It could be applied in different areas, for example: Estimate the income by majors for recently graduated students Measure the popularity of TV shows by channels
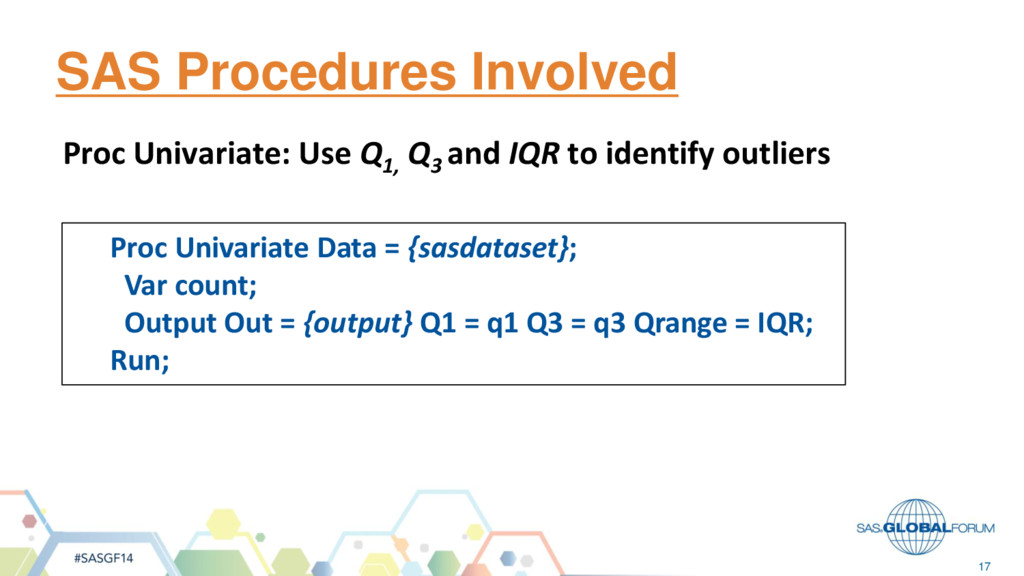
method is to improve the efficiency of sample but the increase in number of strata would undermine the accuracy by using it The proposed method is to use box-and-whisker outliers to re- stratify the total population but applying it, the detection of outliers is a necessary prerequisite. Failing to identify outliers will fail to apply this method
many ways to identify outliers based on the assumption of normal distribution Some other methods could also be applied, such as kernel density estimation, clustering, etc…


 corochann
 kzmssk
 yukako_nakano
 ontheslope
 yumaichikawa
 junkurihara
 rikkabotan7
 institutdelelevage
 mikimhk
 sishi2026
 takehaya
 aki_iinuma
 tomoyanonymous
 eileencodes
 lauravandoore
 orderedlist
 rocio
 asonas
 madoxten
 joshbly
 axbom
 dougneiner