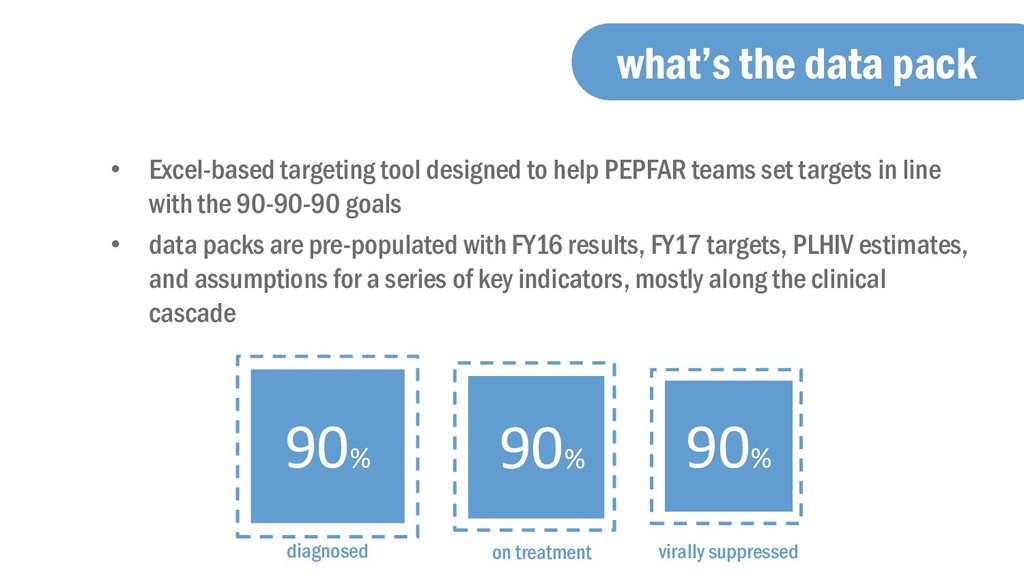
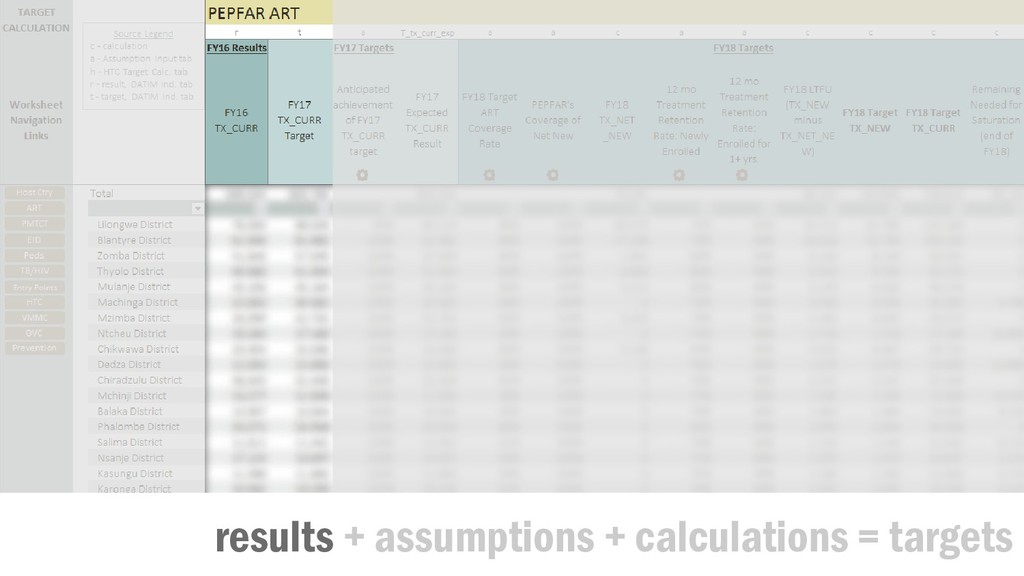
help PEPFAR teams set targets in line with the 90-90-90 goals • data packs are pre-populated with FY16 results, FY17 targets, PLHIV estimates, and assumptions for a series of key indicators, mostly along the clinical cascade diagnosed on treatment virally suppressed 90% 90% 90%
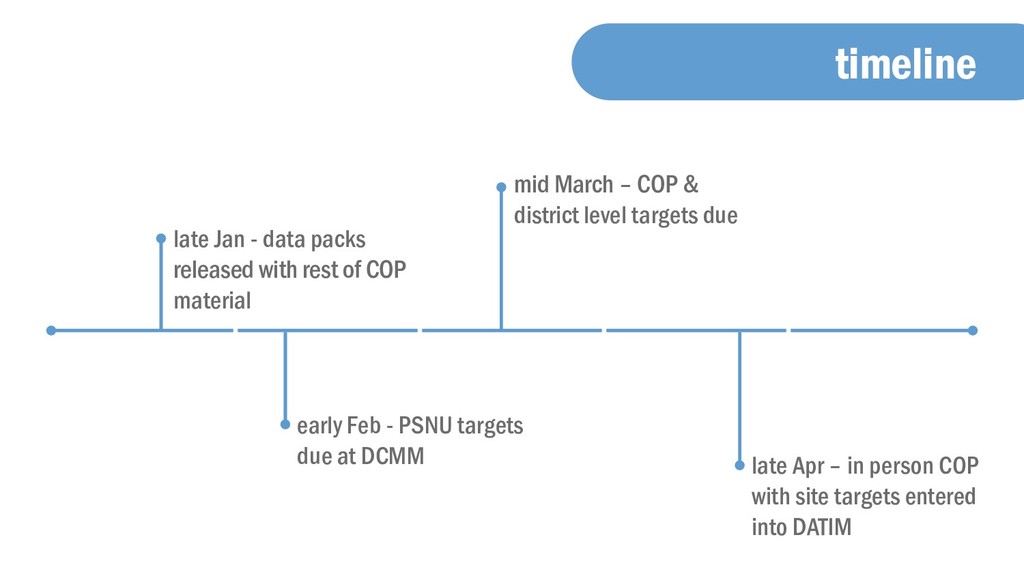
material early Feb - PSNU targets due at DCMM mid March – COP & district level targets due late Apr – in person COP with site targets entered into DATIM timeline
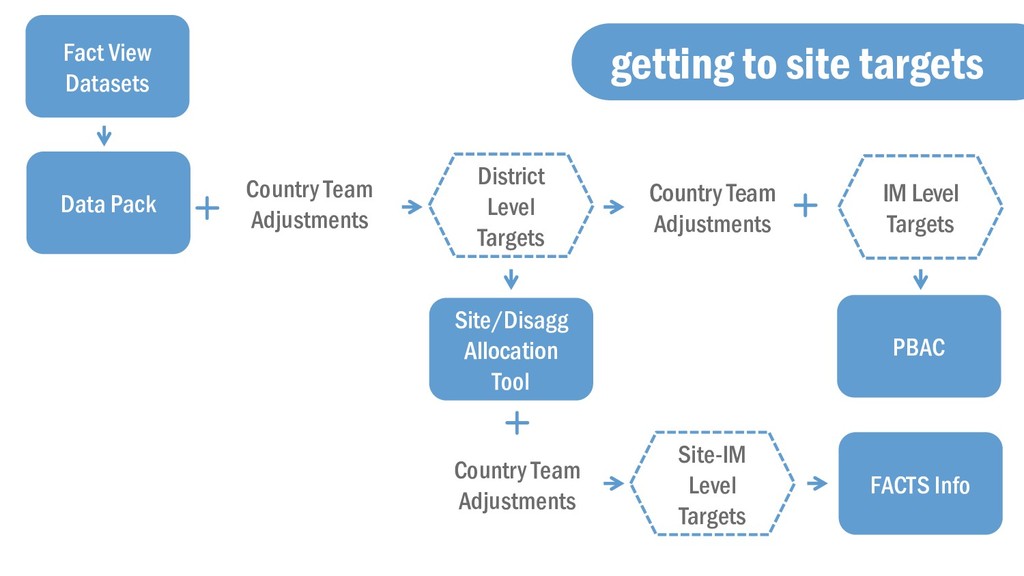
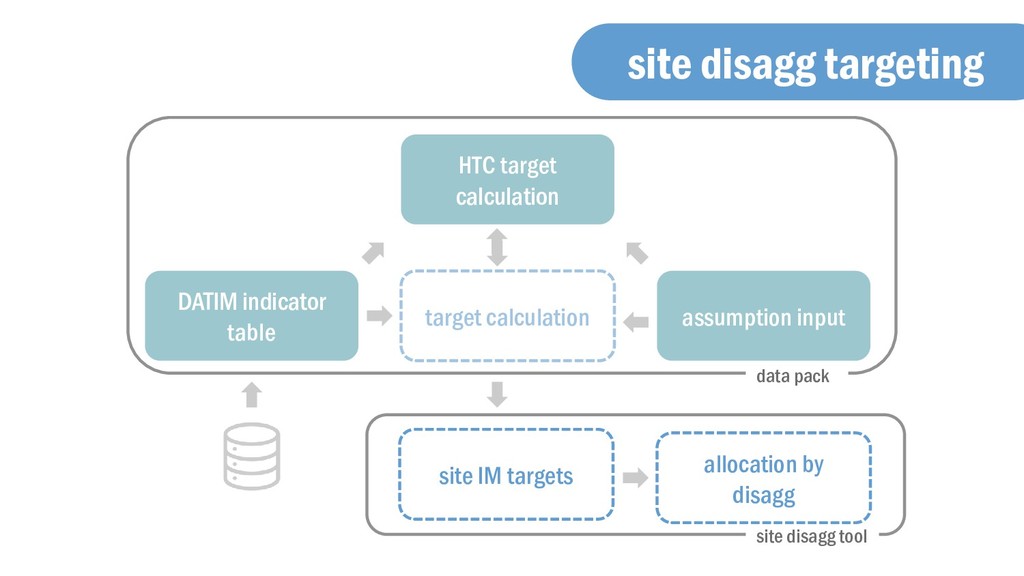
Targets IM Level Targets Site/Disagg Allocation Tool Site-IM Level Targets PBAC Country Team Adjustments Country Team Adjustments getting to site targets FACTS Info
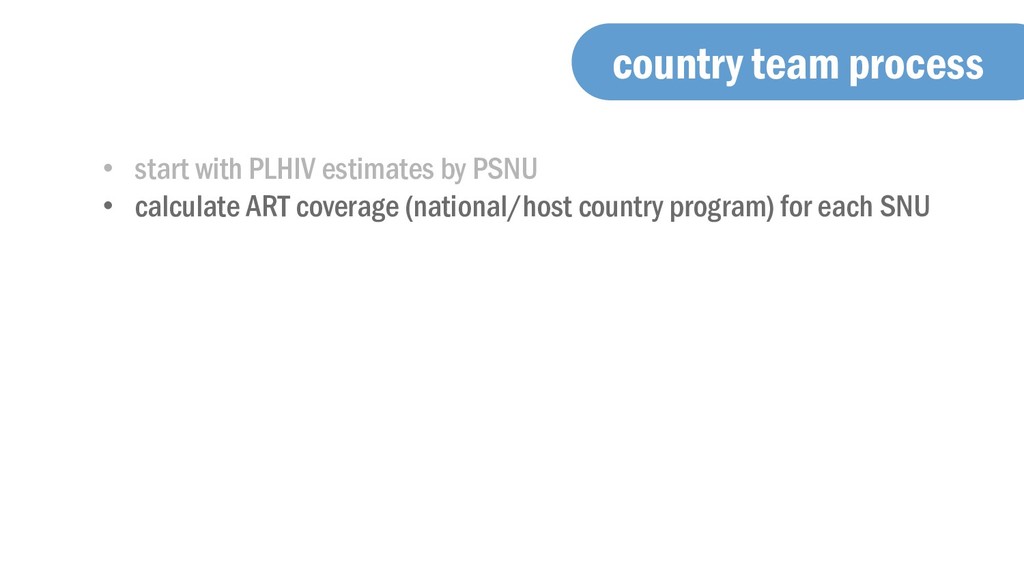
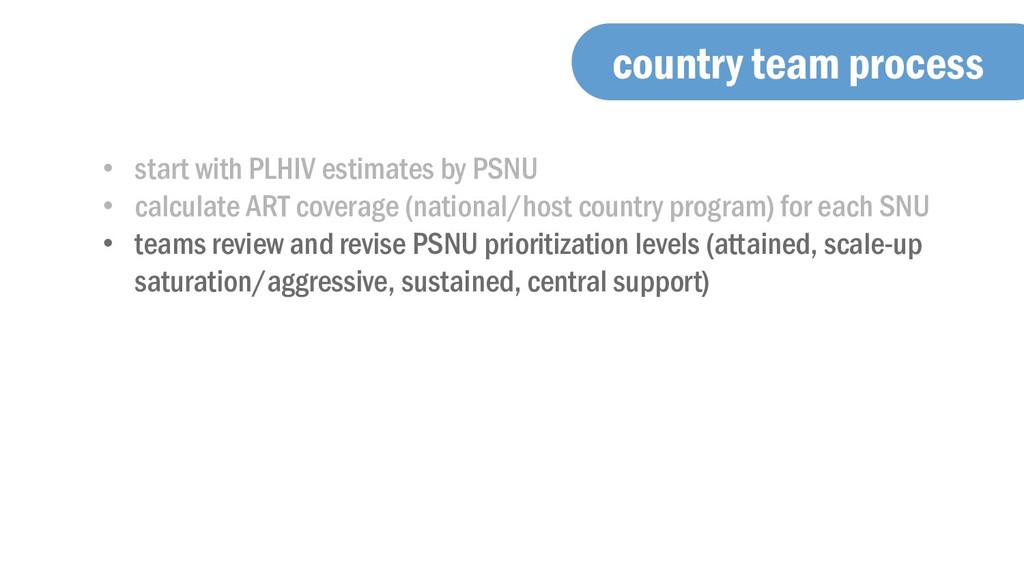
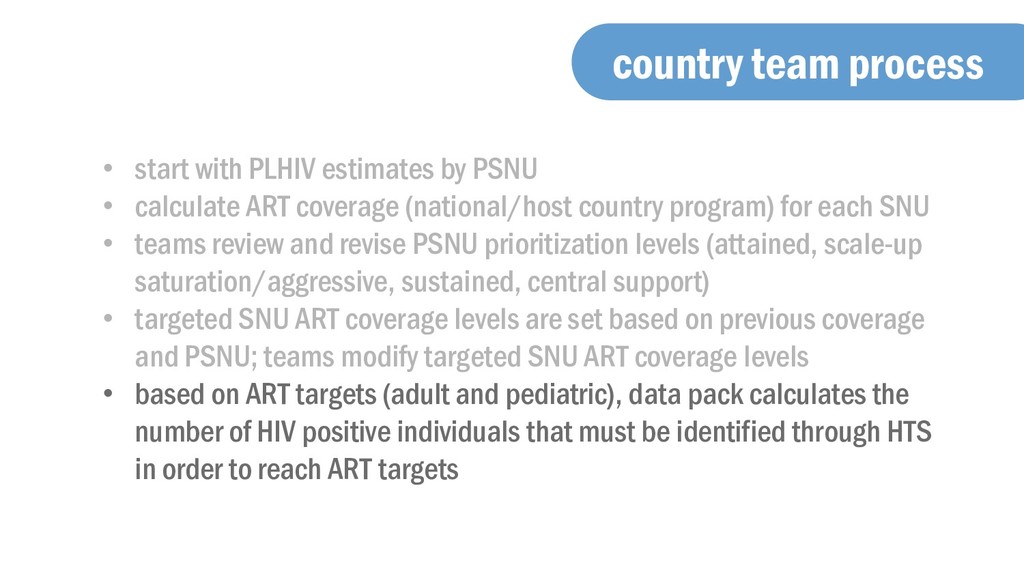
• calculate ART coverage (national/host country program) for each SNU • teams review and revise PSNU prioritization levels (attained, scale-up saturation/aggressive, sustained, central support)
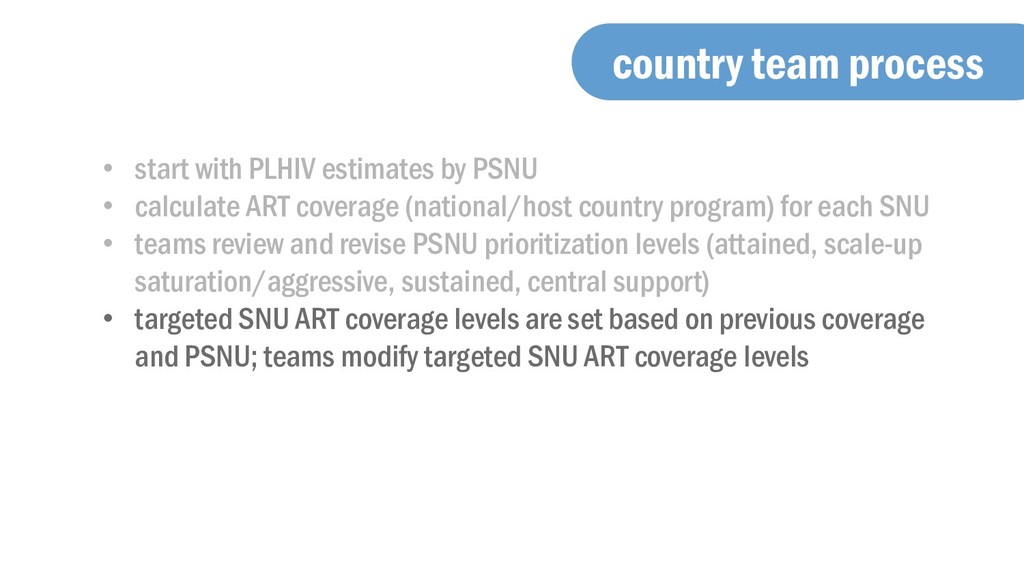
• calculate ART coverage (national/host country program) for each SNU • teams review and revise PSNU prioritization levels (attained, scale-up saturation/aggressive, sustained, central support) • targeted SNU ART coverage levels are set based on previous coverage and PSNU; teams modify targeted SNU ART coverage levels
• calculate ART coverage (national/host country program) for each SNU • teams review and revise PSNU prioritization levels (attained, scale-up saturation/aggressive, sustained, central support) • targeted SNU ART coverage levels are set based on previous coverage and PSNU; teams modify targeted SNU ART coverage levels • based on ART targets (adult and pediatric), data pack calculates the number of HIV positive individuals that must be identified through HTS in order to reach ART targets
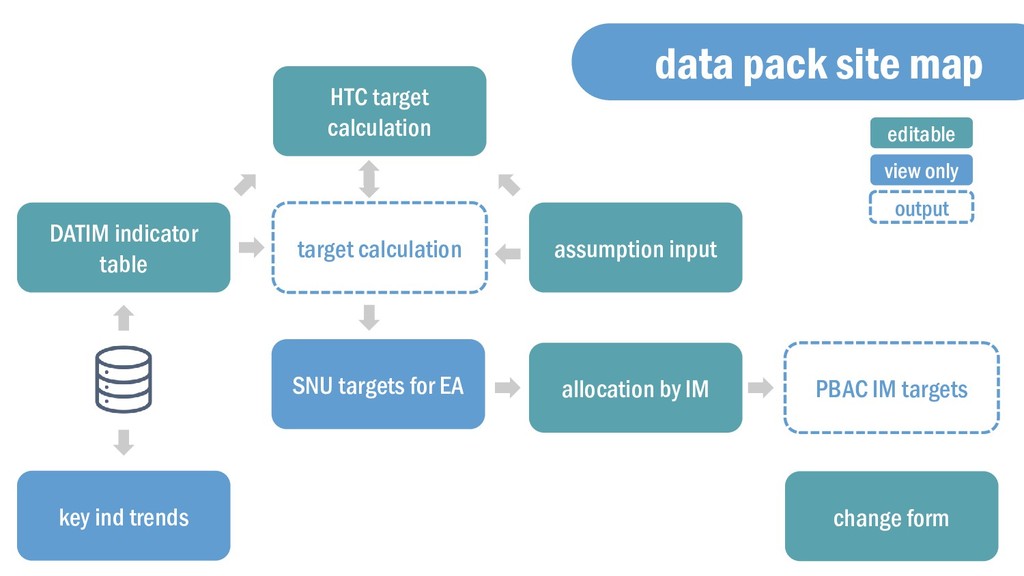
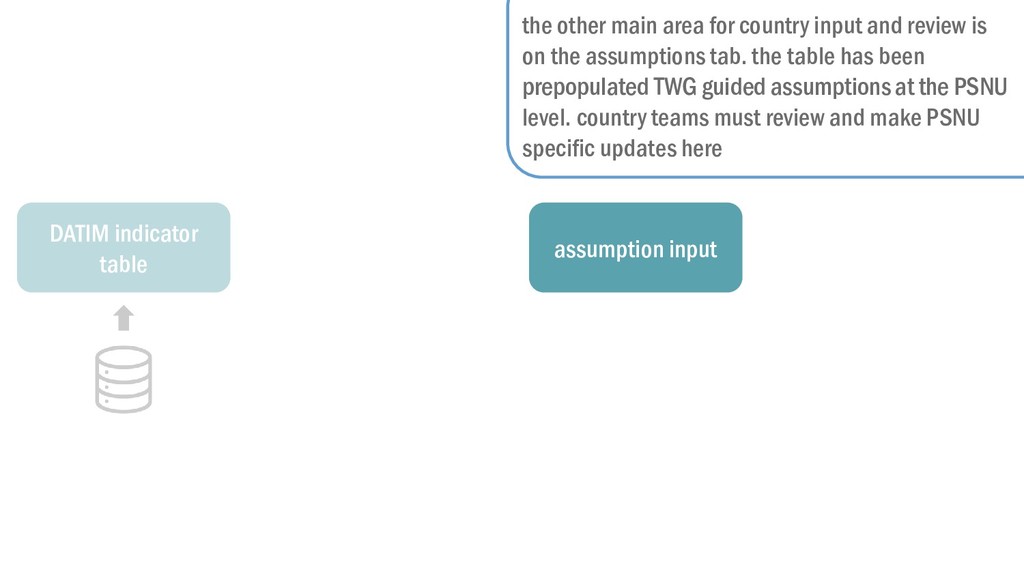
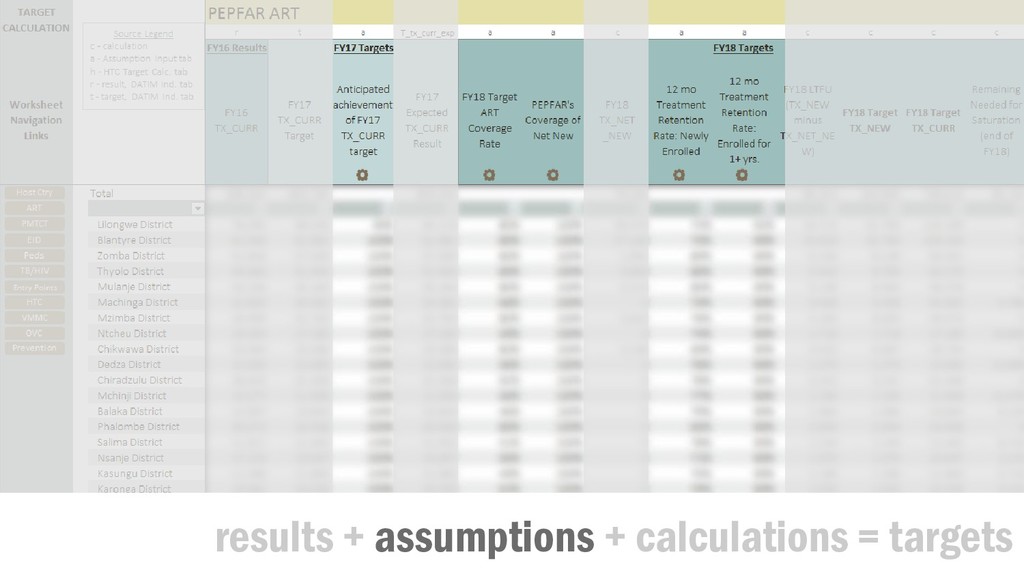
country input and review is on the assumptions tab. the table has been prepopulated TWG guided assumptions at the PSNU level. country teams must review and make PSNU specific updates here
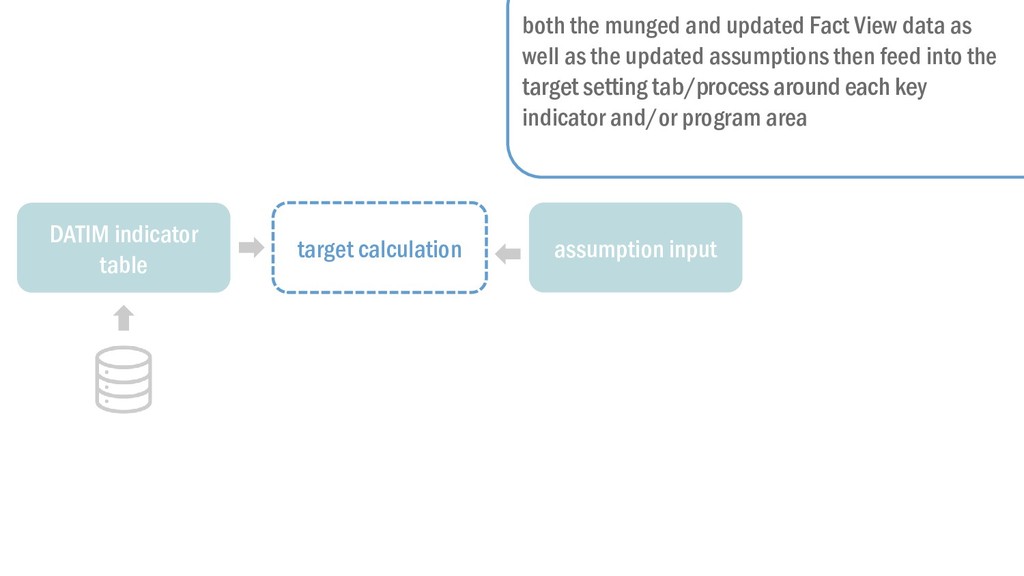
and updated Fact View data as well as the updated assumptions then feed into the target setting tab/process around each key indicator and/or program area
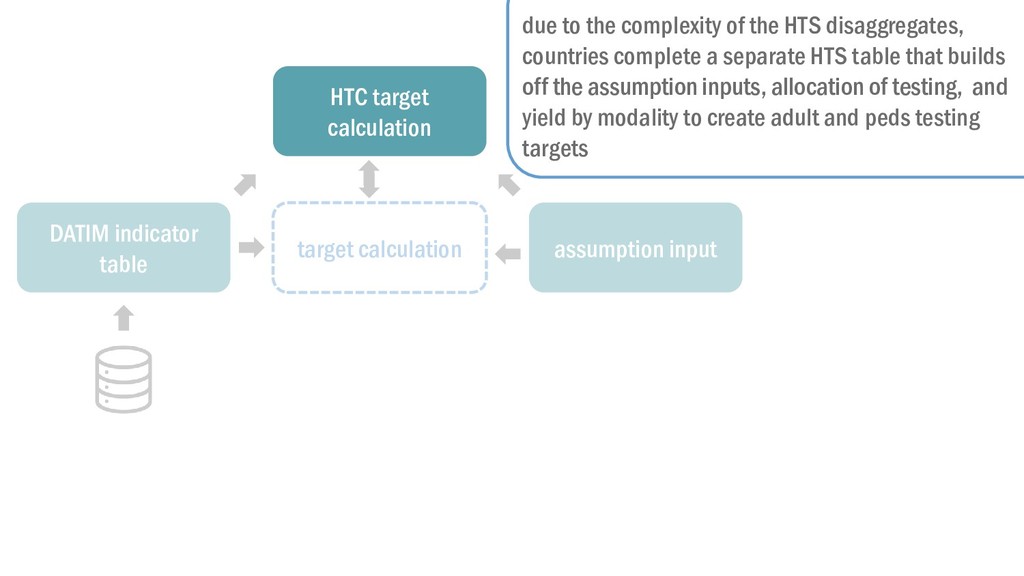
due to the complexity of the HTS disaggregates, countries complete a separate HTS table that builds off the assumption inputs, allocation of testing, and yield by modality to create adult and peds testing targets
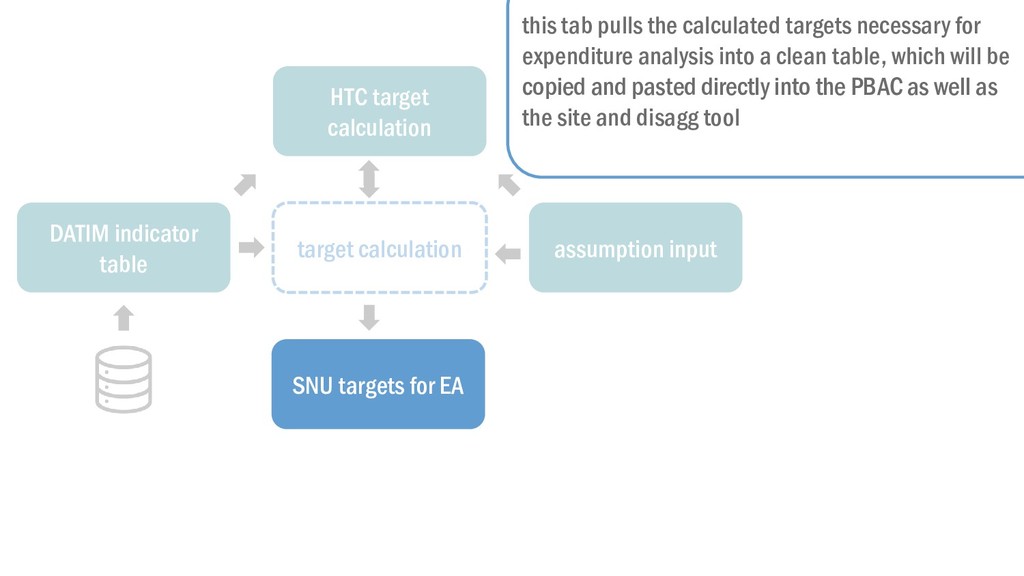
SNU targets for EA this tab pulls the calculated targets necessary for expenditure analysis into a clean table, which will be copied and pasted directly into the PBAC as well as the site and disagg tool
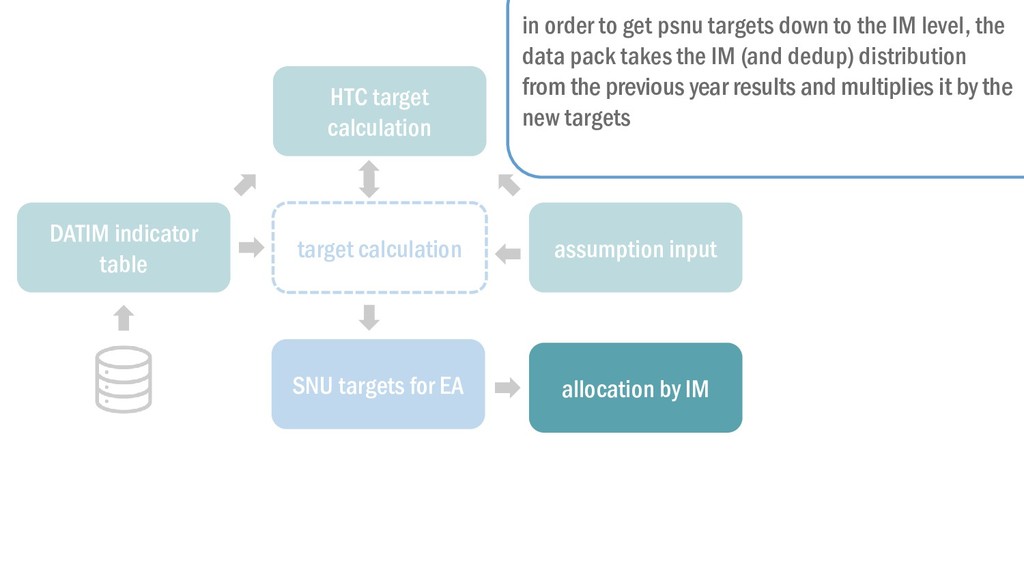
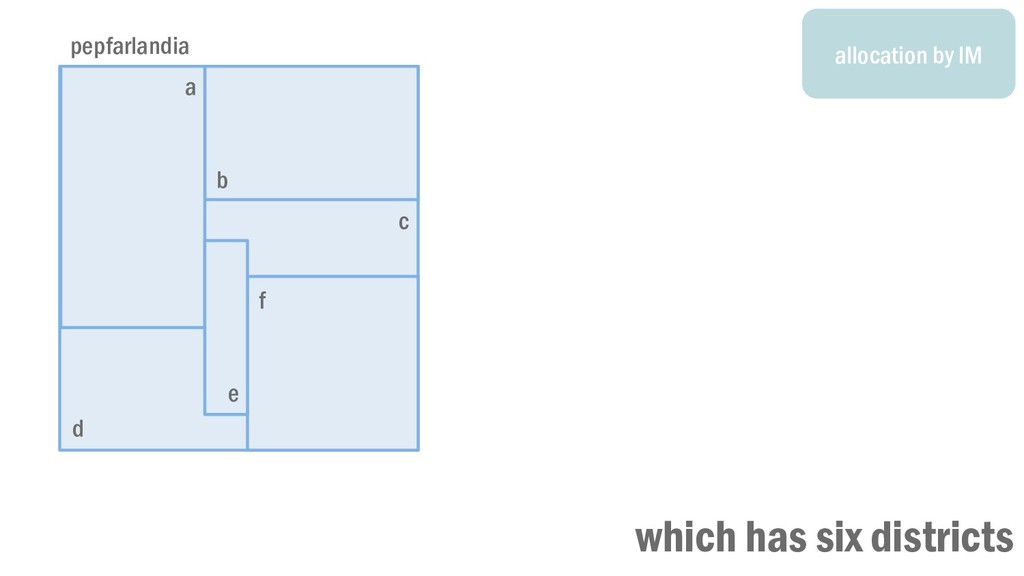
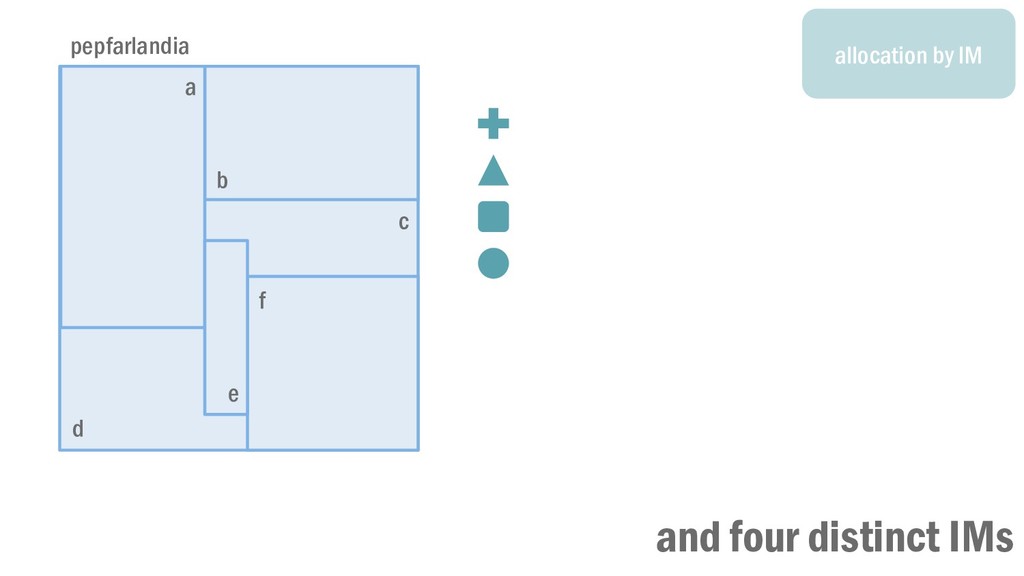
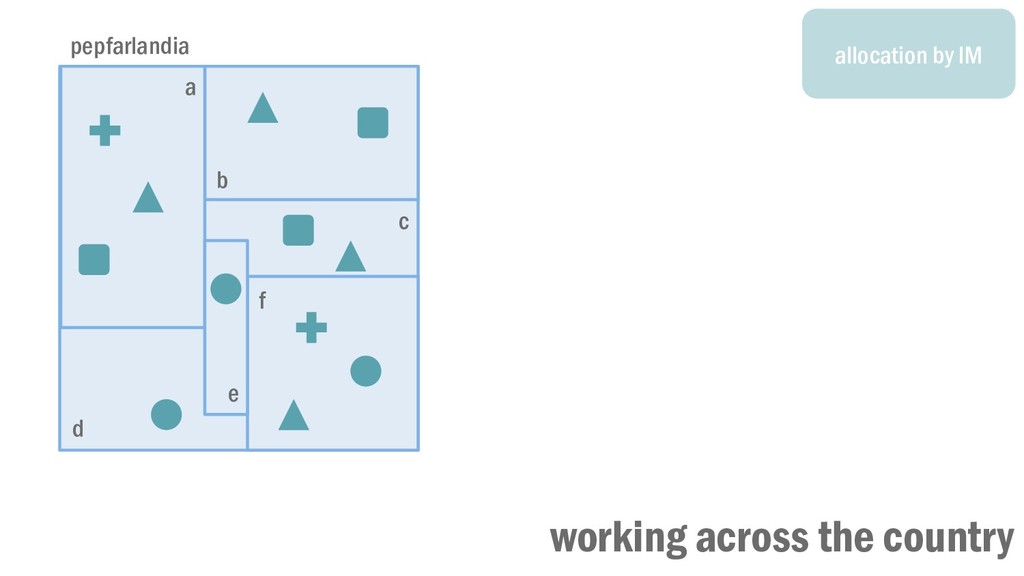
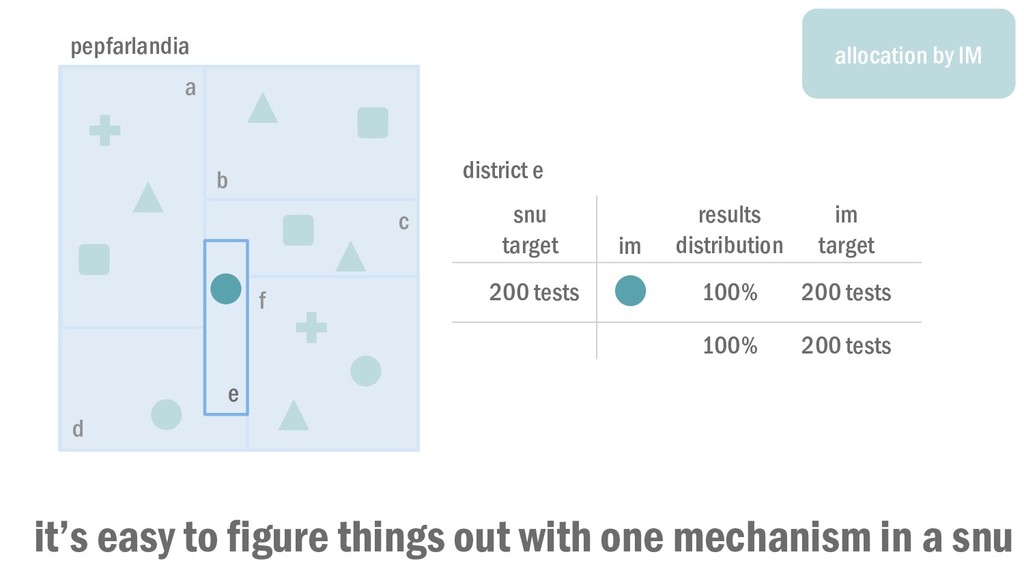
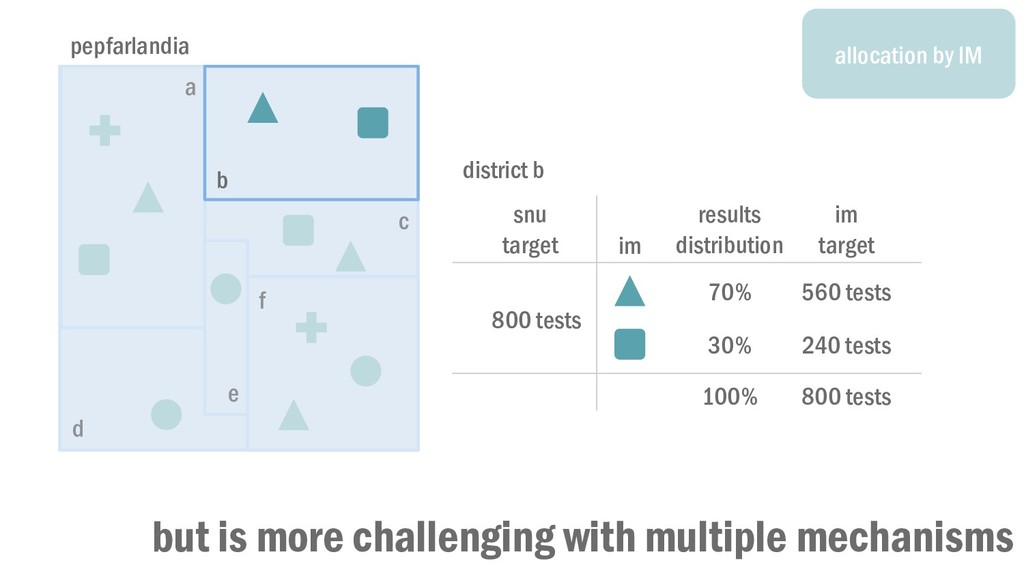
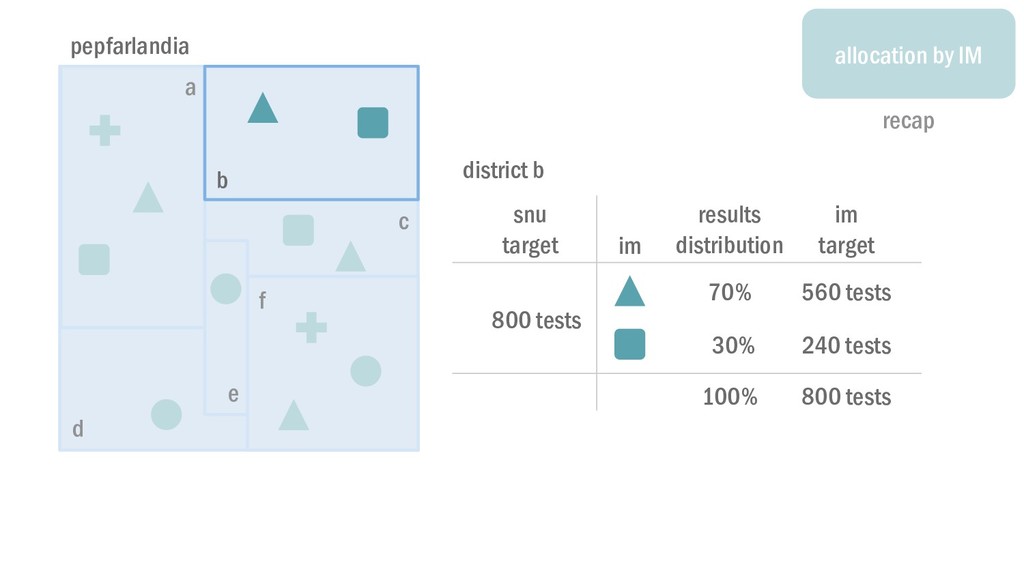
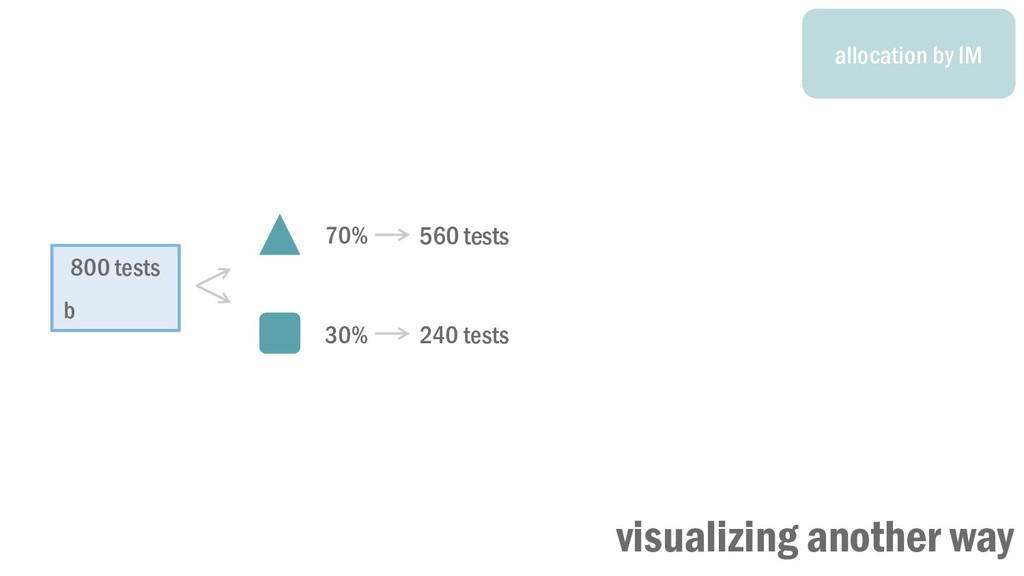
SNU targets for EA allocation by IM in order to get psnu targets down to the IM level, the data pack takes the IM (and dedup) distribution from the previous year results and multiplies it by the new targets
results distribution district b 70% im target snu target im 800 tests 560 tests 30% 240 tests 100% 800 tests but is more challenging with multiple mechanisms
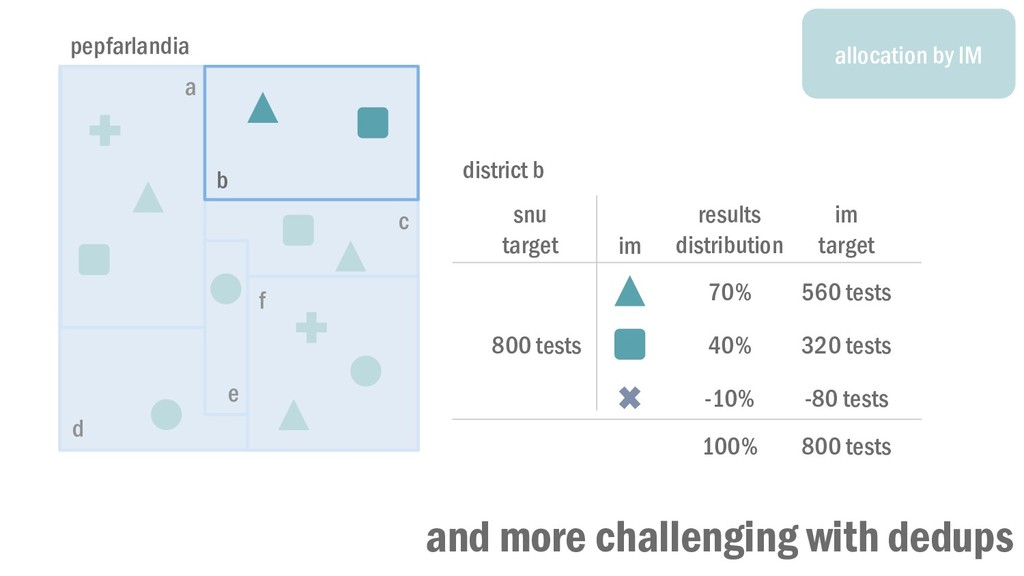
results distribution district b 70% im target snu target im 800 tests 560 tests 40% 320 tests 100% 800 tests -10% -80 tests and more challenging with dedups
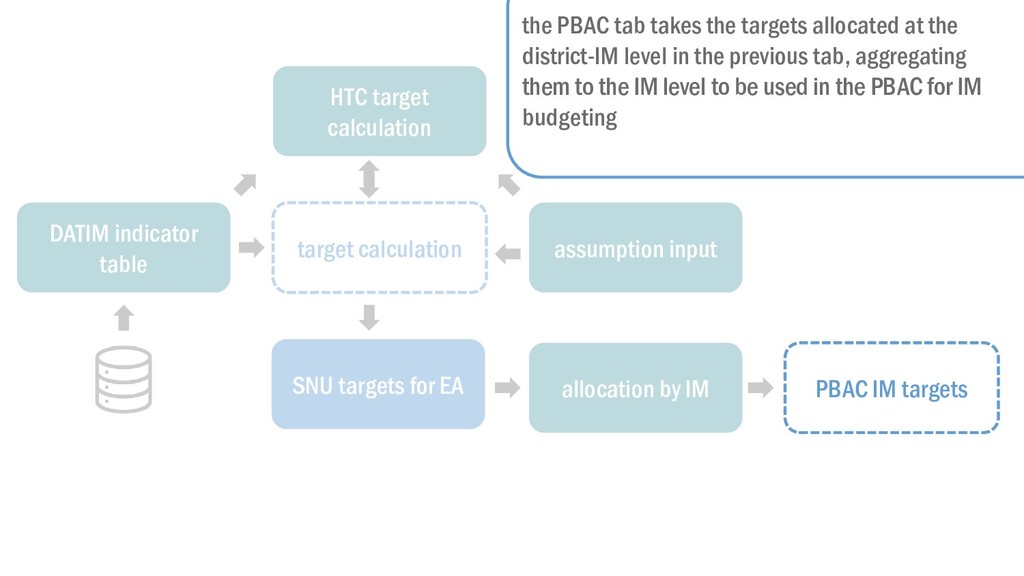
SNU targets for EA allocation by IM PBAC IM targets the PBAC tab takes the targets allocated at the district-IM level in the previous tab, aggregating them to the IM level to be used in the PBAC for IM budgeting
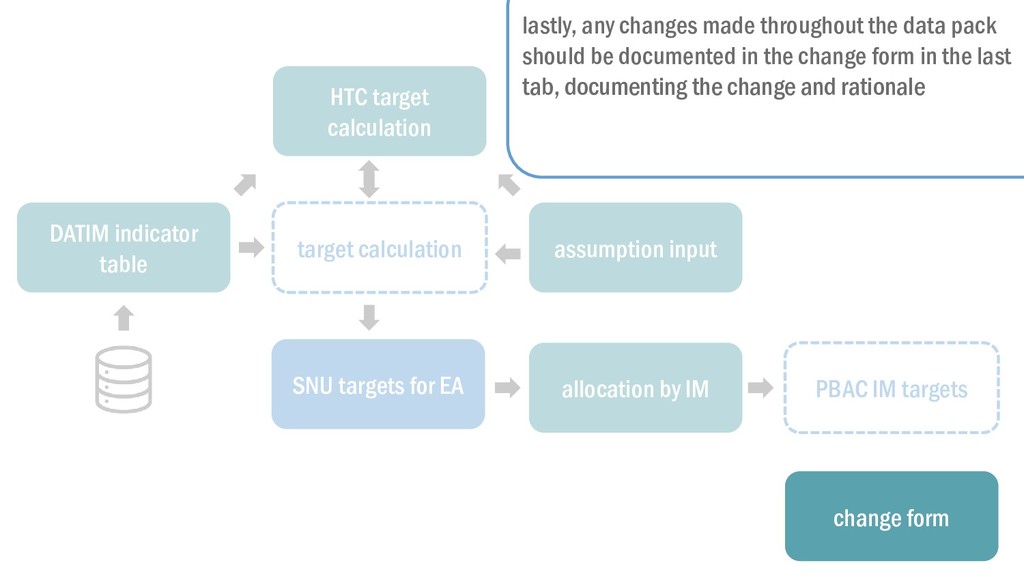
SNU targets for EA allocation by IM PBAC IM targets lastly, any changes made throughout the data pack should be documented in the change form in the last tab, documenting the change and rationale change form
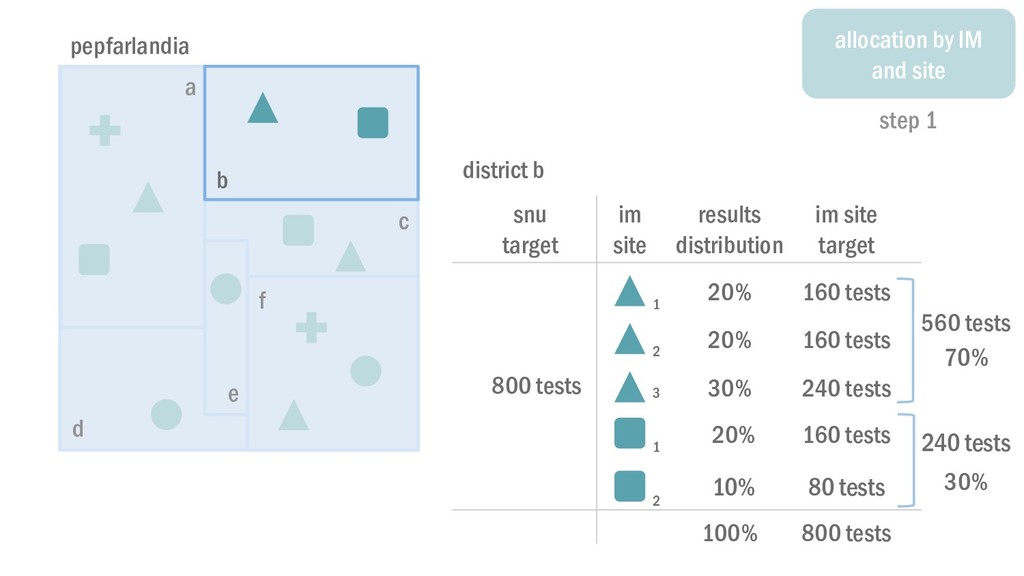
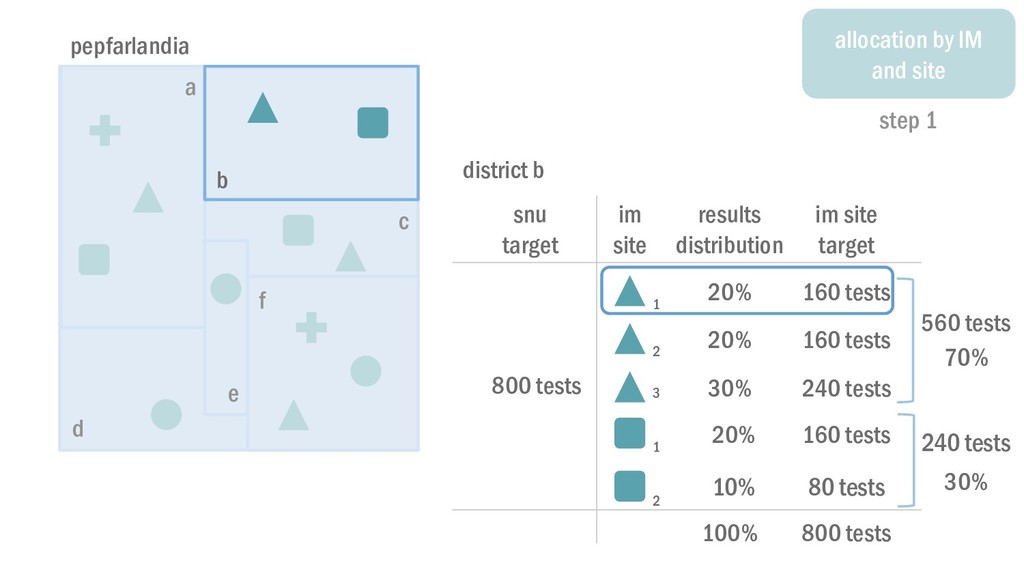
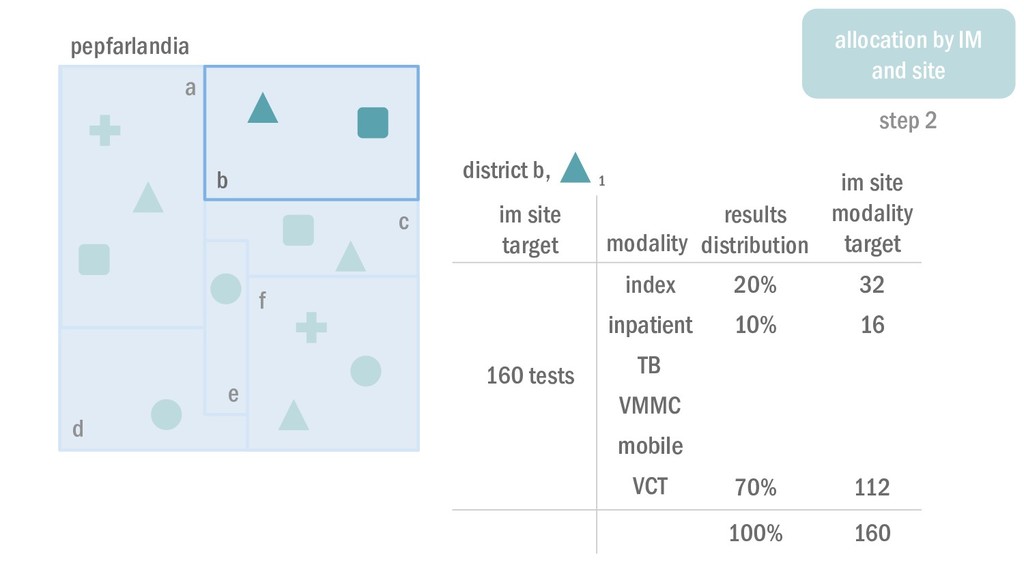
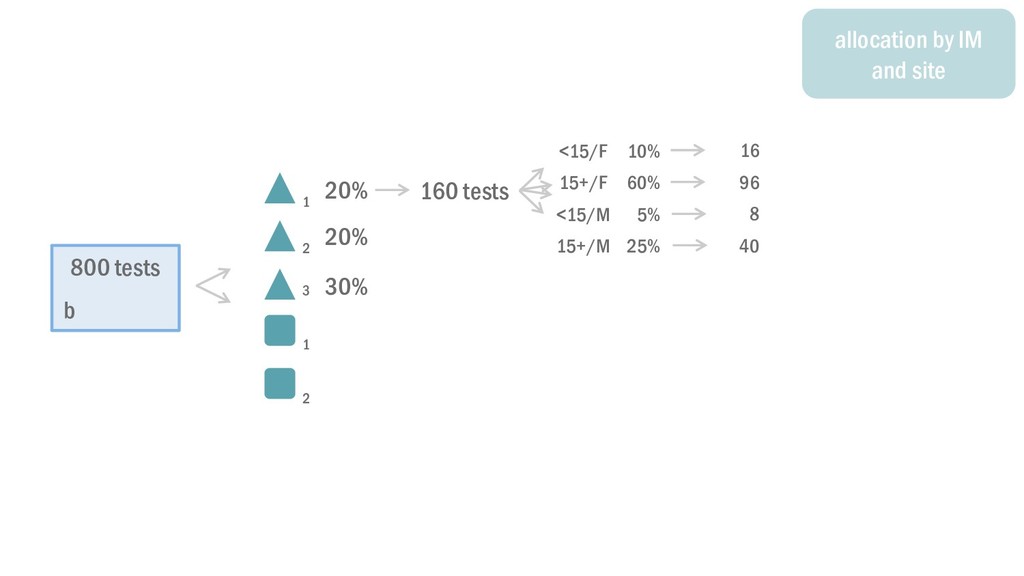
and site results distribution district b, im site modality target im site target modality 20% 160 tests 1 index inpatient TB VMMC mobile VCT 10% 70% 32 16 112 step 2 100% 160
![targeted indicators GEND_GBV PP_PREV [N] HRH_PRE PREP_NEW HTS_TST [facility+community] TB_ART](https://files.speakerdeck.com/presentations/e5b8df4966c34113857b057e3ac4f372/slide_3.jpg)
![targeted indicators GEND_GBV PP_PREV * [N] HRH_PRE PREP_NEW HTS_TST [facility+community]](https://files.speakerdeck.com/presentations/e5b8df4966c34113857b057e3ac4f372/slide_4.jpg)