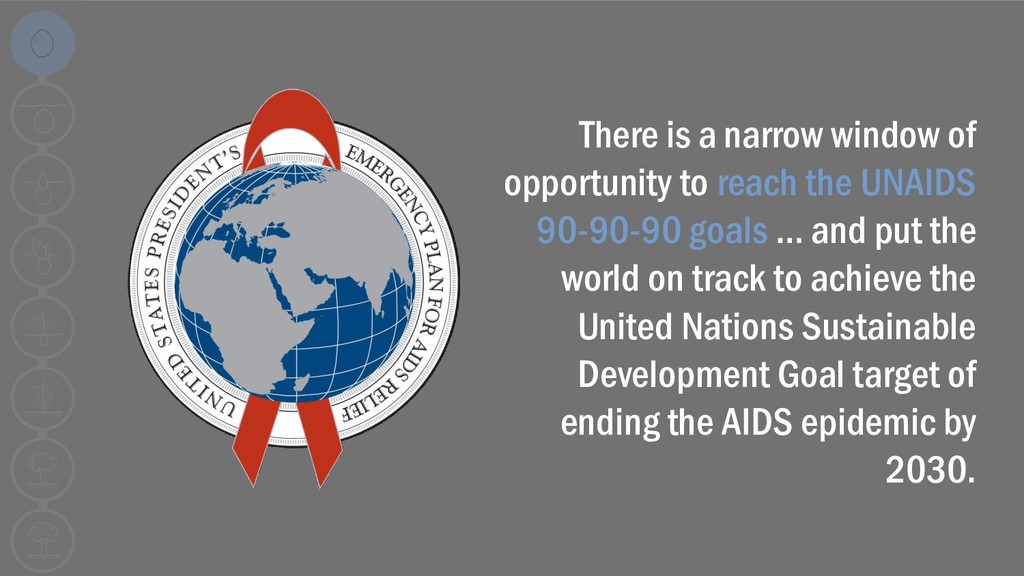
UNAIDS 90-90-90 goals … and put the world on track to achieve the United Nations Sustainable Development Goal target of ending the AIDS epidemic by 2030.
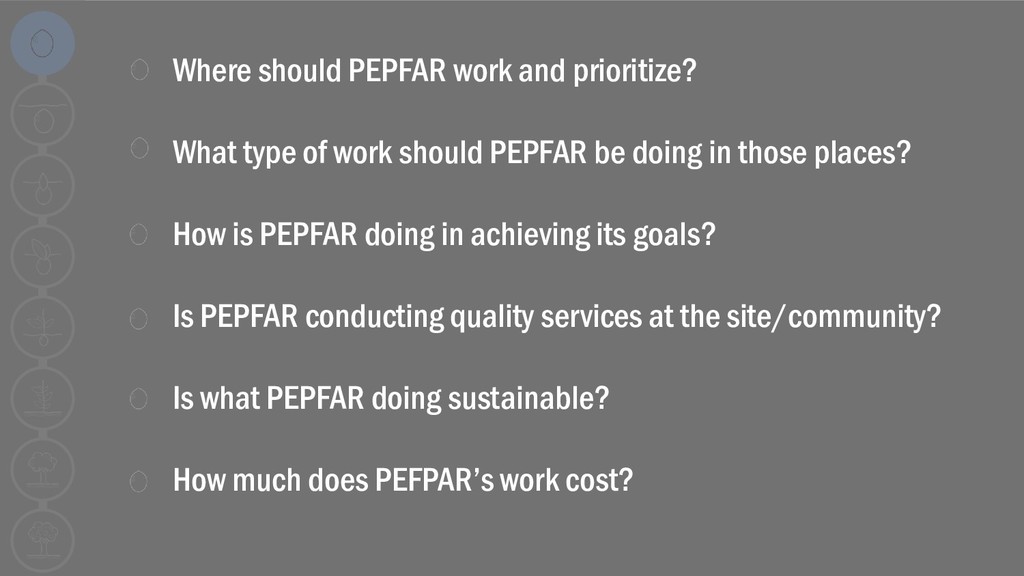
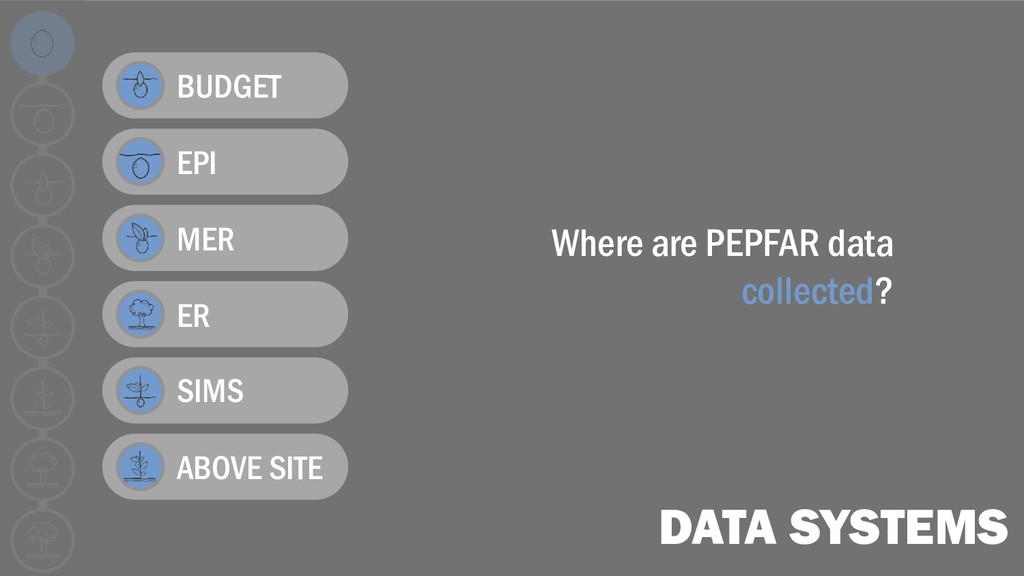
should PEPFAR be doing in those places? How is PEPFAR doing in achieving its goals? Is PEPFAR conducting quality services at the site/community? Is what PEPFAR doing sustainable? How much does PEFPAR’s work cost?
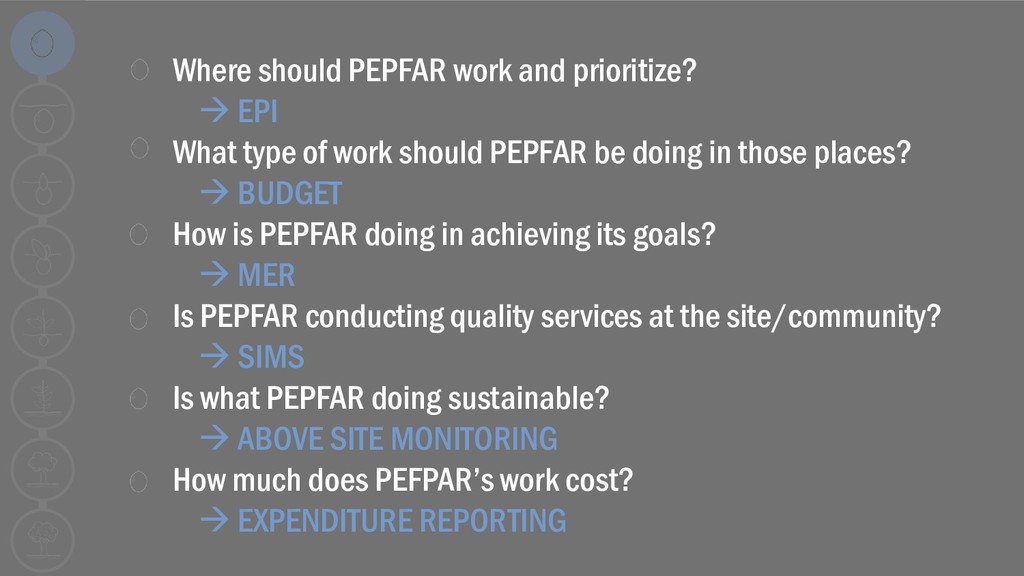
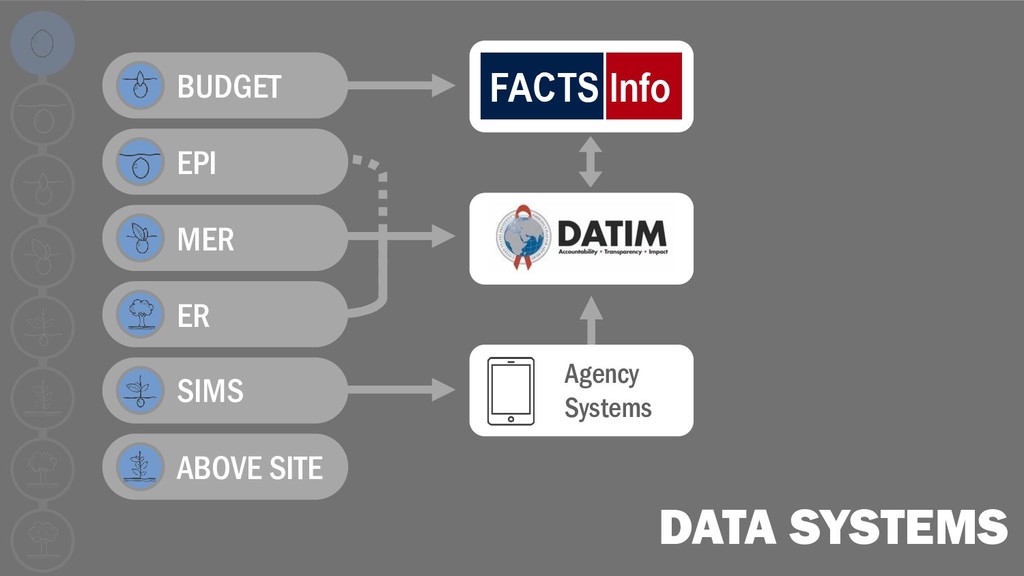
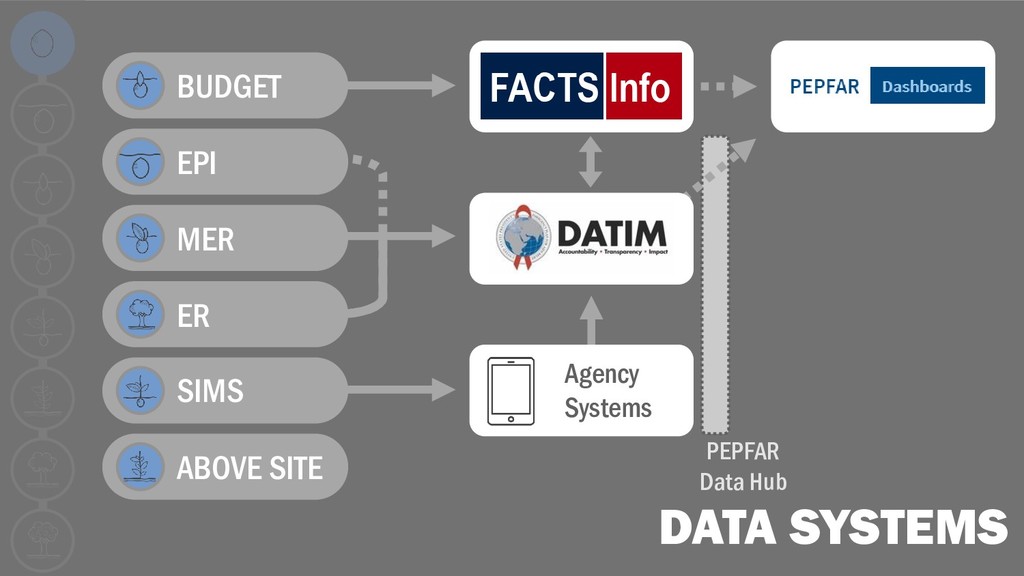
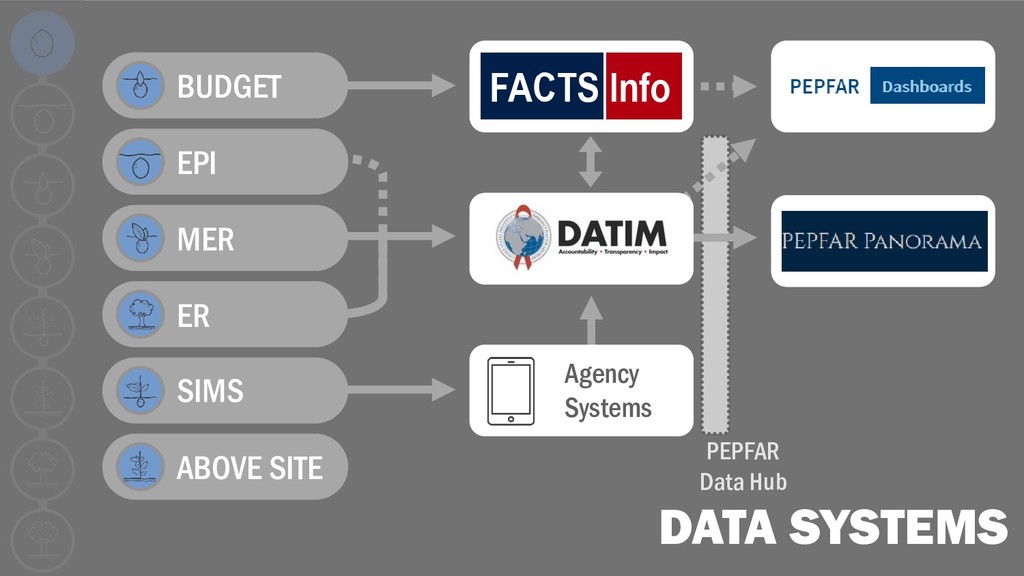
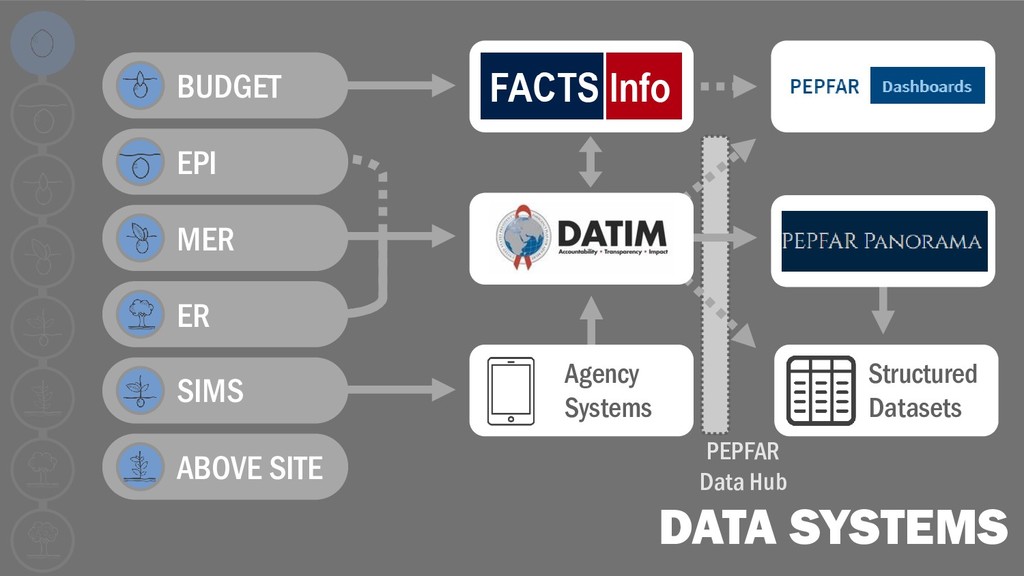
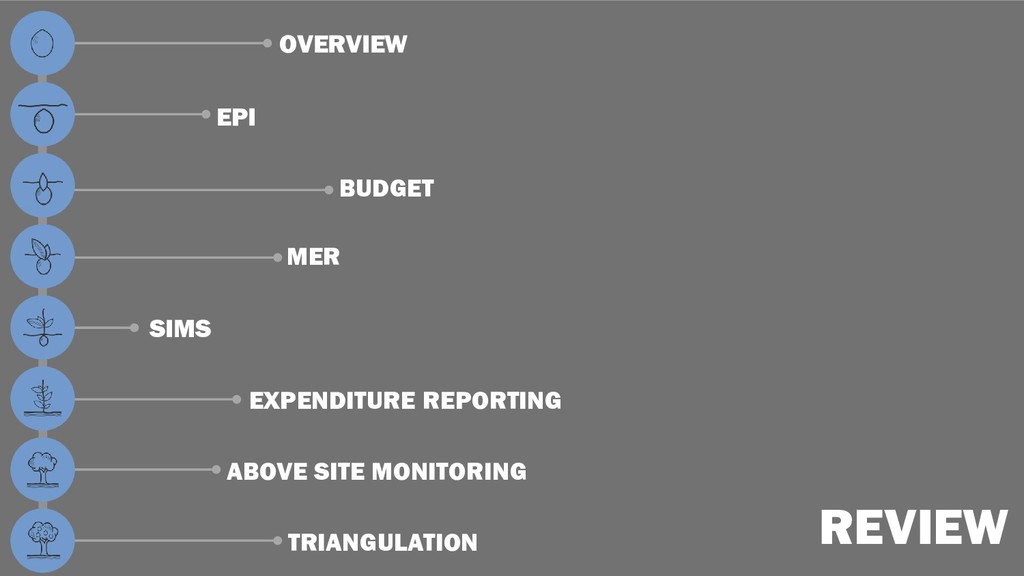
of work should PEPFAR be doing in those places? BUDGET How is PEPFAR doing in achieving its goals? MER Is PEPFAR conducting quality services at the site/community? SIMS Is what PEPFAR doing sustainable? ABOVE SITE MONITORING How much does PEFPAR’s work cost? EXPENDITURE REPORTING
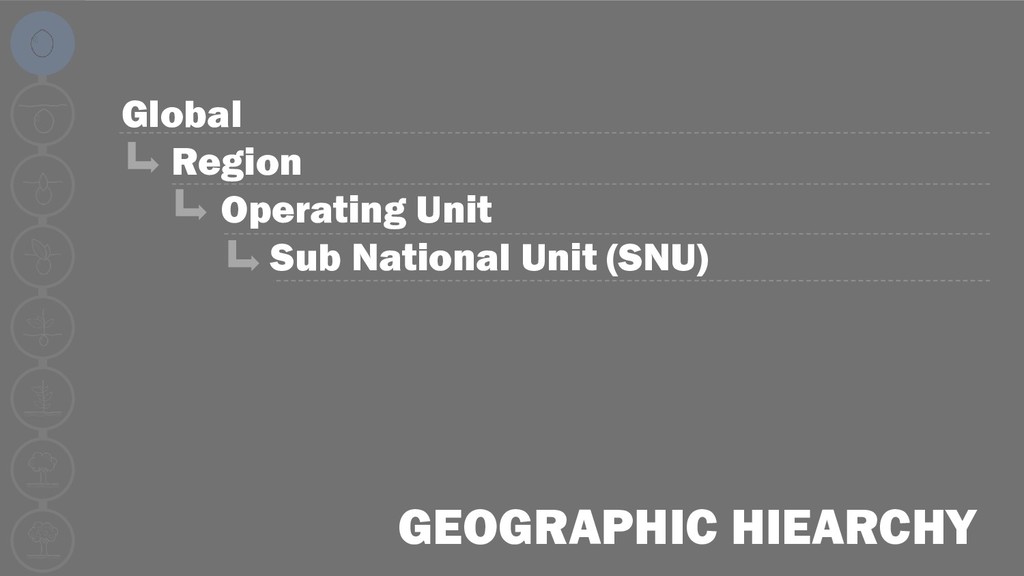
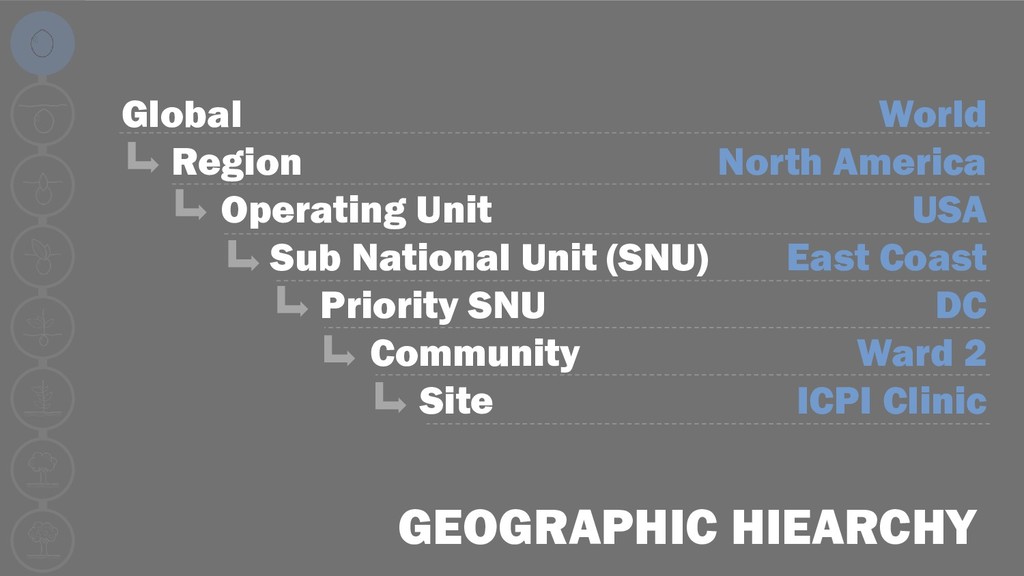
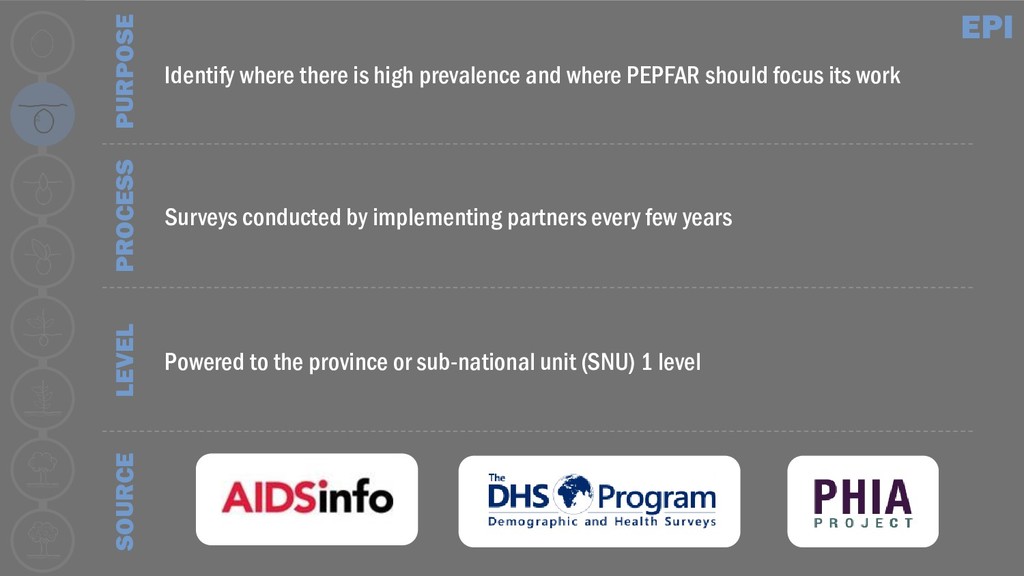
and where PEPFAR should focus its work EPI Surveys conducted by implementing partners every few years Powered to the province or sub-national unit (SNU) 1 level
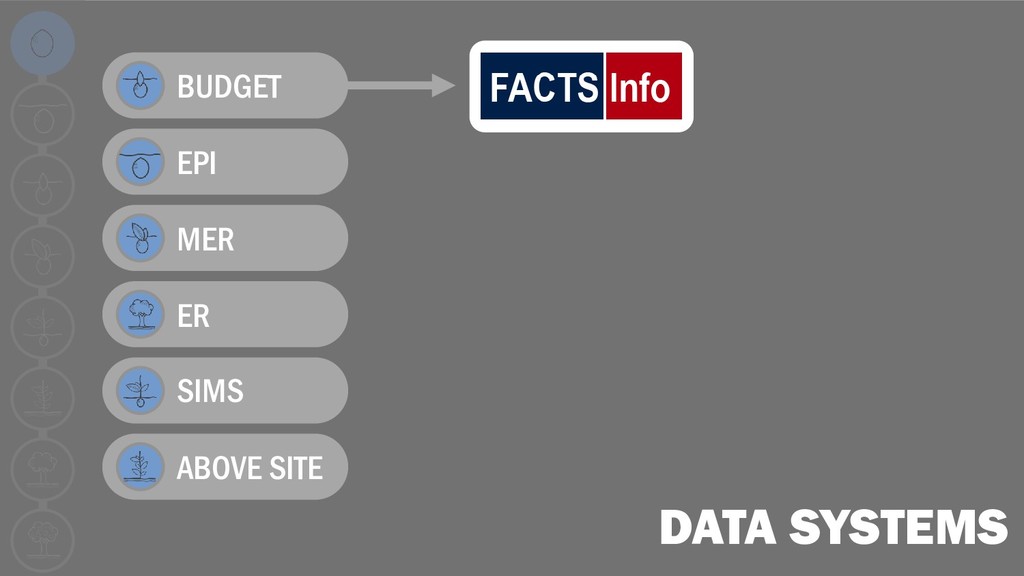
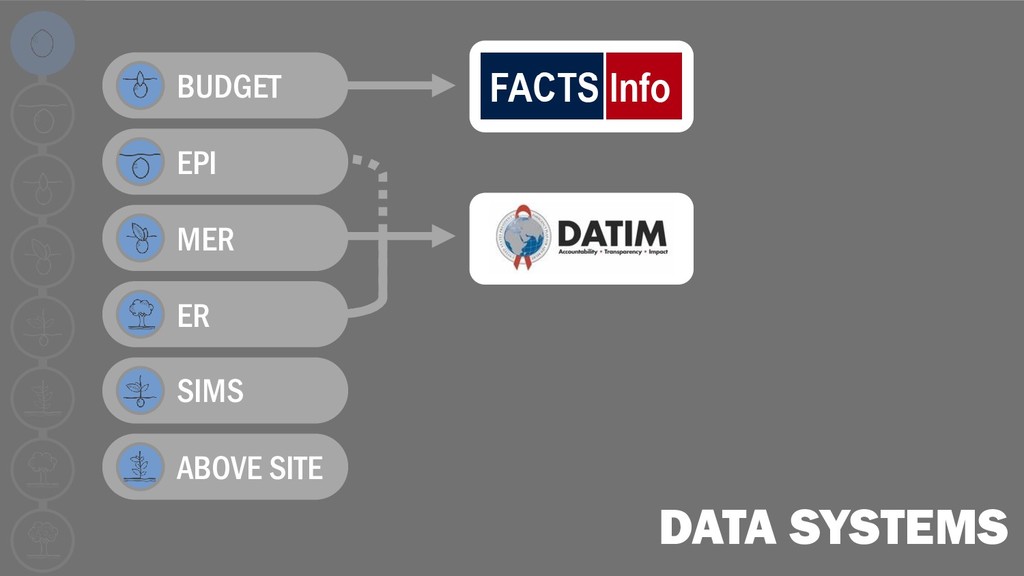
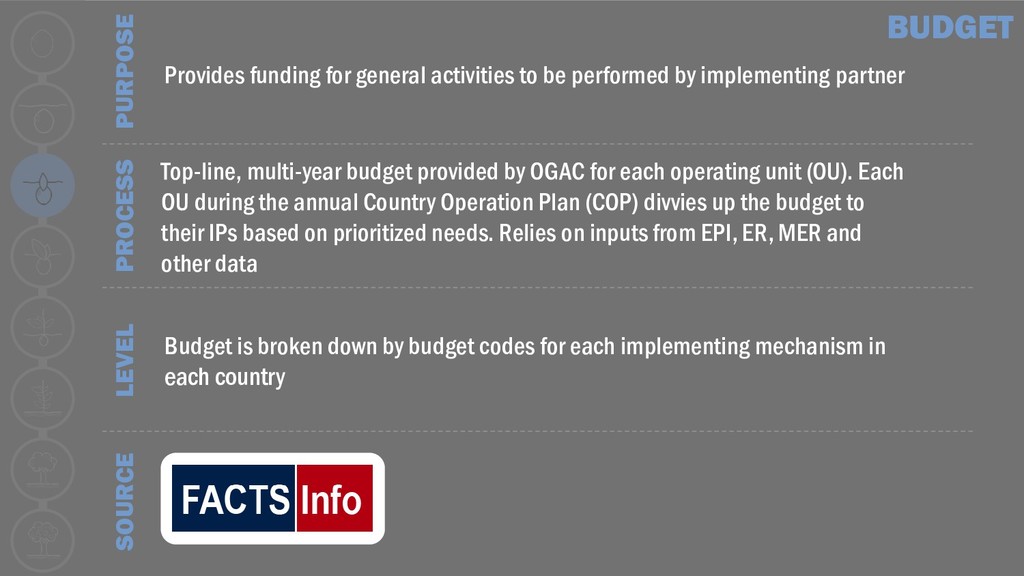
be performed by implementing partner BUDGET Top-line, multi-year budget provided by OGAC for each operating unit (OU). Each OU during the annual Country Operation Plan (COP) divvies up the budget to their IPs based on prioritized needs. Relies on inputs from EPI, ER, MER and other data Budget is broken down by budget codes for each implementing mechanism in each country
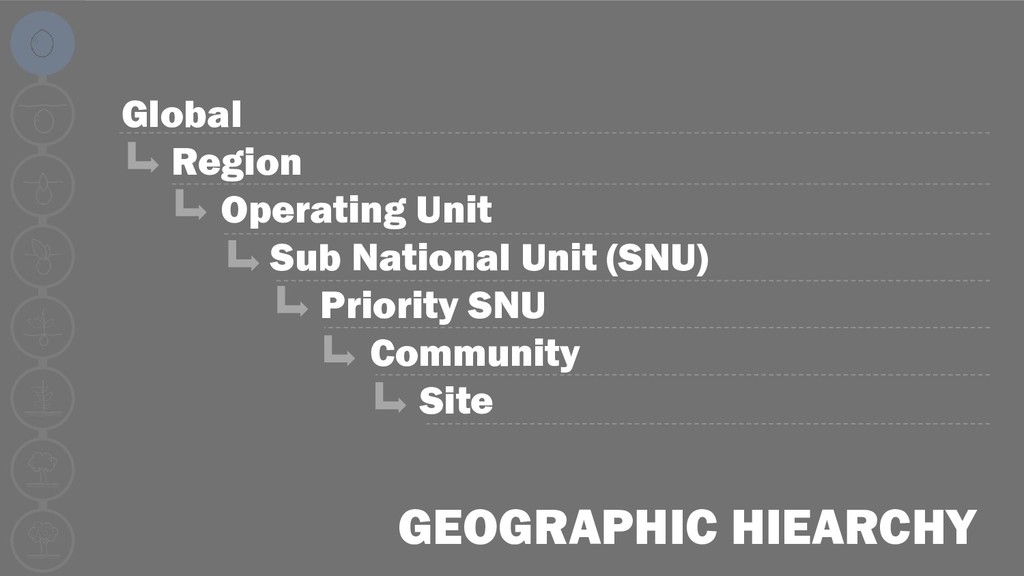
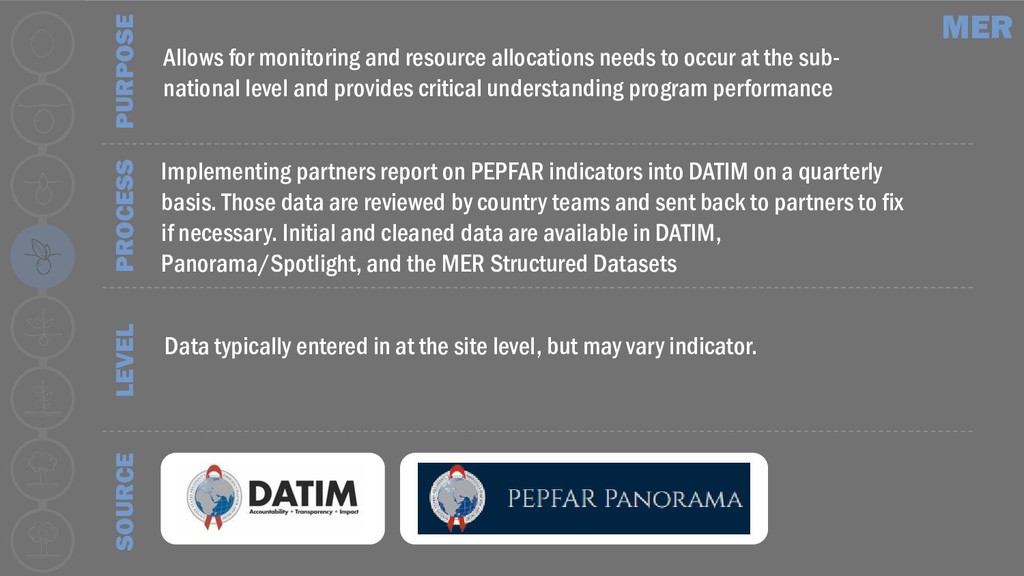
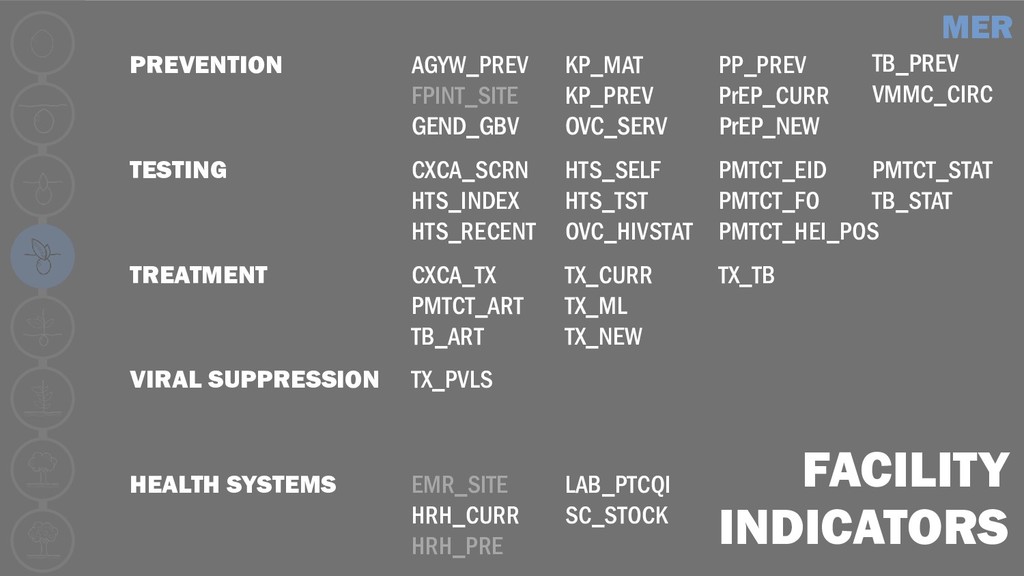
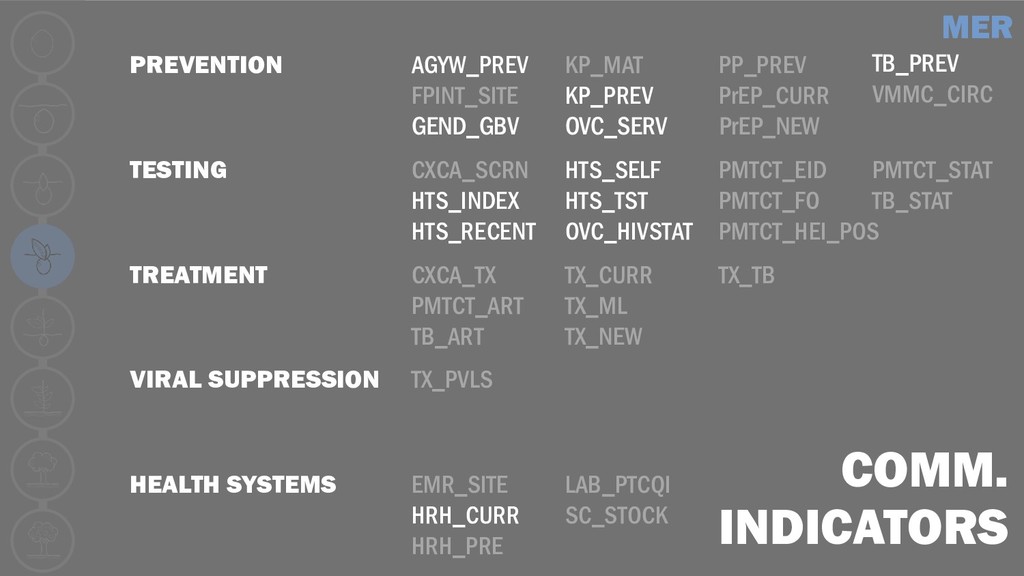
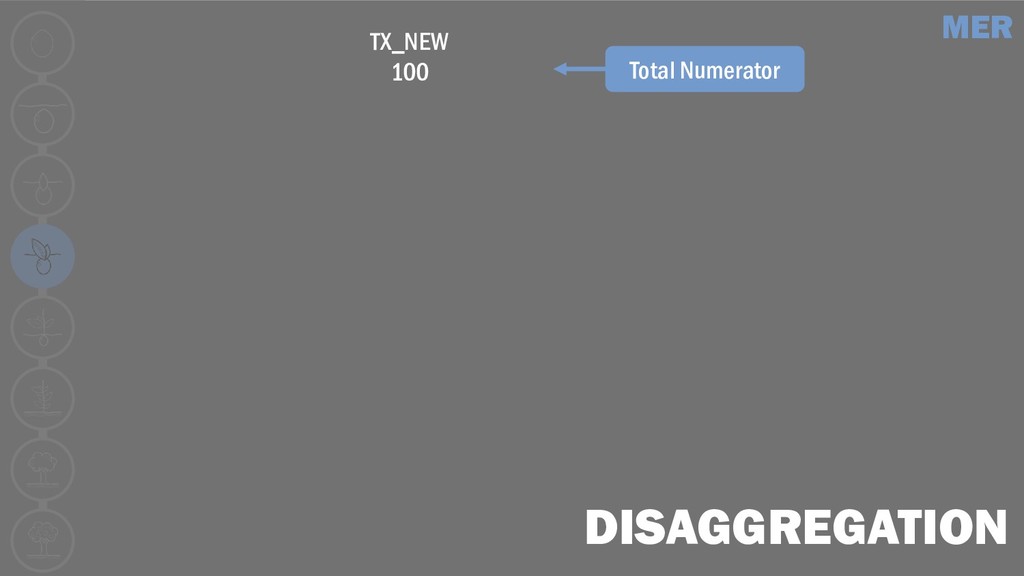
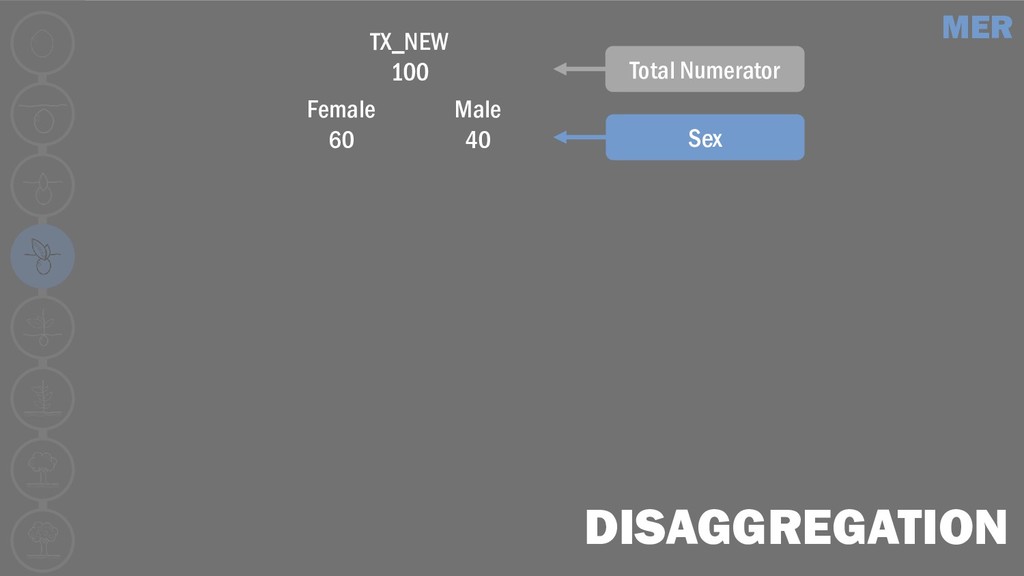
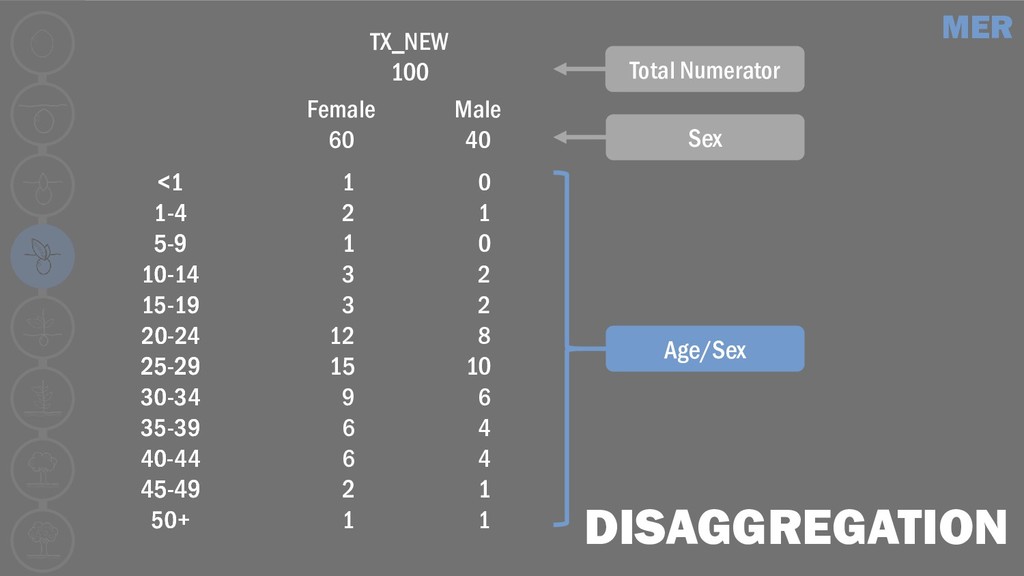
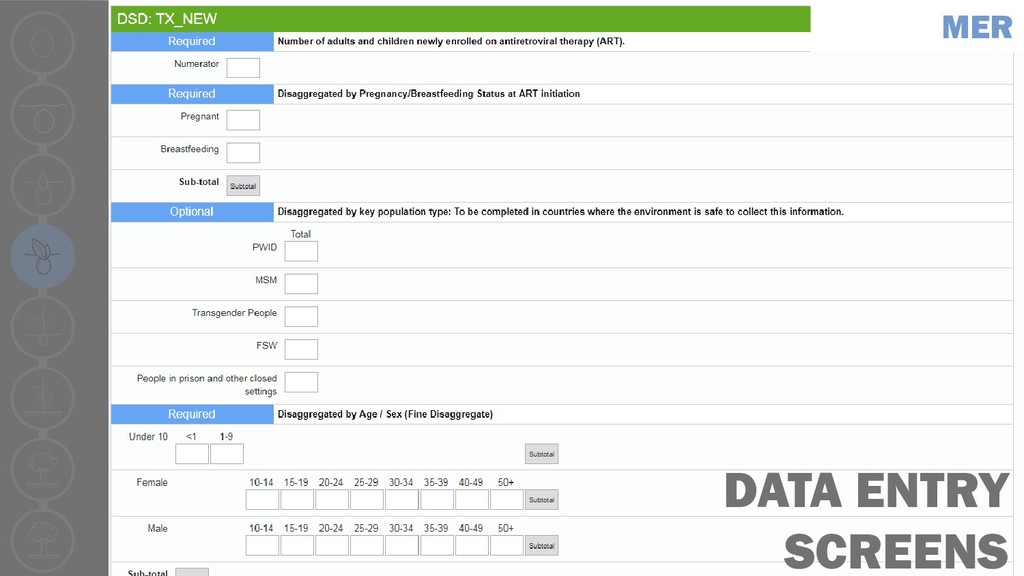
needs to occur at the sub- national level and provides critical understanding program performance MER Implementing partners report on PEPFAR indicators into DATIM on a quarterly basis. Those data are reviewed by country teams and sent back to partners to fix if necessary. Initial and cleaned data are available in DATIM, Panorama/Spotlight, and the MER Structured Datasets Data typically entered in at the site level, but may vary indicator.
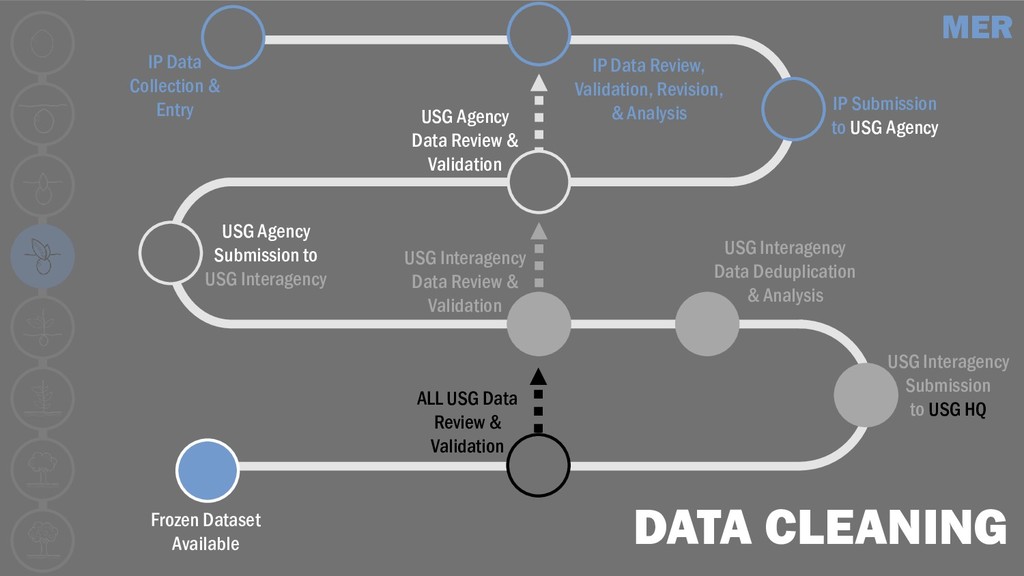
Review, Validation, Revision, & Analysis IP Submission to USG Agency USG Agency Data Review & Validation USG Interagency Data Review & Validation USG Agency Submission to USG Interagency USG Interagency Data Deduplication & Analysis USG Interagency Submission to USG HQ ALL USG Data Review & Validation Frozen Dataset Available
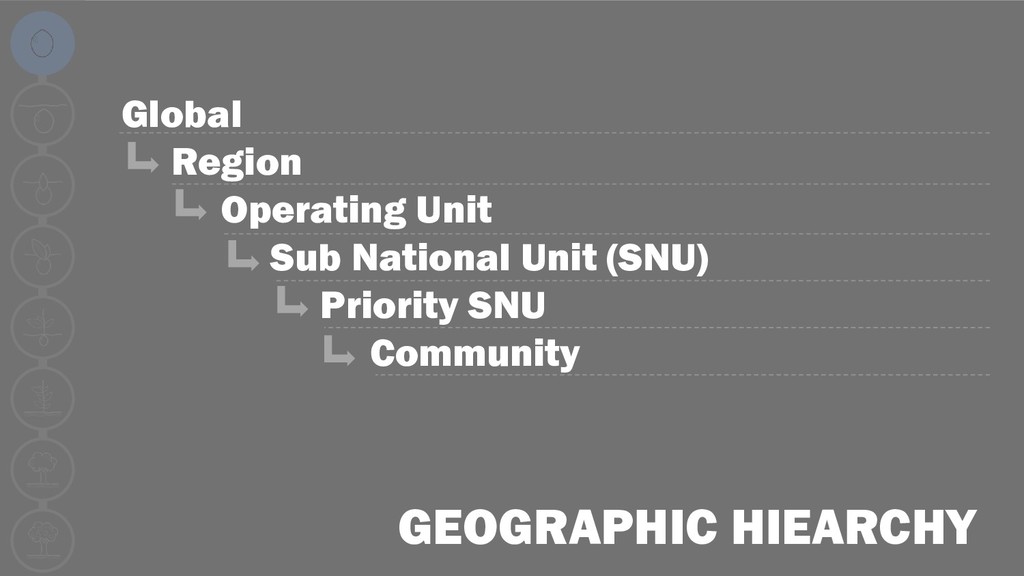
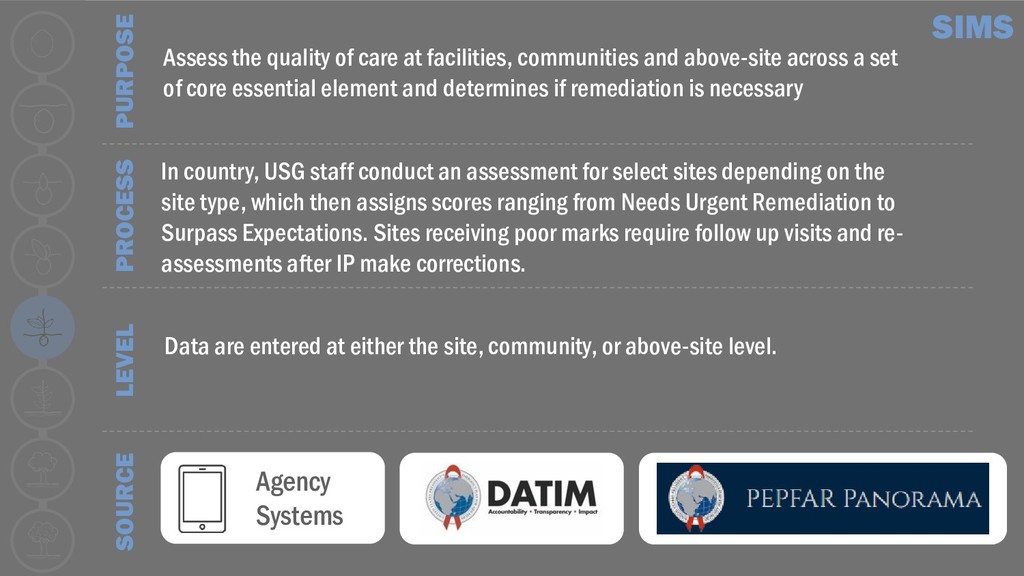
facilities, communities and above-site across a set of core essential element and determines if remediation is necessary SIMS In country, USG staff conduct an assessment for select sites depending on the site type, which then assigns scores ranging from Needs Urgent Remediation to Surpass Expectations. Sites receiving poor marks require follow up visits and re- assessments after IP make corrections. Data are entered at either the site, community, or above-site level. Agency Systems
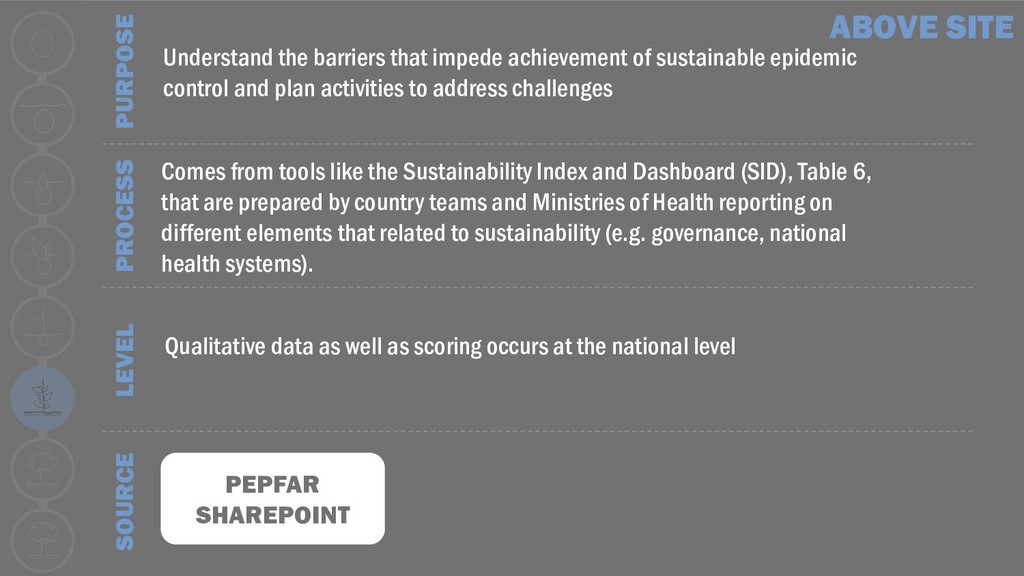
of sustainable epidemic control and plan activities to address challenges ABOVE SITE Comes from tools like the Sustainability Index and Dashboard (SID), Table 6, that are prepared by country teams and Ministries of Health reporting on different elements that related to sustainability (e.g. governance, national health systems). Qualitative data as well as scoring occurs at the national level PEPFAR SHAREPOINT
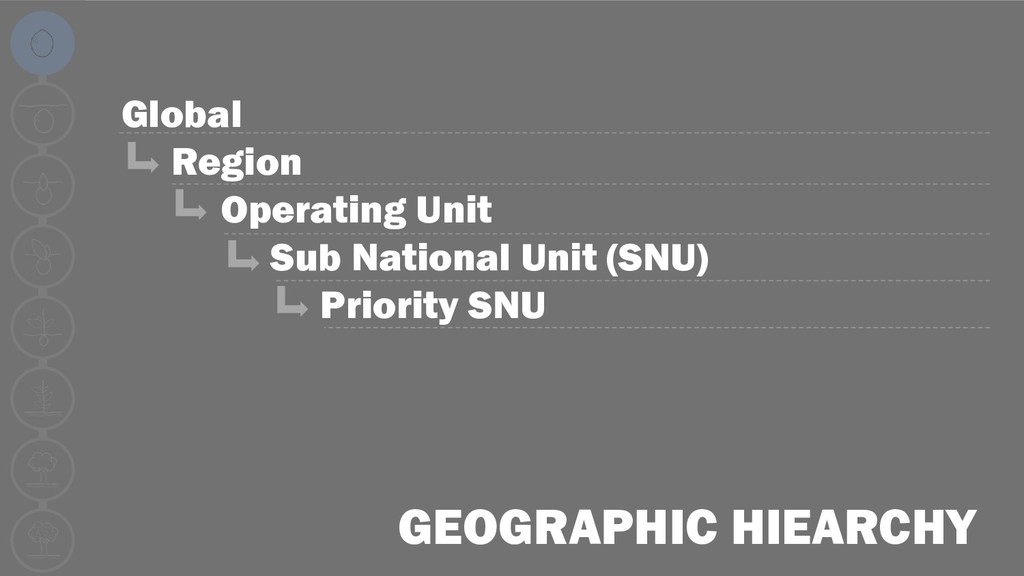
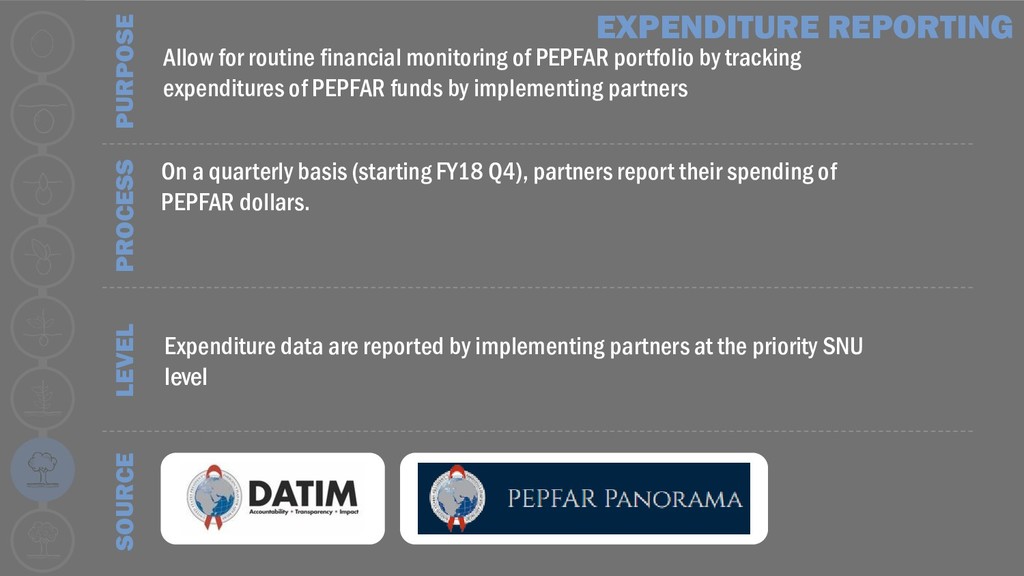
PEPFAR portfolio by tracking expenditures of PEPFAR funds by implementing partners EXPENDITURE REPORTING On a quarterly basis (starting FY18 Q4), partners report their spending of PEPFAR dollars. Expenditure data are reported by implementing partners at the priority SNU level
2018 by Aaron Chafetz (USAID). • Reference Material • Jackson, S. (2016). Data Systems for Data Use (presentation). PEPFAR. • Jackson, S. (2016). PEPFAR Data Manage: Challenges and Solutions (presentation). PEPFAR. • PEPFAR. (2017). Data for Impact Fact Sheet. PEPFAR. www.pepfar.gov. • PEPFAR. (2018). MER Indicator Reference Guide (Version 2.3 FY19). PEPFAR. • Ryan, V. and K. Sato. (2016). Monitoring, Evaluation, and Reporting (MER) 1.0 (presentation). PEPFAR. • Schlenker, K. (2016). Understanding PEPFAR Data and Potential Use (presentation). PEPFAR. • Image Sources • Icons From the Noun Project: seed by Janina Aritao; seedling by Janina Aritao; Plant by Janina Aritao; Plant by Janina Aritao; Tree by Janina Aritao; tree with fruits by Janina Aritao; Table by IconMark; iPad by Made • Sasquatch icon. es.kisspng.com Notes and Attribution