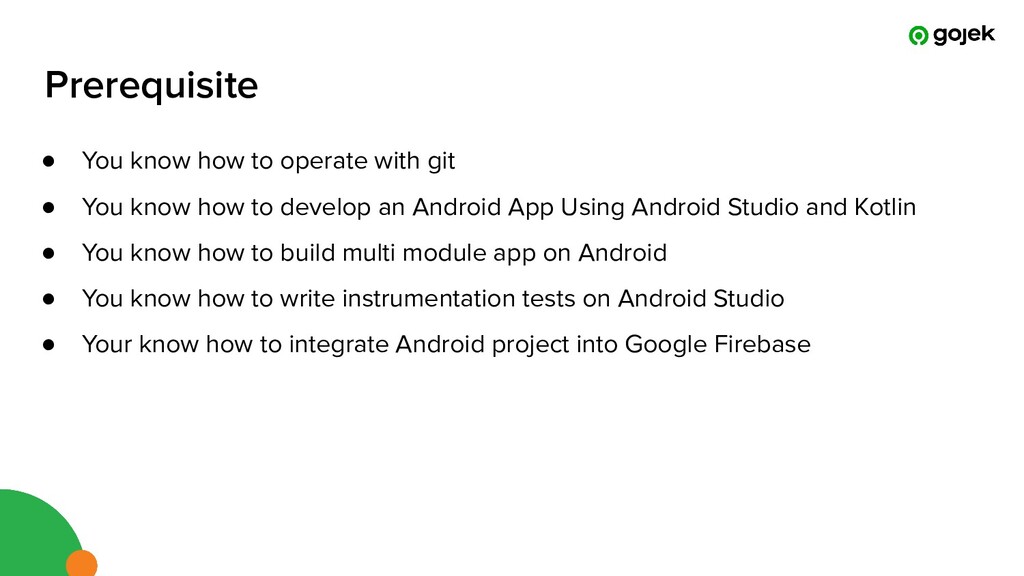
You know how to develop an Android App Using Android Studio and Kotlin • You know how to build multi module app on Android • You know how to write instrumentation tests on Android Studio • Your know how to integrate Android project into Google Firebase
of Android app code. It helps reduce measurement errors that are easy to do in general, and is integrated into Android Studio. It is standard JUnit instrumentation tests that run on an Android device, and use a rule provided by the library to perform the measuring and reporting.
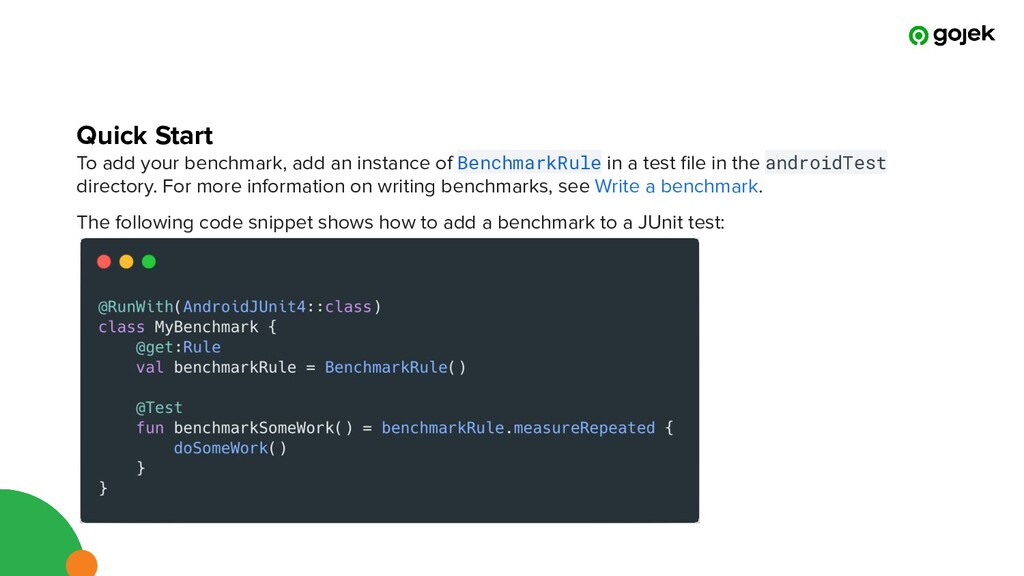
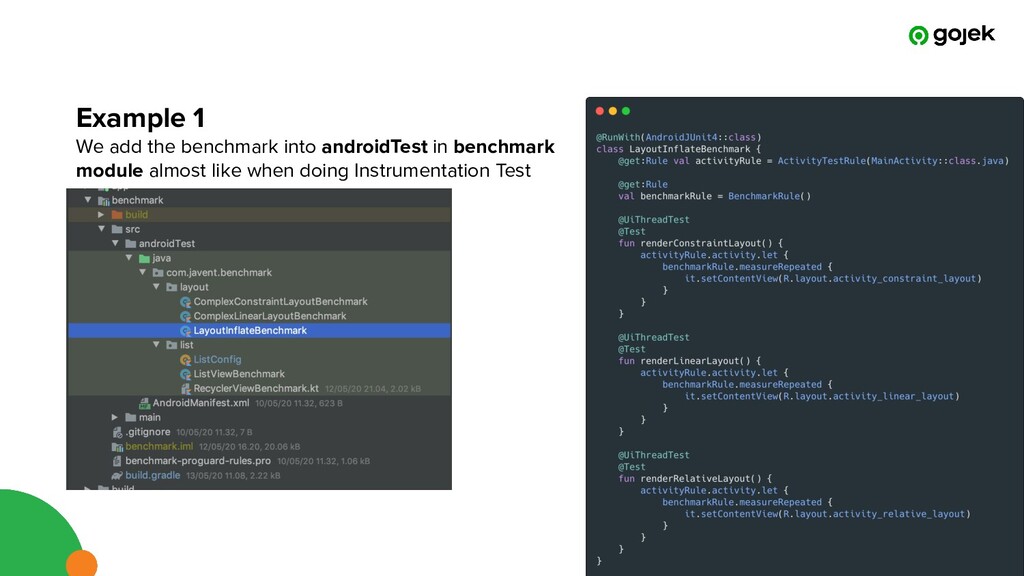
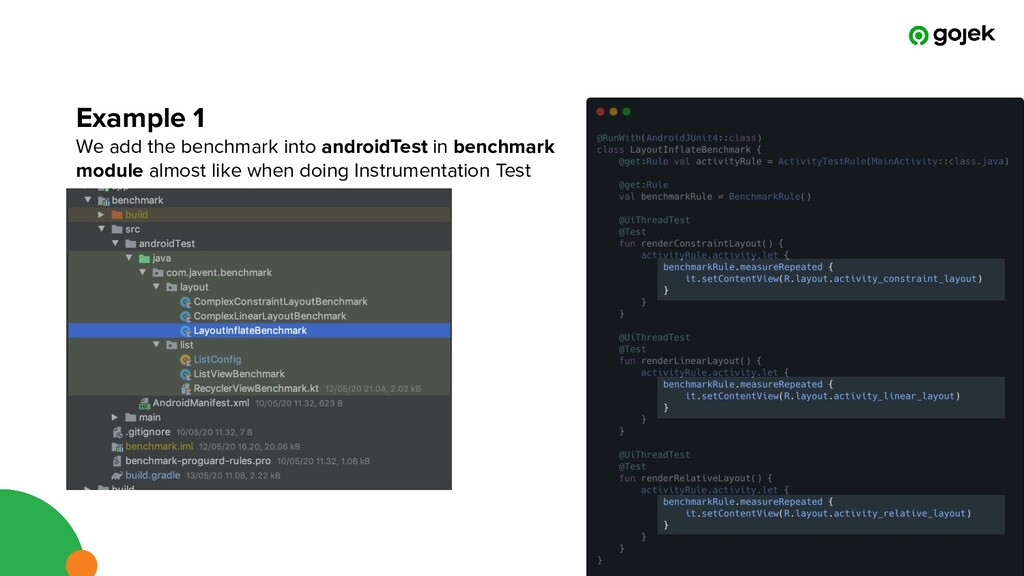
BenchmarkRule in a test file in the androidTest directory. For more information on writing benchmarks, see Write a benchmark. The following code snippet shows how to add a benchmark to a JUnit test:
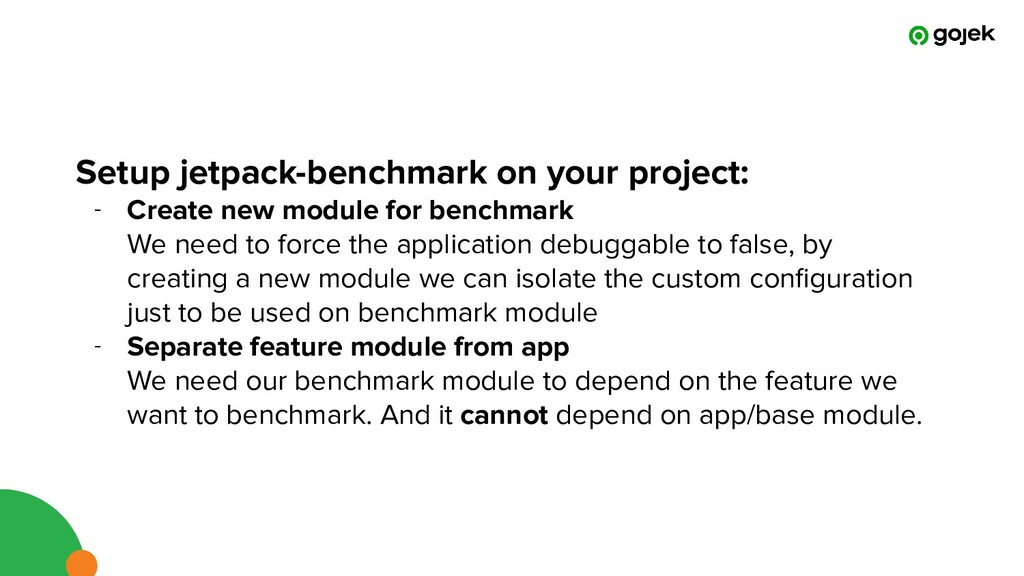
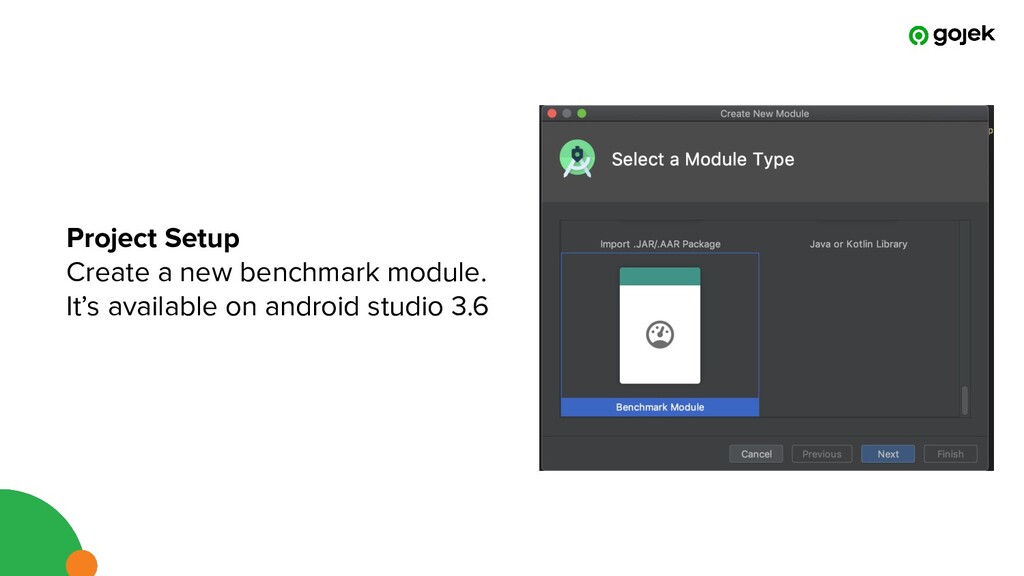
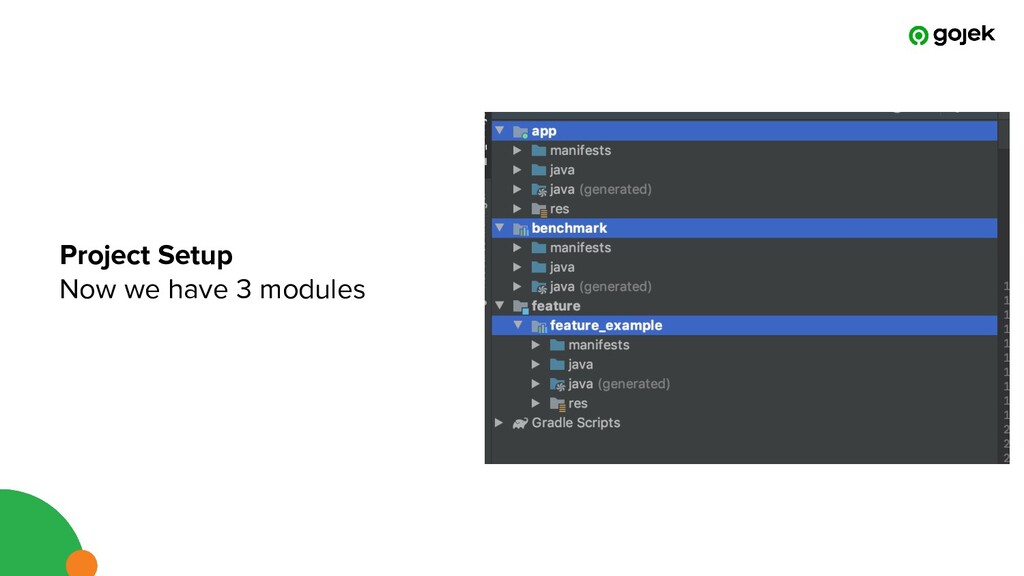
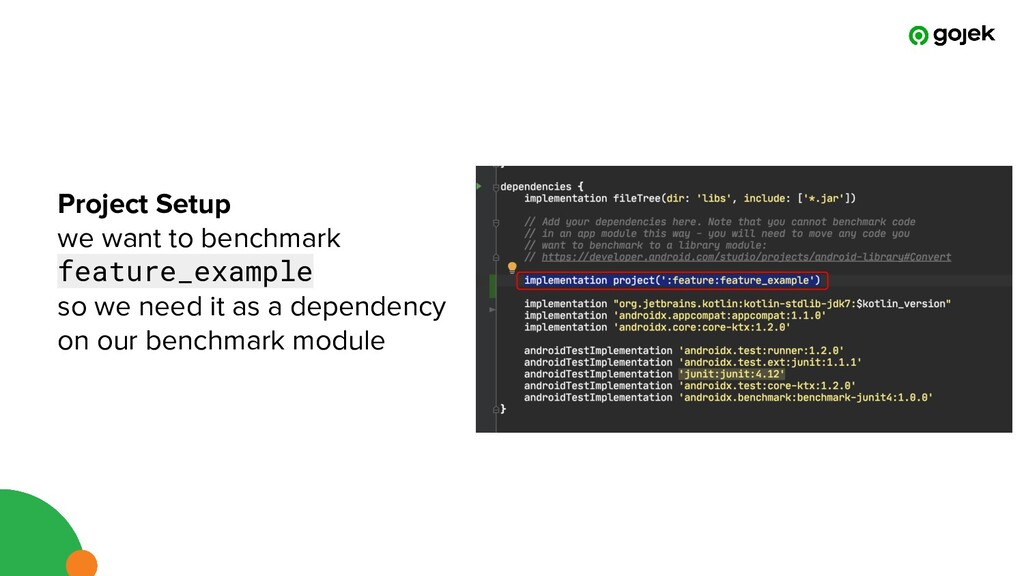
benchmark We need to force the application debuggable to false, by creating a new module we can isolate the custom configuration just to be used on benchmark module - Separate feature module from app We need our benchmark module to depend on the feature we want to benchmark. And it cannot depend on app/base module.
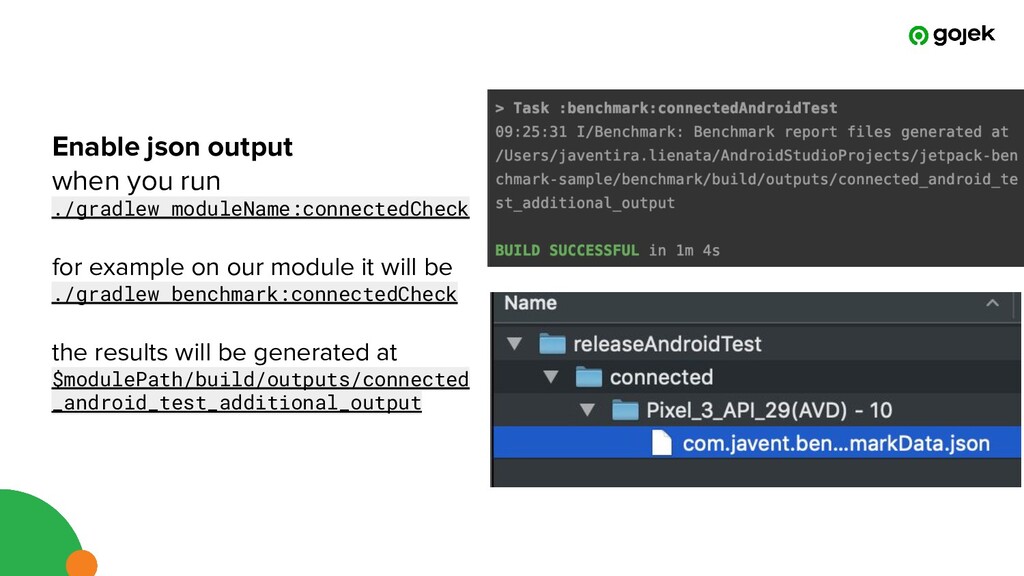
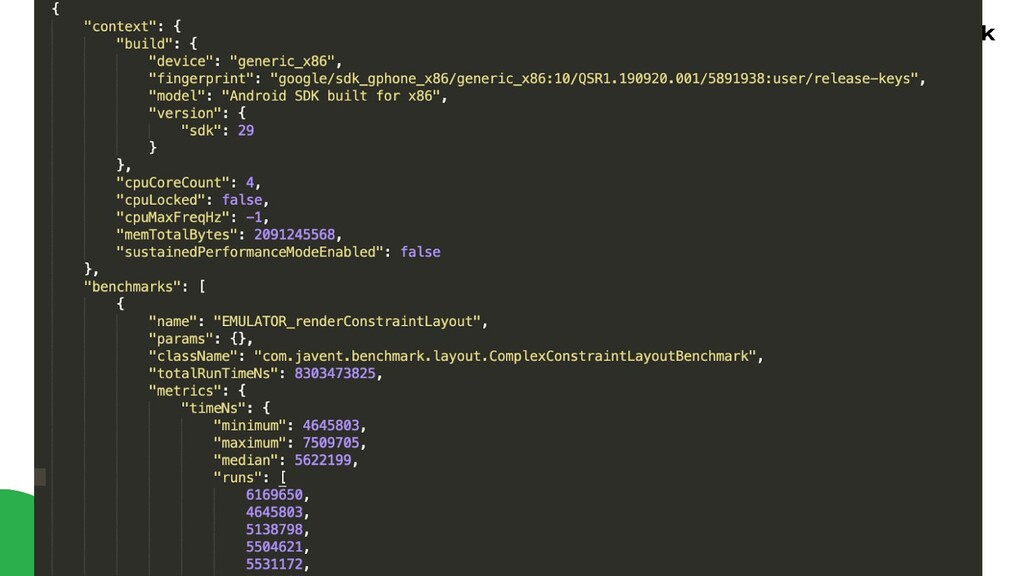
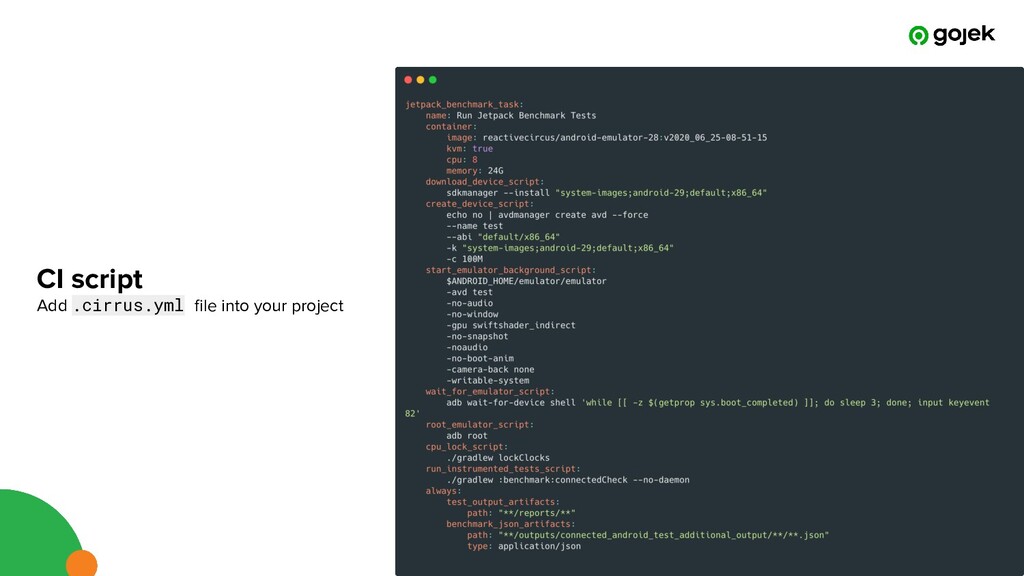
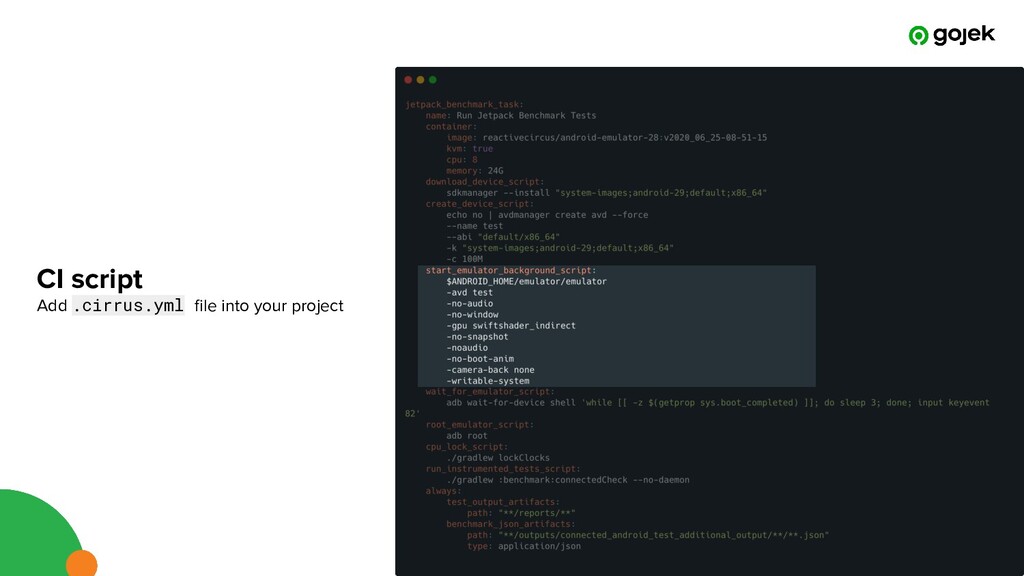
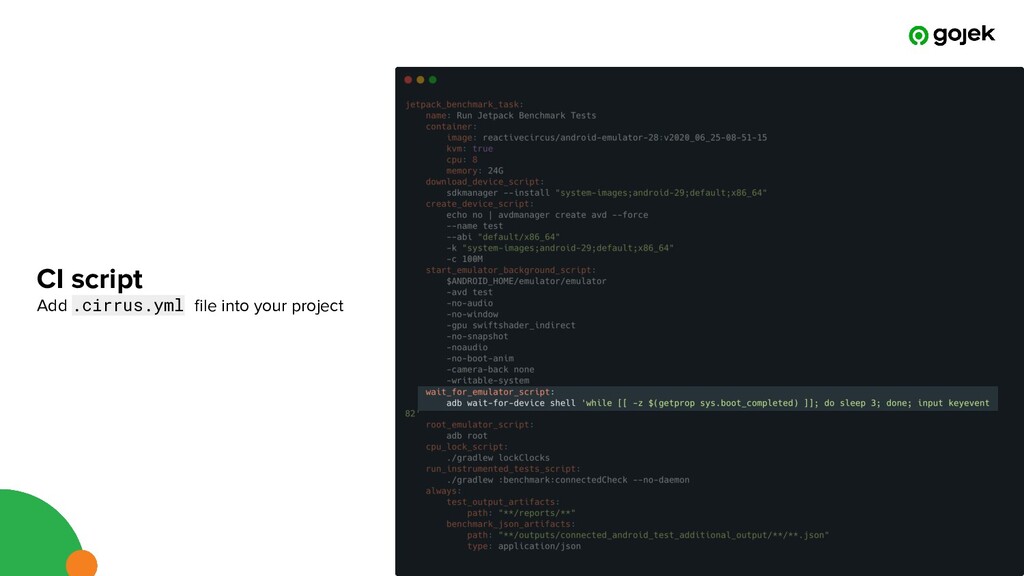
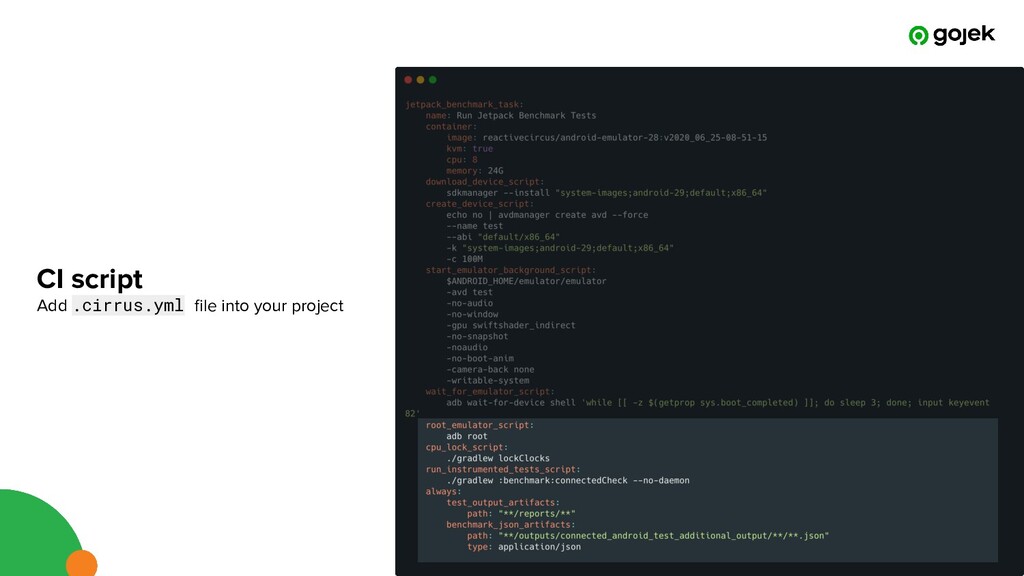
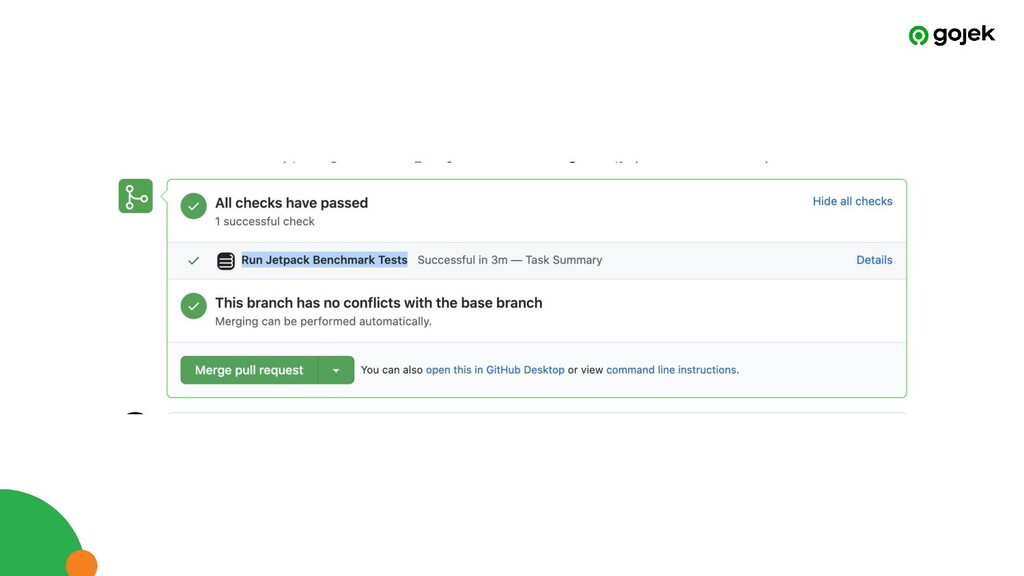
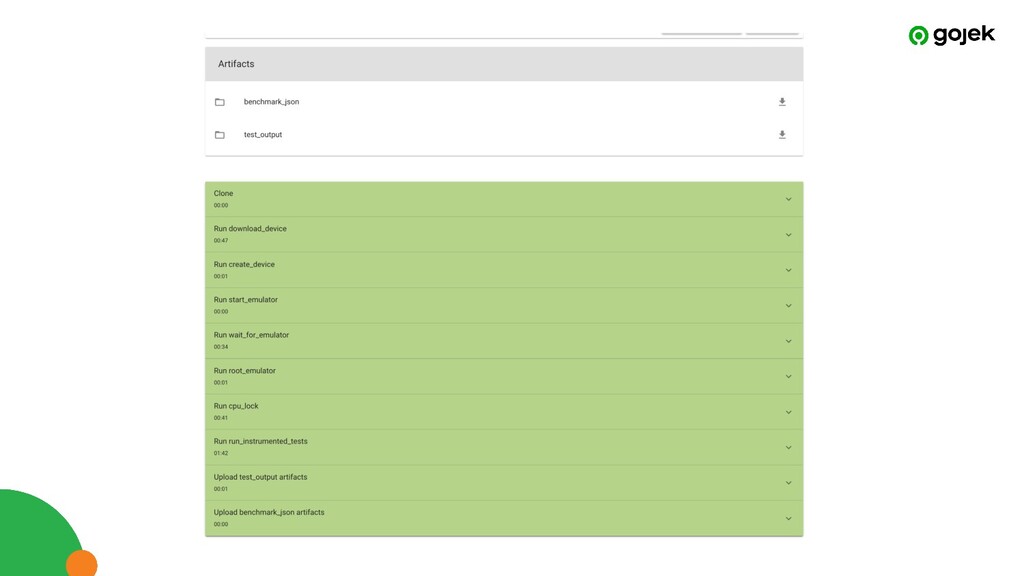
on our module it will be ./gradlew benchmark:connectedCheck the results will be generated at $modulePath/build/outputs/connected _android_test_additional_output
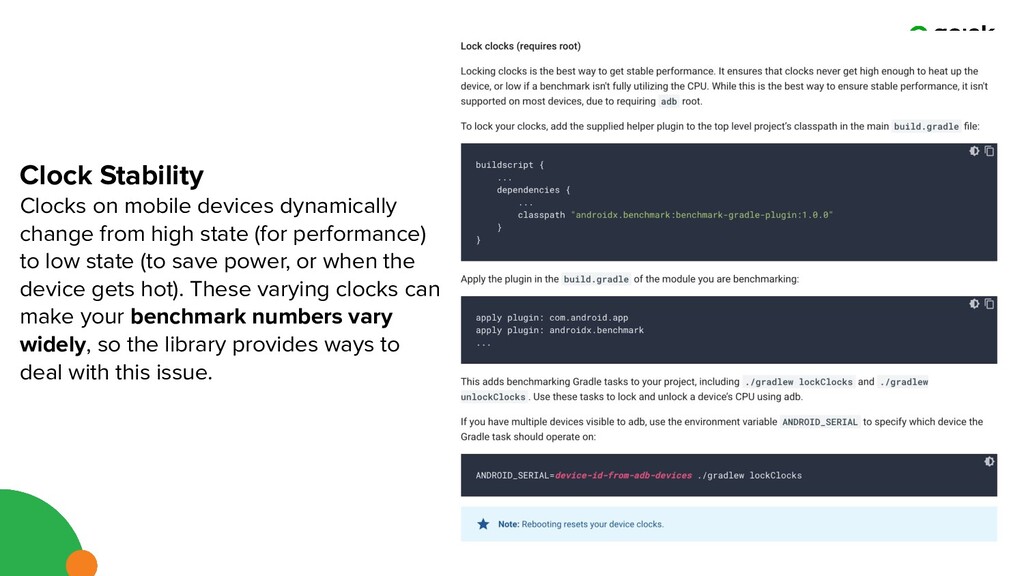
state (for performance) to low state (to save power, or when the device gets hot). These varying clocks can make your benchmark numbers vary widely, so the library provides ways to deal with this issue.
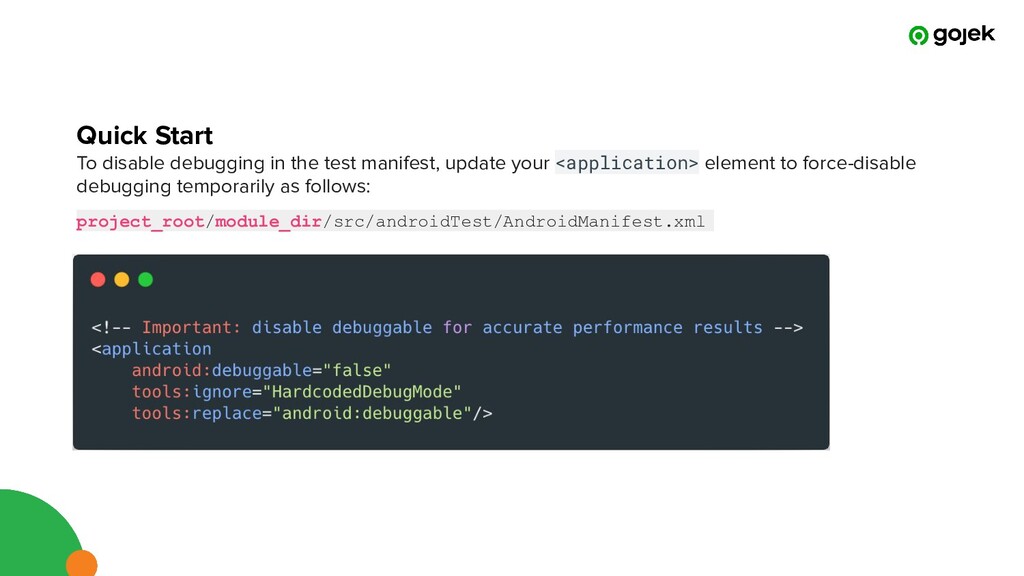
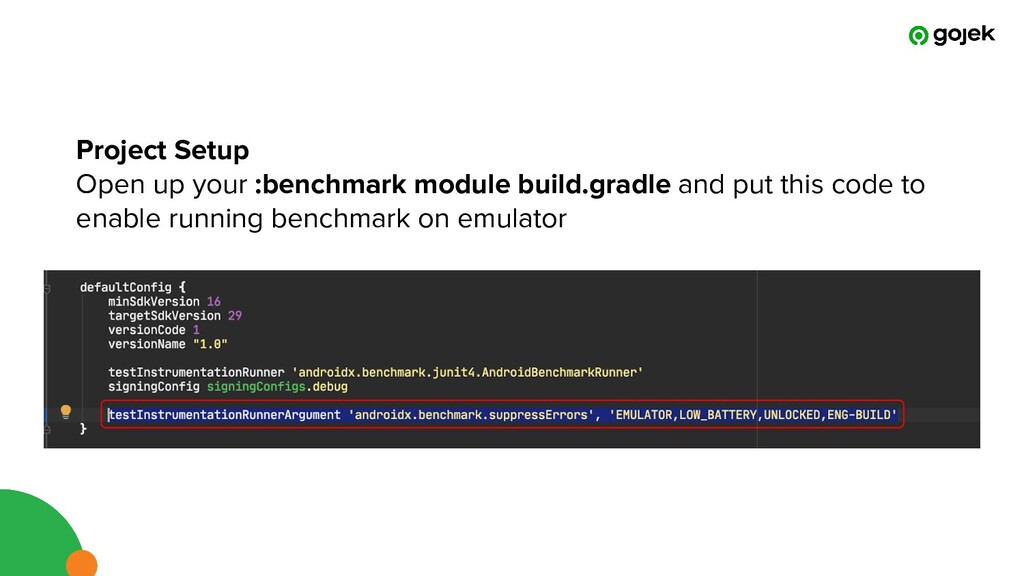
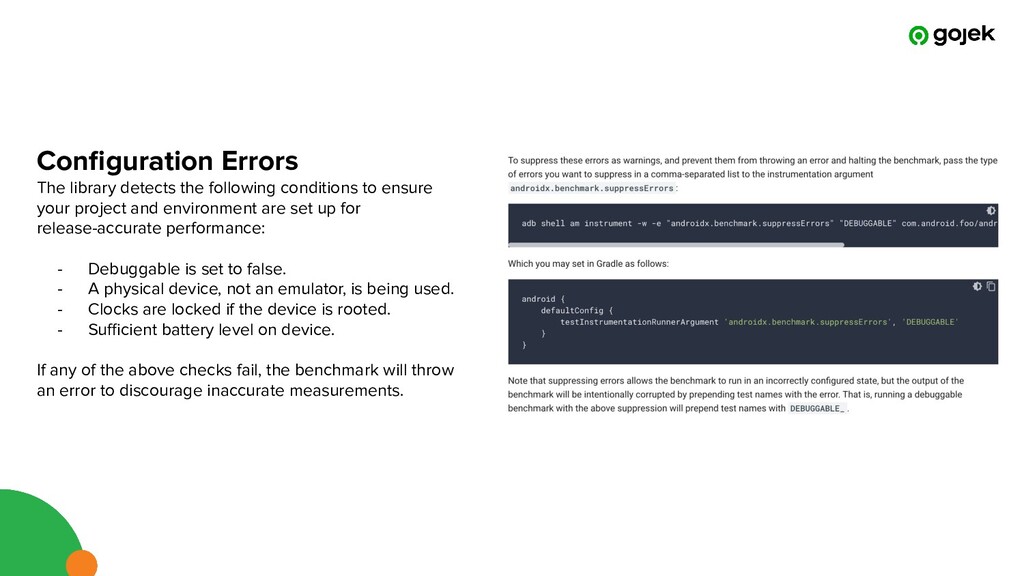
your project and environment are set up for release-accurate performance: - Debuggable is set to false. - A physical device, not an emulator, is being used. - Clocks are locked if the device is rooted. - Sufficient battery level on device. If any of the above checks fail, the benchmark will throw an error to discourage inaccurate measurements.
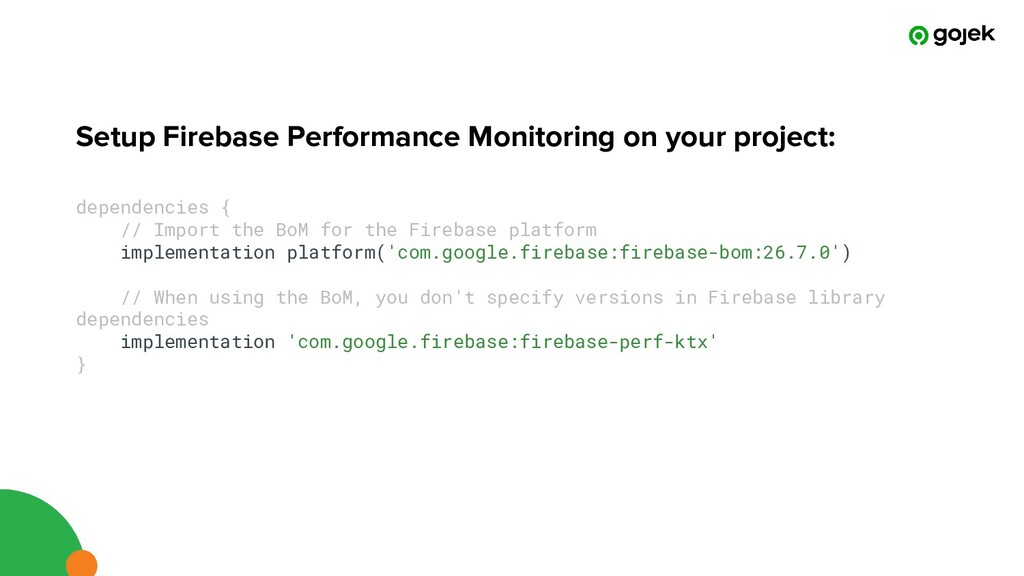
Import the BoM for the Firebase platform implementation platform('com.google.firebase:firebase-bom:26.7.0') // When using the BoM, you don't specify versions in Firebase library dependencies implementation 'com.google.firebase:firebase-perf-ktx' }
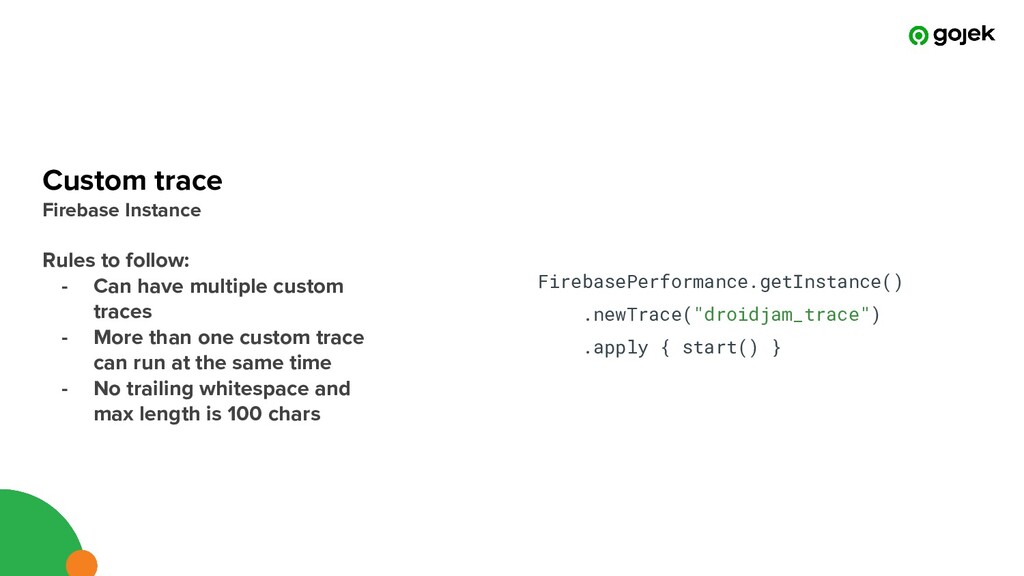
Rules to follow: - Can have multiple custom traces - More than one custom trace can run at the same time - No trailing whitespace and max length is 100 chars
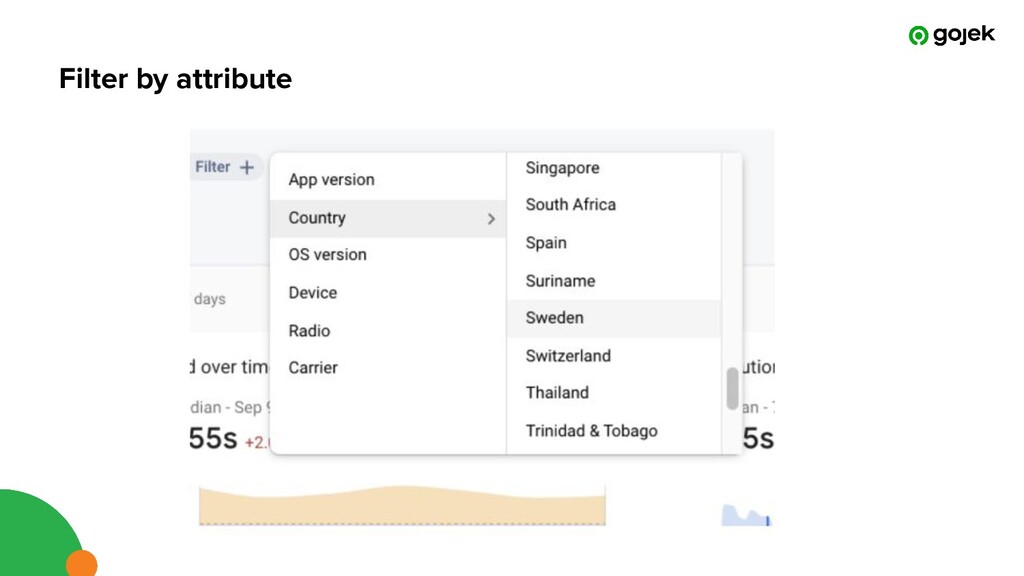
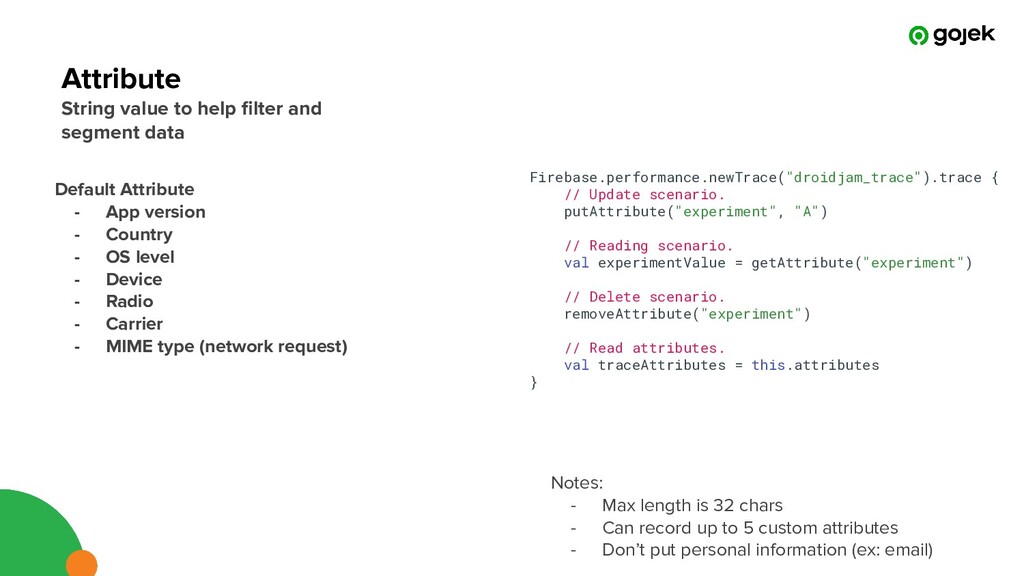
val experimentValue = getAttribute("experiment") // Delete scenario. removeAttribute("experiment") // Read attributes. val traceAttributes = this.attributes } Attribute String value to help filter and segment data Notes: - Max length is 32 chars - Can record up to 5 custom attributes - Don’t put personal information (ex: email) Default Attribute - App version - Country - OS level - Device - Radio - Carrier - MIME type (network request)
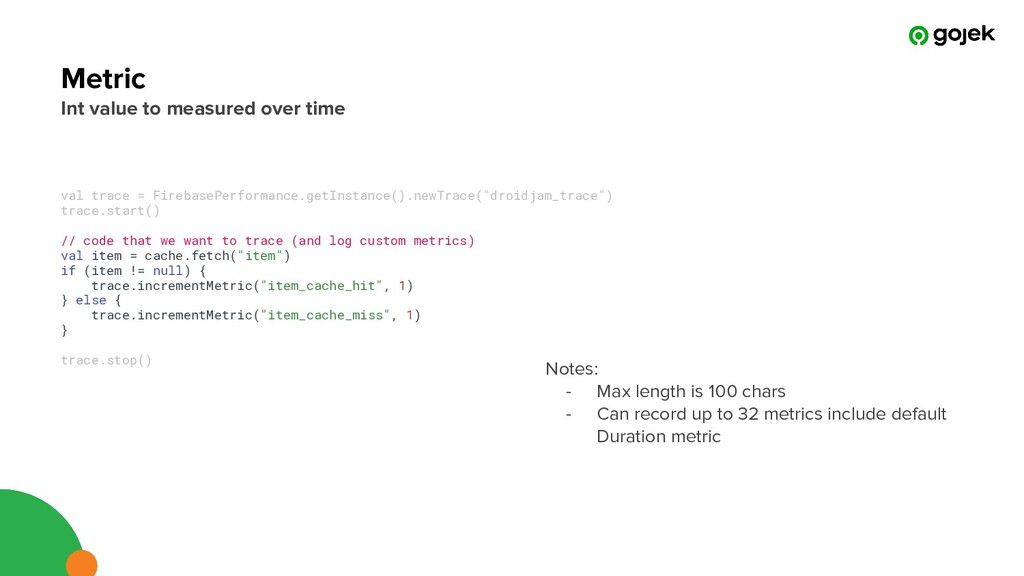
to trace (and log custom metrics) val item = cache.fetch("item") if (item != null) { trace.incrementMetric("item_cache_hit", 1) } else { trace.incrementMetric("item_cache_miss", 1) } trace.stop() Metric Int value to measured over time Notes: - Max length is 100 chars - Can record up to 32 metrics include default Duration metric
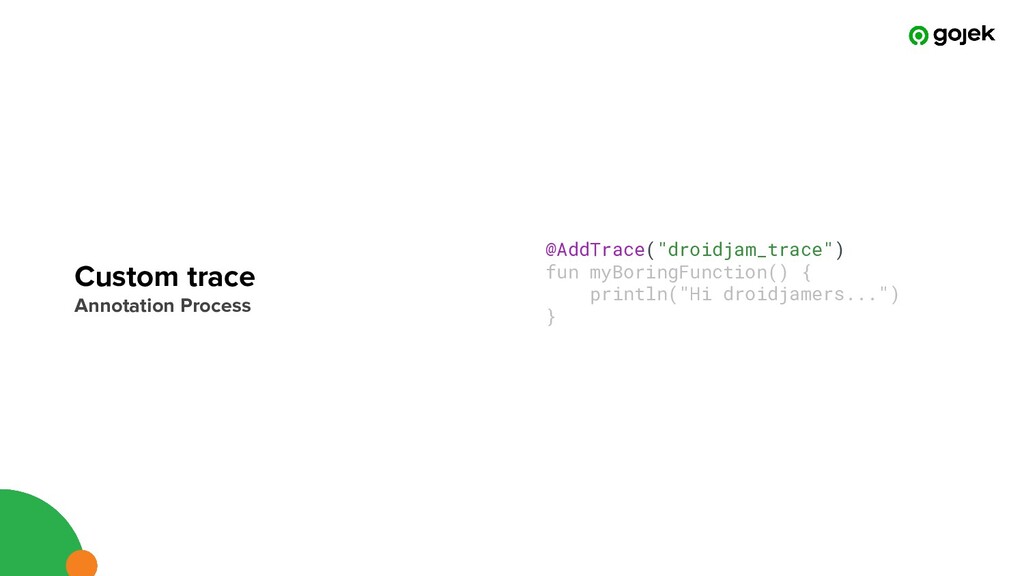
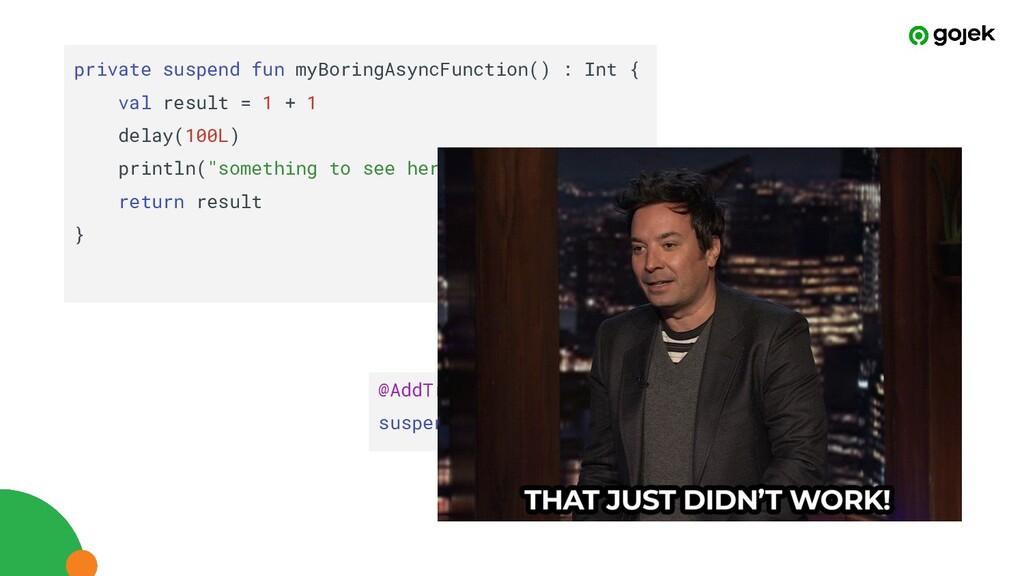
1 + 1 delay(100L) println("something to see here: $result") return result } @AddTrace("droidjam_trace") suspend fun myBoringAsyncFunction() : Int { ... }
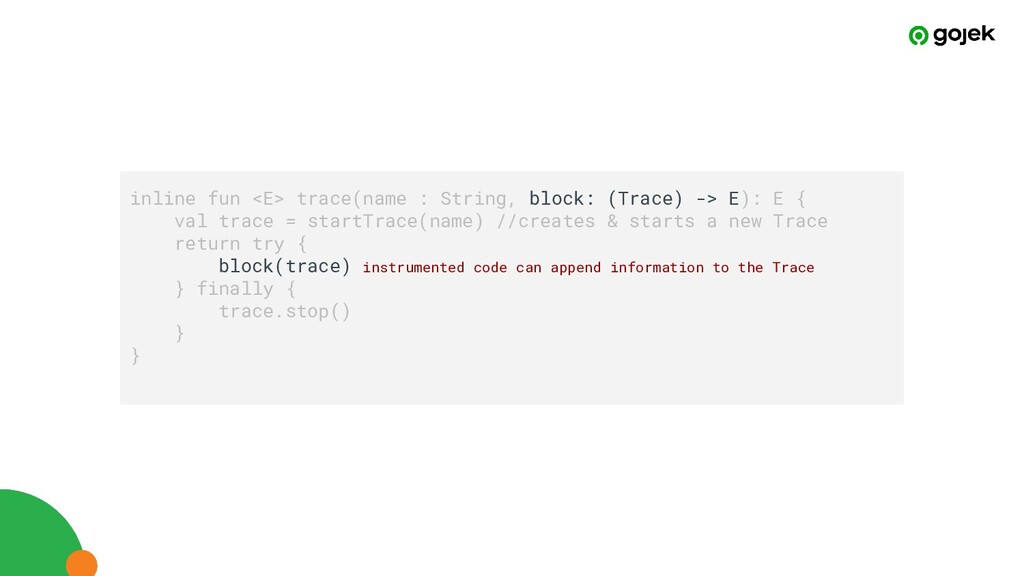
E { val trace = startTrace(name) //creates & starts a new Trace return try { block(trace) instrumented code can append information to the Trace } finally { trace.stop() } }
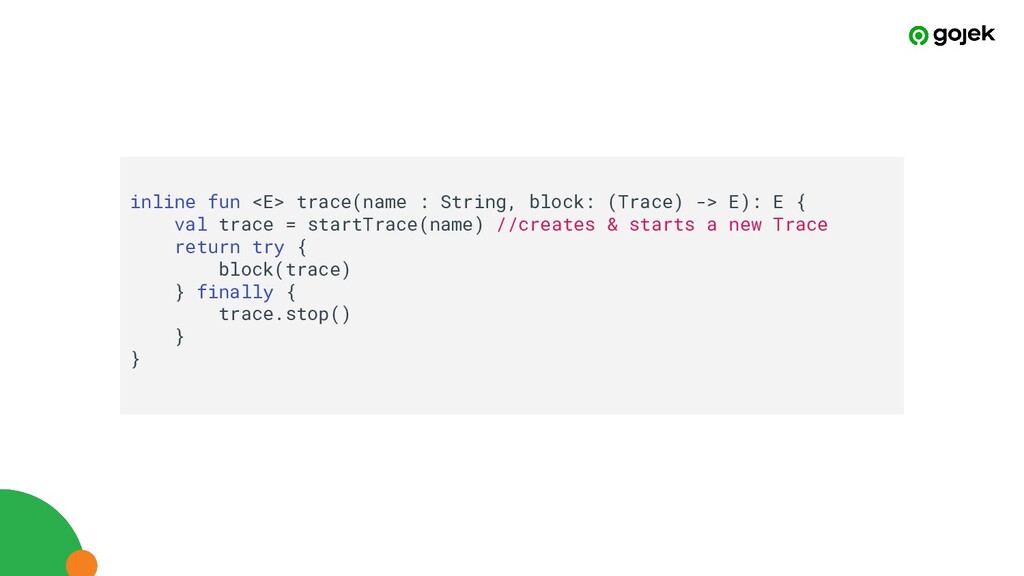
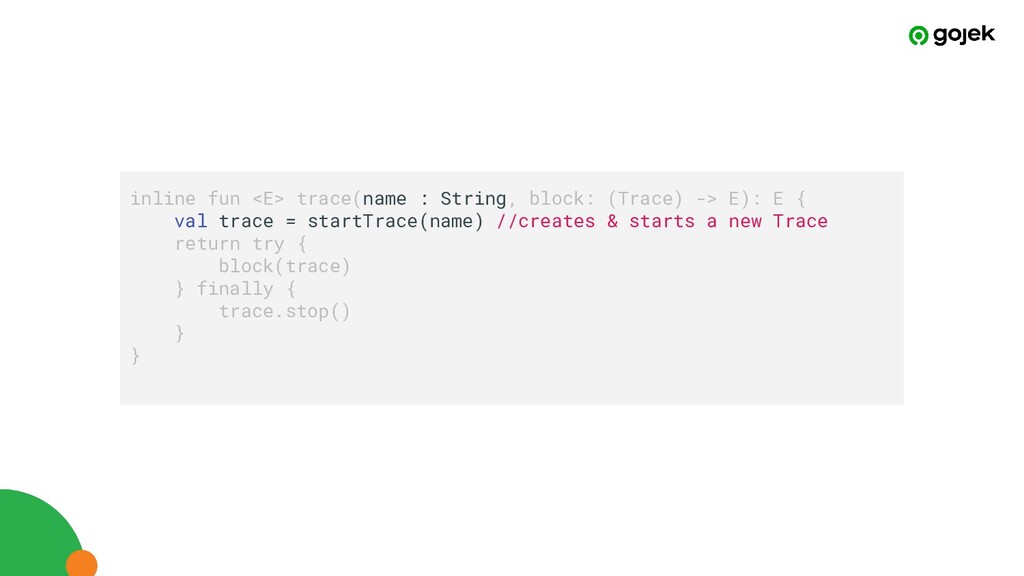
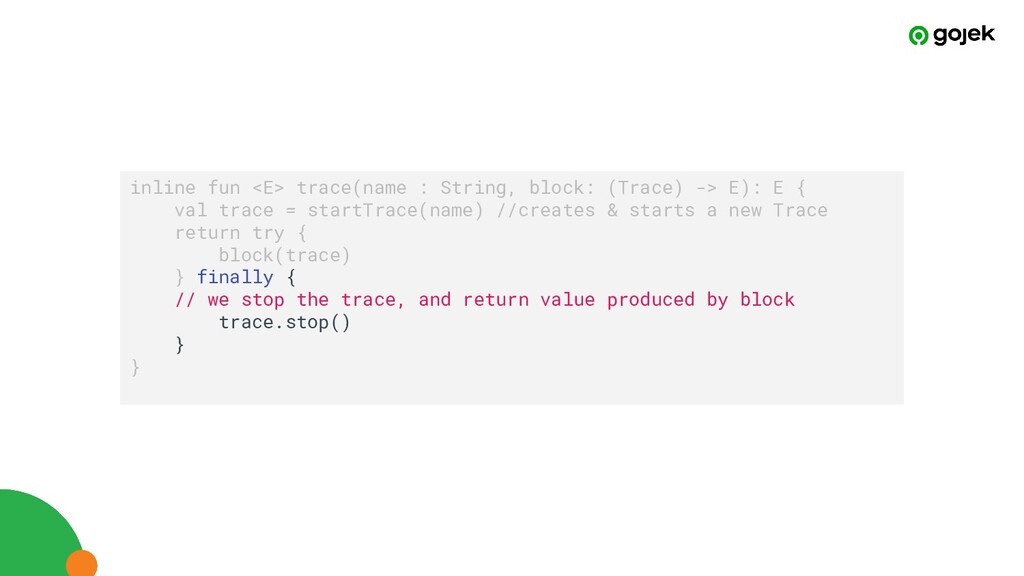
E { val trace = startTrace(name) //creates & starts a new Trace return try { block(trace) } finally { // we stop the trace, and return value produced by block trace.stop() } }
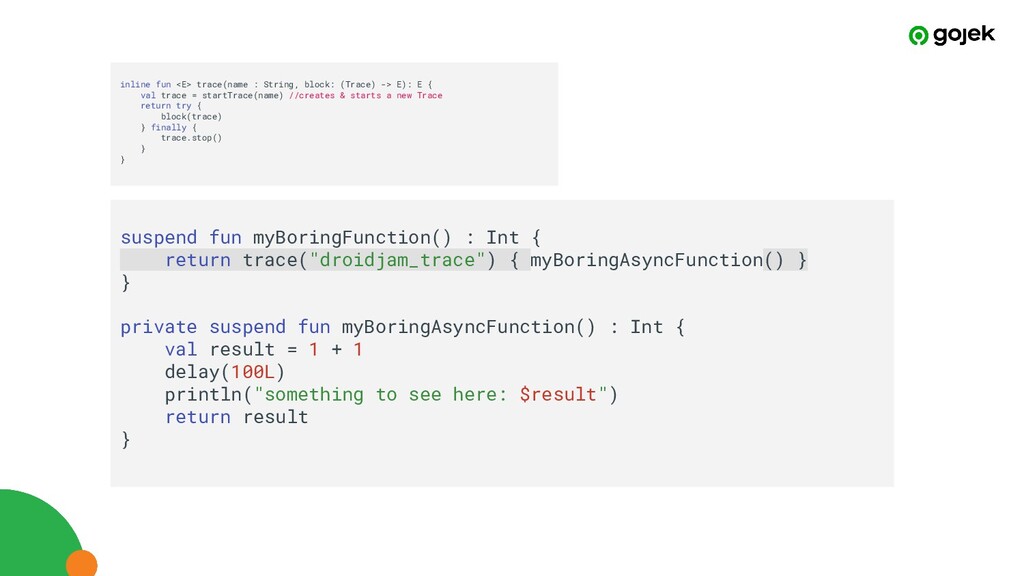
} } private suspend fun myBoringAsyncFunction() : Int { val result = 1 + 1 delay(100L) println("something to see here: $result") return result } inline fun <E> trace(name : String, block: (Trace) -> E): E { val trace = startTrace(name) //creates & starts a new Trace return try { block(trace) } finally { trace.stop() } }