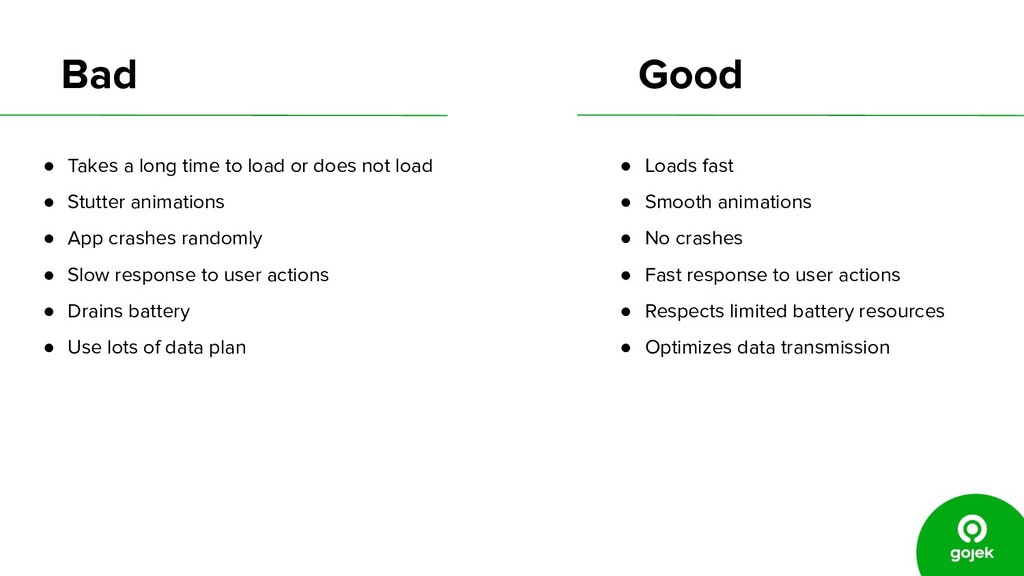
not load • Stutter animations • App crashes randomly • Slow response to user actions • Drains battery • Use lots of data plan Good • Loads fast • Smooth animations • No crashes • Fast response to user actions • Respects limited battery resources • Optimizes data transmission
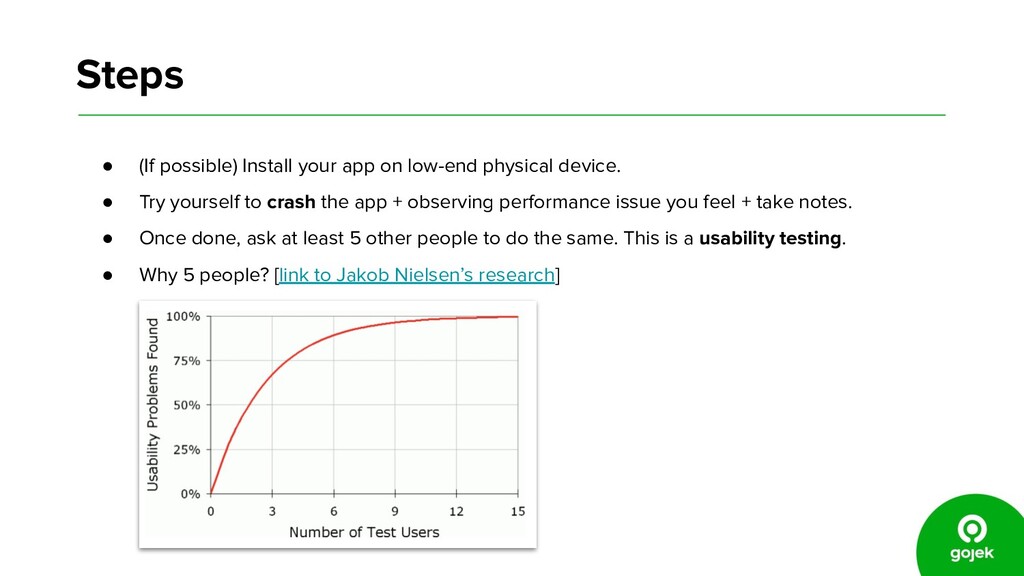
device. • Try yourself to crash the app + observing performance issue you feel + take notes. • Once done, ask at least 5 other people to do the same. This is a usability testing. • Why 5 people? [link to Jakob Nielsen’s research]
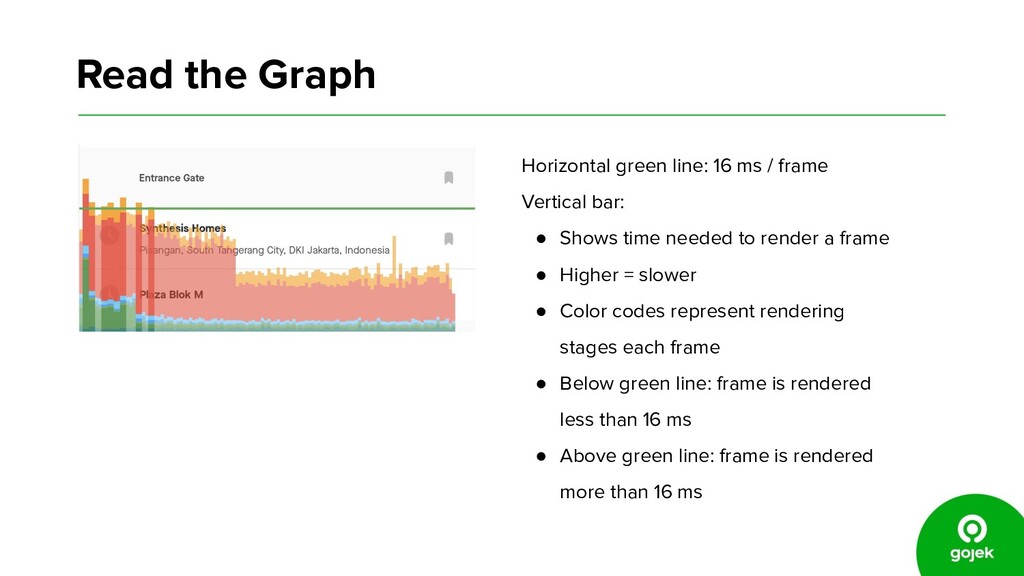
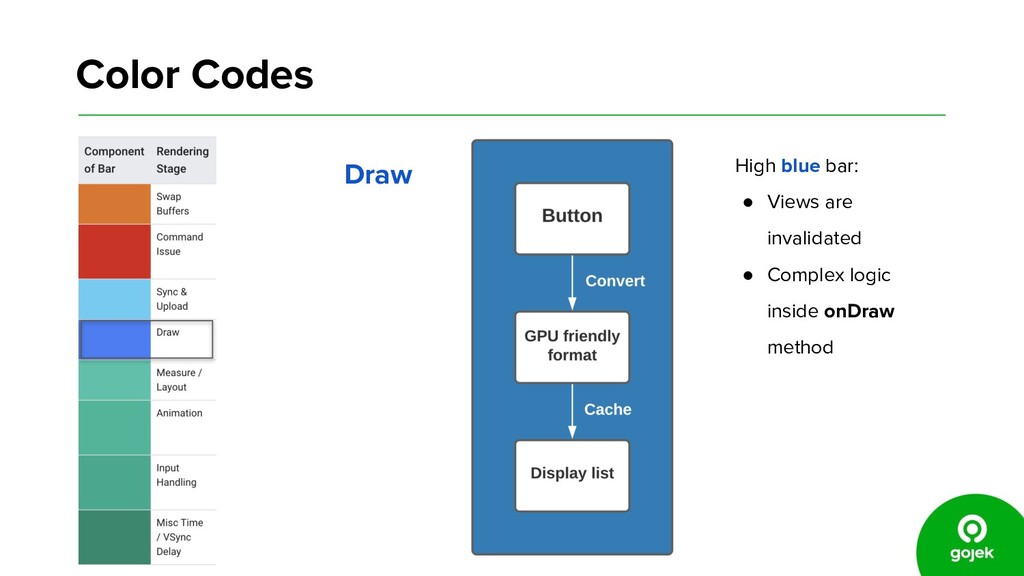
Vertical bar: • Shows time needed to render a frame • Higher = slower • Color codes represent rendering stages each frame • Below green line: frame is rendered less than 16 ms • Above green line: frame is rendered more than 16 ms
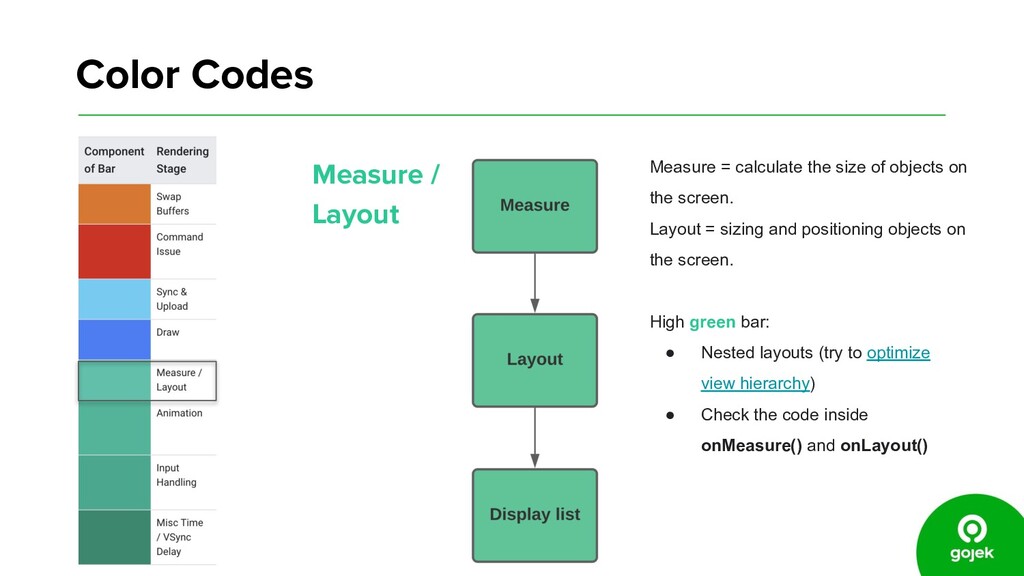
of objects on the screen. Layout = sizing and positioning objects on the screen. High green bar: • Nested layouts (try to optimize view hierarchy) • Check the code inside onMeasure() and onLayout()
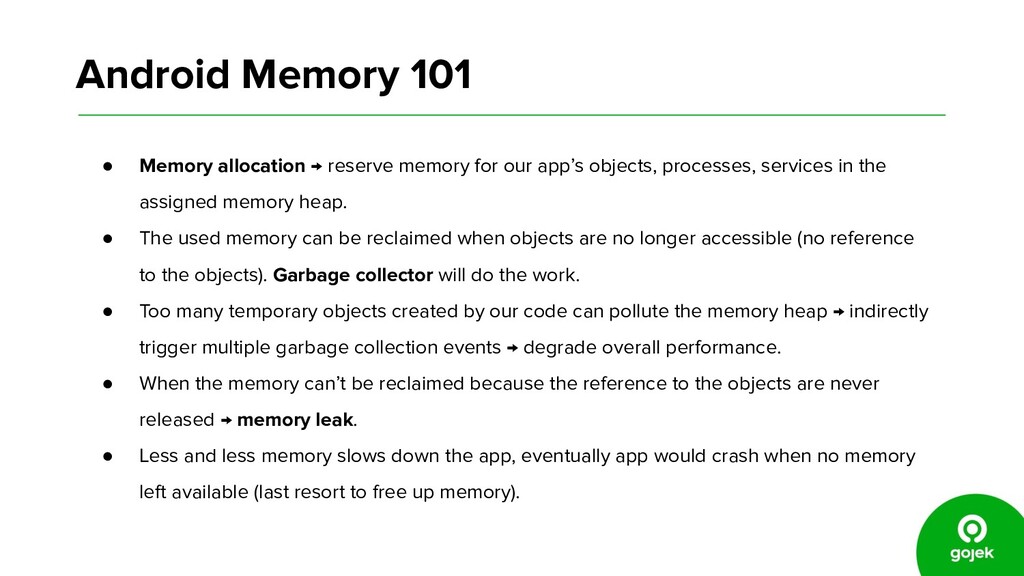
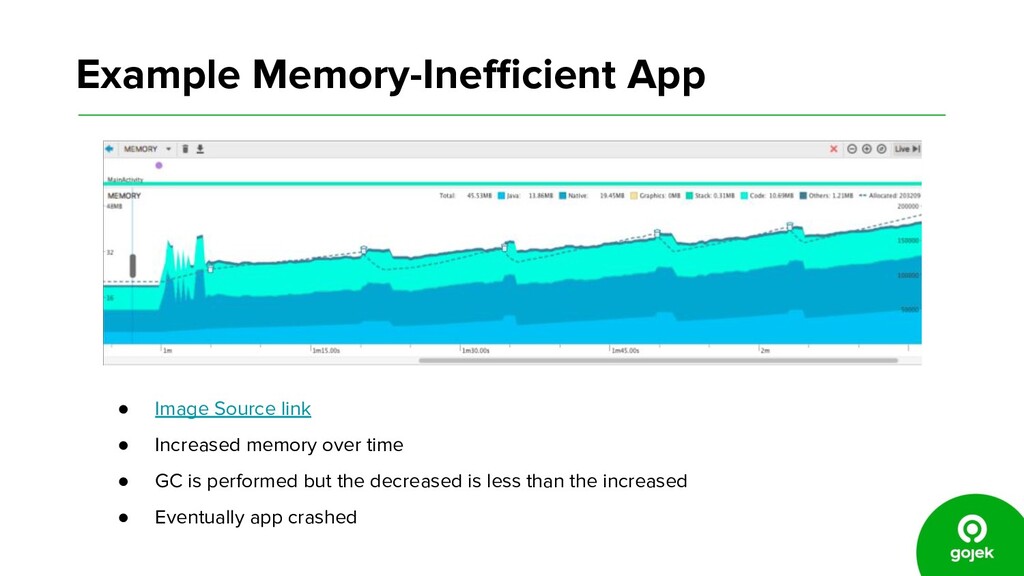
our app’s objects, processes, services in the assigned memory heap. • The used memory can be reclaimed when objects are no longer accessible (no reference to the objects). Garbage collector will do the work. • Too many temporary objects created by our code can pollute the memory heap → indirectly trigger multiple garbage collection events → degrade overall performance. • When the memory can’t be reclaimed because the reference to the objects are never released → memory leak. • Less and less memory slows down the app, eventually app would crash when no memory left available (last resort to free up memory).
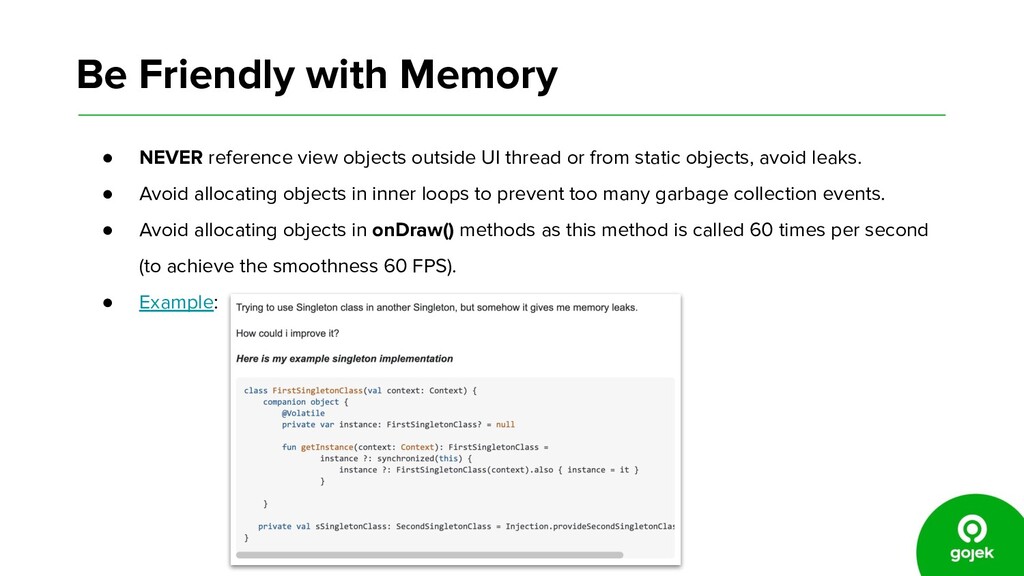
UI thread or from static objects, avoid leaks. • Avoid allocating objects in inner loops to prevent too many garbage collection events. • Avoid allocating objects in onDraw() methods as this method is called 60 times per second (to achieve the smoothness 60 FPS). • Example:
specific point in time. • Allocations: number of instance of that class in memory. • Shallow Size: total size of all instances of that class. • Retained Size: its shallow size plus the shallow sizes of the objects that are accessible from that class.
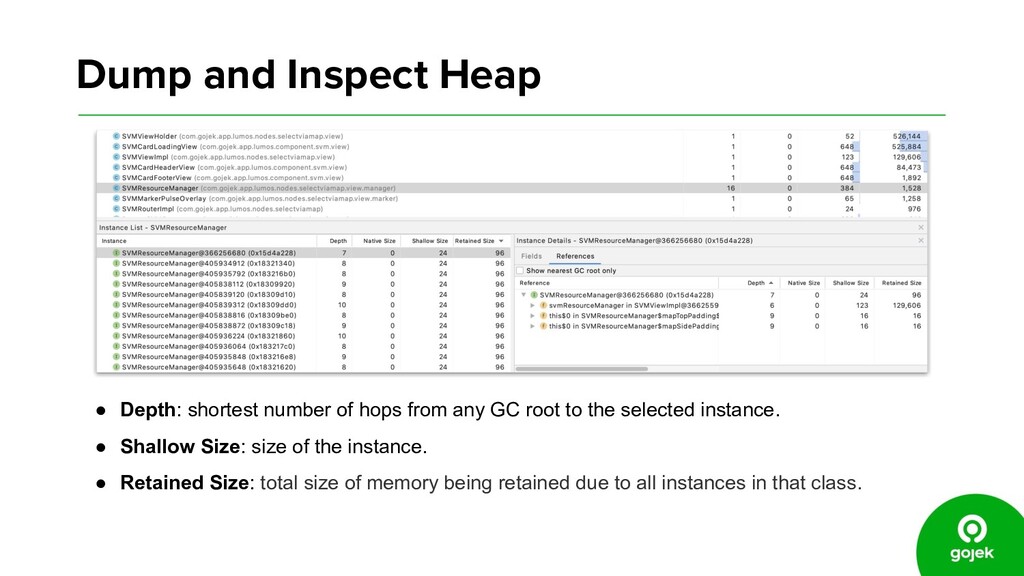
from any GC root to the selected instance. • Shallow Size: size of the instance. • Retained Size: total size of memory being retained due to all instances in that class.
be initialised because user may not need it at runtime. • Lazy initialization can be a solution. • Only create instance of views that user really needs to see.
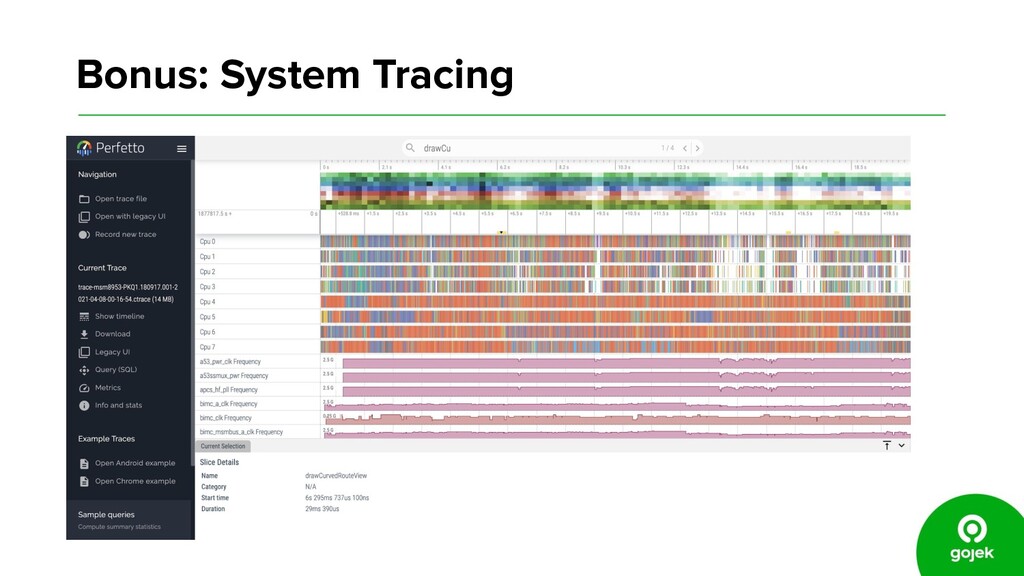
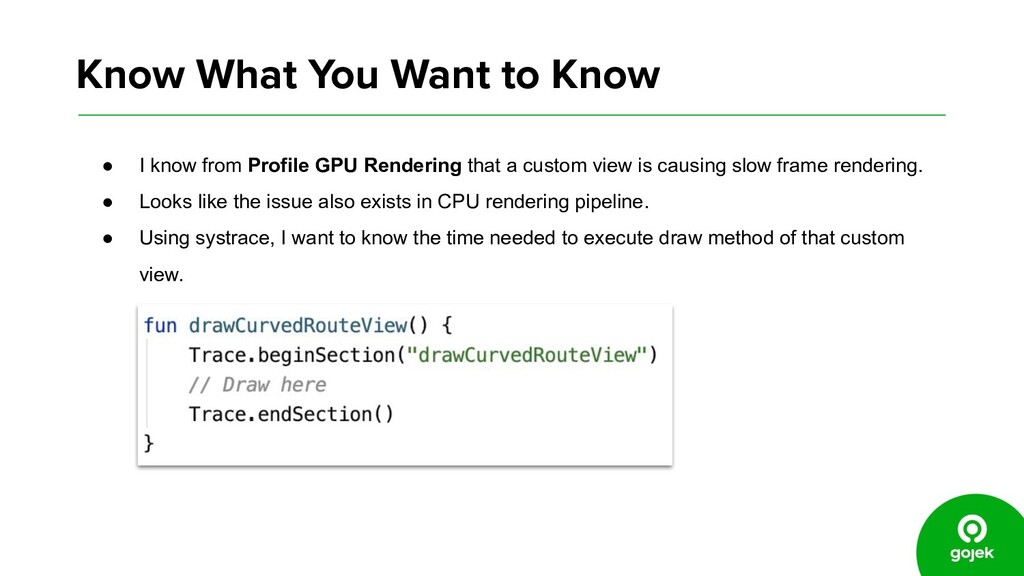
Profile GPU Rendering that a custom view is causing slow frame rendering. • Looks like the issue also exists in CPU rendering pipeline. • Using systrace, I want to know the time needed to execute draw method of that custom view.