Upgrade to PRO for Only $50/Year—Limited-Time Offer! 🔥

Team Thermometer

Team Thermometer

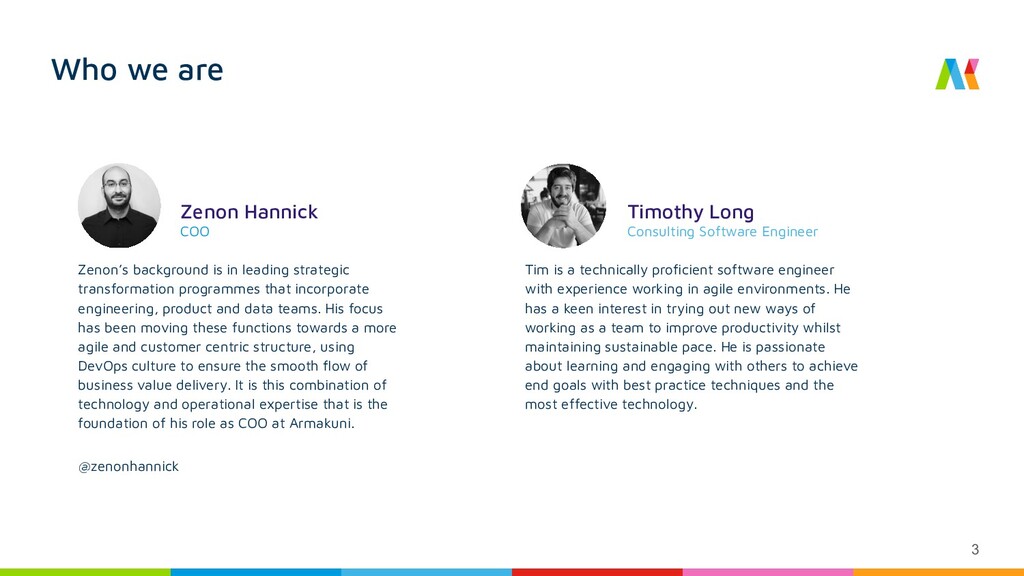
Zenon Hannick (COO) and Tim Long (Consultant Engineer) - Armakuni

'Team Thermometer'
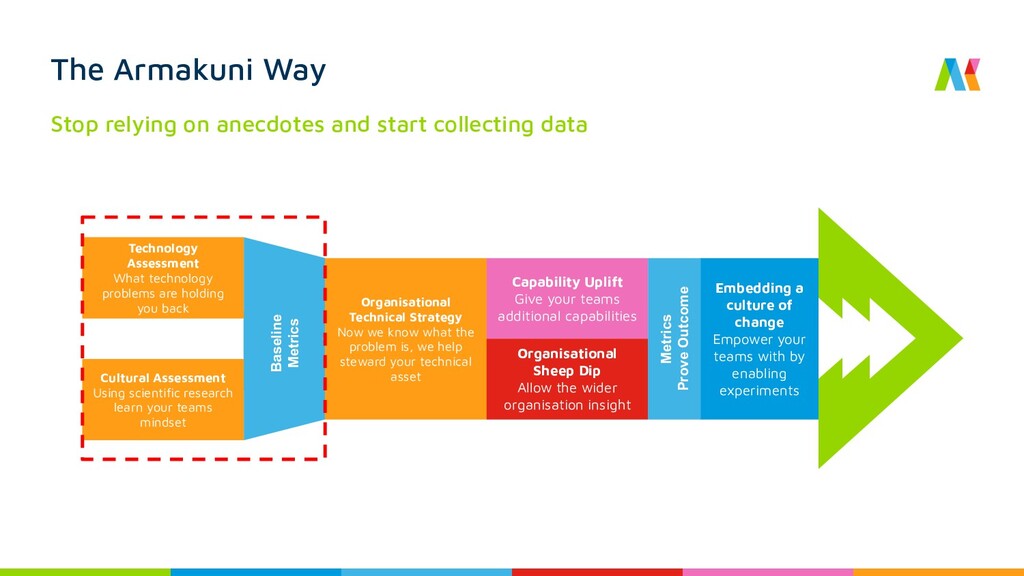
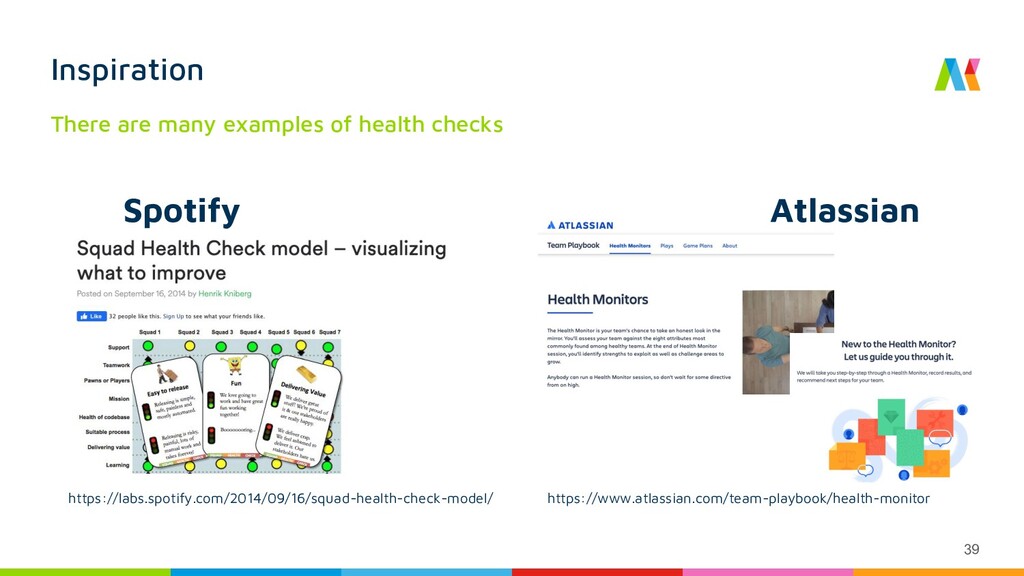
We want to give away our trade secrets, and teach you have to spot problems in your teams early and learn to address them.

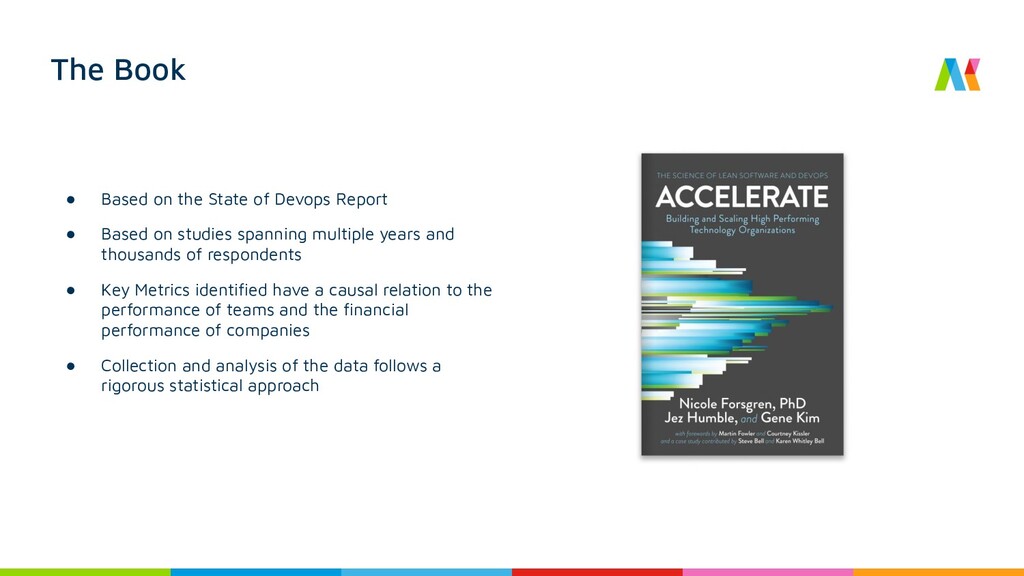
Backed up by scientific research, we will talk about a few of the techniques we use to assess teams and how they are functioning.

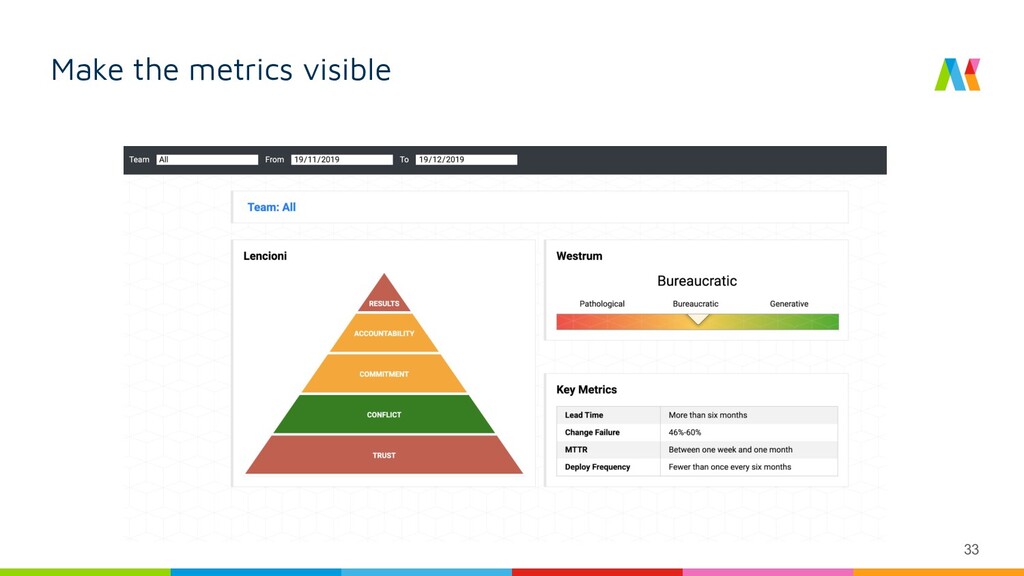
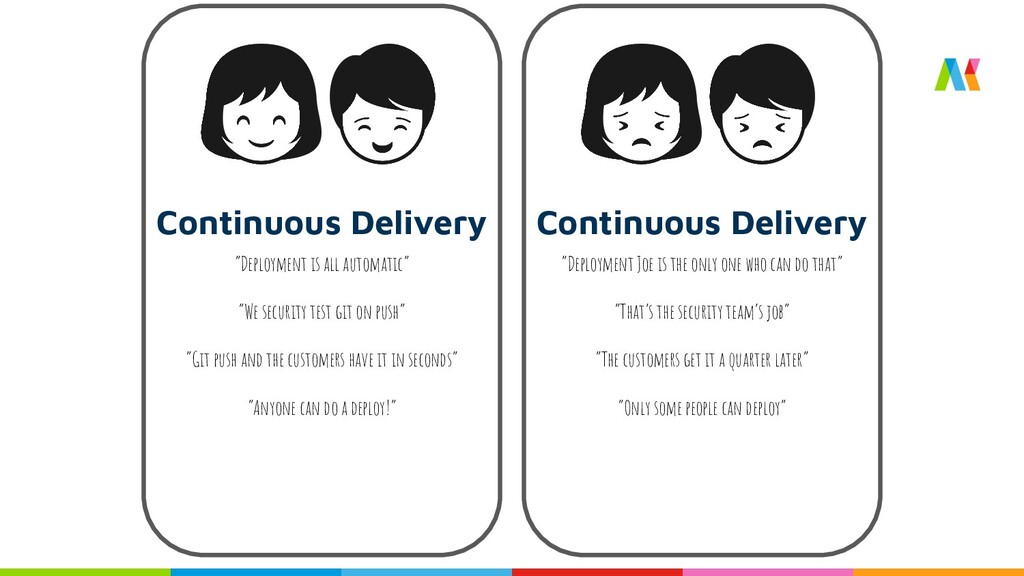
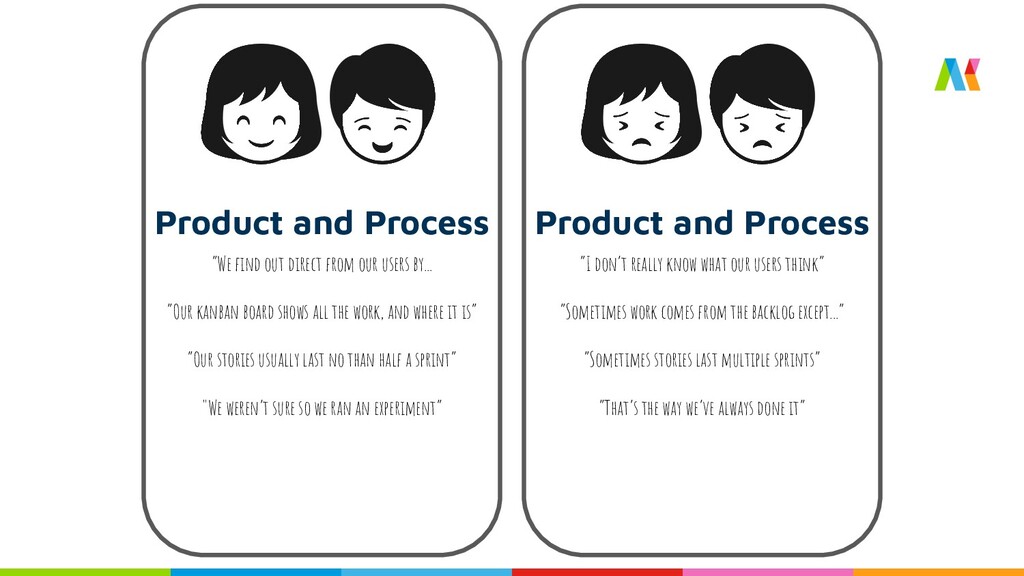
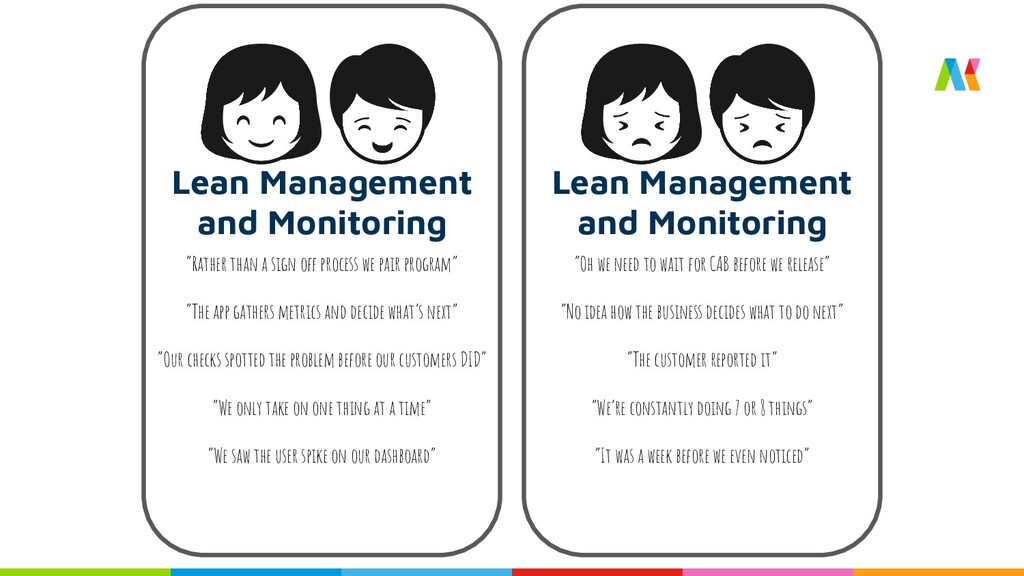
We will trial a couple of the techniques, show you how we visualise the results of our assessments, and ultimately how you can use these to start conversations and optimise your team's performance.

Agile Scotland March 2020

Avatar for Agile Scotland

Agile Scotland

March 06, 2020
Tweet

More Decks by Agile Scotland

Other Decks in Technology

Transcript

  1. Who we are Zenon Hannick COO Zenon’s background is in

    leading strategic transformation programmes that incorporate engineering, product and data teams. His focus has been moving these functions towards a more agile and customer centric structure, using DevOps culture to ensure the smooth flow of business value delivery. It is this combination of technology and operational expertise that is the foundation of his role as COO at Armakuni. @zenonhannick 3 Timothy Long Consulting Software Engineer Tim is a technically proficient software engineer with experience working in agile environments. He has a keen interest in trying out new ways of working as a team to improve productivity whilst maintaining sustainable pace. He is passionate about learning and engaging with others to achieve end goals with best practice techniques and the most effective technology.
  2. What’s the real state of play? 4 Sometimes messages can

    get mixed as they get reported through a chain of people, and just like a watermelon, it can be green on the outside (management meeting), and red on the inside (the daily standup). In an business it’s a bit more serious than at breakfast. Without clear feedback loops it’s not possible to make effective change. We can help you make the intangible tangible, and measure not only features delivered, but culture and capabilities as well. Have you heard of Watermelon Reporting?
  3. The Armakuni Way Stop relying on anecdotes and start collecting

    data Technology Assessment What technology problems are holding you back Cultural Assessment Using scientific research learn your teams mindset Organisational Technical Strategy Now we know what the problem is, we help steward your technical asset Capability Uplift Give your teams additional capabilities Organisational Sheep Dip Allow the wider organisation insight Embedding a culture of change Empower your teams with by enabling experiments Baseline Metrics Metrics Prove Outcome
  4. What we will take you through Content • AWKSS •

    Westrum • 4 Key metrics (Accelerate) • Lencioni’s 5 dysfunctions of a team • Team health check • Extra bits
  5. What are you hoping to learn? What do you want

    out of the session? • Write it on a post it and stick it on the wall
  6. Awareness Is this thing on my radar? Have I heard

    of it? Willing Given what I know about it right now, is it something that I am willing to try or use? Or am I disregarding it completely already? Knowledge Am I a novice, or an expert that people could approach for help? Skills Do I have the skills required to do this? Support Do I feel I have a support network to assist me with this? Will my team/organisation be open to me using this? If I required further training, would it be made available?
  7. 13 Westrum Typology • Created by Ron Westrum in 2004

    • Categorises organisations in terms of how their culture affects safety and performance • 3 categories in the Westrum model: Pathological, Bureaucratic and Generative • Predicts how an organisation will react in a crisis
  8. 14 Westrum Typology Work out how your organisation will cope

    in a crisis Pathological (power-oriented) Bureaucratic (rule-oriented) Generative (performance-oriented) Low co-operation Modest co-operation High co-operation Messengers shot Messengers neglected Messengers trained Responsibilities shirked Narrow responsibilities Risks are shared Bridging discouraged Bridging tolerated Bridging encouraged Failure leads to scapegoating Failure leads to justice Failure leads to enquiry Novelty crushed Novelty leads to problems Novelty implemented 1) Westrum, Ron. (2005). A Typology of Organisational Cultures. Quality & safety in health care. 13 Suppl 2. ii22-7. 10.1136/qhc.13.suppl_2.ii22.
  9. 15 Encapsulation Suppression Public Relations Local Fix Global fix Inquiry

    Suppression - Harming or stopping the person bringing the anomaly to light; “shooting the messenger” Encapsulation - Isolating the messenger, so that the message is not heard Public relations - Putting the message “in context” to minimise its impact Local fix - Responding to the presenting case, but ignoring the possibility of others elsewhere Global fix - An attempt to respond to the problem wherever it exists. Common in aviation Inquiry - Attempting to get to the “root causes” of the problem 1) Westrum, Ron. (2005). A Typology of Organisational Cultures. Quality & safety in health care. 13 Suppl 2. ii22-7. 10.1136/qhc.13.suppl_2.ii22. Westrum Typology A Prediction of crisis response
  10. Facilitator Notes Ask them to rate on a scale of

    1 to 7: • Information is actively sought. • Responsibilities are shared. • Cross-functional collaboration is encouraged or rewarded. • Failure causes enquiry. • New ideas are welcomed. • Failures are treated primarily as opportunities to improve the system. Information classification: Internal 17 Using this for a team
  11. Facilitator Notes Where 1 to 7 means: 1. Strongly Disagree

    2. Disagree 3. Somewhat Disagree 4. Neither Agree nor Disagree 5. Somewhat Agree 6. Agree 7. Strongly Agree Information classification: Internal 18 Using this for a team
  12. 19 Westrum Typology Pathological (power-oriented) Bureaucratic (rule-oriented) Generative (performance-oriented) 1)

    Westrum, Ron. (2005). A Typology of Organisational Cultures. Quality & safety in health care. 13 Suppl 2. ii22-7. 10.1136/qhc.13.suppl_2.ii22. 1 2 3 4 5 6 7 Add up all those scores and take the average. Where the average falls on this diagram shows where the department is.
  13. Facilitator Notes This is primarily useful as a discussion point,

    and to set expectations of what people can achieve change wise. In order to move the needle on this Ron Westrum says we have to fire the boss. Now that’s not practical (for most of us). Thankfully some research from Nicole Forsgren says we can also become more generative by implementing DevOps practices. Information classification: Internal 20 What can I do with this result
  14. Facilitator Notes With this you can predict how the people

    around this team will interact with your intervention with the team. • Pathological cultures will try to shut you down • Bureaucratic cultures will try to manage you • Generative cultures will embrace you You will see these behaviours in the interactions with people that you see in the team. Information classification: Internal 21 Predicting responses
  15. A Pathological Response Who broke the build?! An investigation is

    done to identify who caused the build to fail. When they have been identified they are instructed to fix it ASAP. An investigation is held to find out if any external teams or customers were affected by the failure. The developer at fault is told to write up how they caused the build to fail. The developer is told to be more careful, and is now required to get his work reviewed by two more senior developers before it can be released.
  16. A Bureaucratic Response Who broke the build?! An investigation is

    done to identify who caused the build to fail. When they have been identified they are instructed to fix it ASAP. A more senior member of the team investigates the build failure to find out its cause, and whether any requirements on the build checklist had failed to have been carried out. The developer who caused the failure is informed of their mistake, and a new rule/requirements is put into place that must be passed before a new build can be triggered.
  17. A Generative Response Down tools! The priority is for the

    team to fix the broken build. All current development work stops until the build is green again. At the end of the current iteration, the team have a blameless post-mortem. They discuss what led to the build becoming broken and what the best plan of action might be to prevent it from breaking again. The team shared lessons learned with other teams and they are built in to other teams’ pipelines and processes.
  18. The Book • Based on the State of Devops Report

    • Based on studies spanning multiple years and thousands of respondents • Key Metrics identified have a causal relation to the performance of teams and the financial performance of companies • Collection and analysis of the data follows a rigorous statistical approach
  19. 28 DevOps Metrics Measuring a team’s performance Lead Time for

    change e.g. 1 day Deployment Frequency E.g. a couple of times a day Mean Time to Recovery e.g. 7 Hours Change Failure Percentage e.g. 20% It is important to be able to measure at all levels of an organisation. These allow us to view individual team performance With this baselined we can begin to experiment!
  20. Lencioni RESULTS ACCOUNTABILITY COMMITMENT CONFLICT TRUST To take Accountability takes

    prior Commitment Focus on delivering measurable Results. Collective and individual accountability, and feedback Commitment follows healthy conflict Healthy Conflict implies Candid Debate Building Trust requires Vulnerability Five Behaviors of a Cohesive Team
  21. 31 Lencioni model The Five Dysfunctions of a Team Work

    out each team’s unique strengths and areas for improvement. RESULTS COMMITMENT CONFLICT TRUST ACCOUNTABILITY
  22. Project Aristotle • Started by Google in 2012 • Study

    covered hundreds of teams • Lots of Patterns but none of them fit easily • Not what they did but how they felt? • ‘‘equality in distribution of conversational turn-taking.’’ How can you build the perfect team?
  23. 38 Team Health Check Code Quality Code Quality “Absolutely everything

    is in source control” “We automatically test on every commit” “There’s only really the master branch” “I can add as many or as few examples as I need” “It’s in source control except...” “We manually have a look” “Our branches are around forever” “...but the data wasn’t like that on prod” Surface issues from teams directly Rapidly identify areas to improve
  24. 39 Inspiration There are many examples of health checks Spotify

    https://labs.spotify.com/2014/09/16/squad-health-check-model/ https://www.atlassian.com/team-playbook/health-monitor Atlassian
  25. Code Quality Code Quality “Absolutely everything is in source control”

    “We automatically test on every commit” “There’s only really the master branch” “I can add as many or as few examples as I need” “It’s in source control except...” “We manually have a look” “We follow git flow” “...but the data wasn’t like that on prod”
  26. Continuous Delivery Continuous Delivery “Deployment is all automatic” “We security

    test git on push” “Git push and the customers have it in seconds” “Anyone can do a deploy!” “Deployment Joe is the only one who can do that” “That’s the security team’s job” “The customers get it a quarter later” “Only some people can deploy”
  27. Architecture Architecture “We can deploy any bit alone” “Just our

    team maintains this” “We never break backwards compatibility” "We chose our own tools” “We can’t deploy this alone” “Our team and Team X work on this” “Accidentally, we broke our clients code” “We had to use what they told us”
  28. Product and Process Product and Process “We find out direct

    from our users by... “Our kanban board shows all the work, and where it is” “Our stories usually last no than half a sprint” "We weren’t sure so we ran an experiment” “I don’t really know what our users think” “Sometimes work comes from the backlog except...” “Sometimes stories last multiple sprints” “That’s the way we’ve always done it”
  29. Lean Management and Monitoring Lean Management and Monitoring “Rather than

    a sign off process we pair program” “The app gathers metrics and decide what’s next” “Our checks spotted the problem before our customers DID” “We only take on one thing at a time” “We saw the user spike on our dashboard” “Oh we need to wait for CAB before we release” “No idea how the business decides what to do next” “The customer reported it” “We’re constantly doing 7 or 8 things” “It was a week before we even noticed”
  30. Lean Management and Monitoring Product and Process Architecture Continuous Delivery

    Code Quality Date: 30/02/2020 Date:_______ Date:_______ Date:_______ Watch your team’s journey through time
  31. Content Content “was relevant and interesting” “Sparked lots of ideas”

    “Relevant to the conference and my work” “THE NARRATIVE WORKED” “was dull” “did not seem relevant” “was not clear” “Was confusing”
  32. Slides Slides “...were clear and concise” “memorable” “...HELPED DRIVE THE

    NARRATIVE” “WILL BE USEFUL AFTER THE WORKSHOP” “too wordy” “NOT CLEAR ” “UNRELATED TO THE NARRATIVE” “SUPERFLUOUS”
  33. Delivery Delivery “engaging” “Energetic and fun” “I was on the

    edge of my seat” “I laughed a lot” “I tuned out ” “I struggled to stay focused” “Delivery was very monotone” “SUPERFLUOUS”
  34. Interactivity Interactivity “I loved working with others” “Very interactive” “I

    loved the back of the class elements” “Exercises were energising” “Exercises did not make sense” “Too much powerpoint” “Structure did not work” “Too much front of the class”
  35. I learned I learned “Lots of new things” “Sharing knowledge

    and experiences was great” “I loved learning together” “nothing” “It was boring” “I didn’t get anything out of it”
  36. I learned Interactivity Delivery Slides Content Date: 06/03/2020 Date:_______ Date:_______

    Date:_______ Watch this workshop’s journey through time
  37. 54 Workshop suite Stakeholder Mapping Service Blueprint Value Stream Mapping

    Identify flow blockers, and communication problems
  38. 55 Stakeholder Mapping Influence Interest Dev Joe AWS Ash Sam

    Amy Build up a map of who to work with Engage with the people who matter
  39. 57 Value Stream Mapping Identify pain points with teams Prioritise

    work accordingly Deliver value more smoothly LT: 14D PT: 4H C&A: 60% AR: 4% LT: 2D PT: 5M C&A: 50% AR: 0.6% LT: 14D PT: 8D C&A: 90% AR: 57% LT: 1D PT: 3.5H C&A: 50% AR: 50% Customer Create Story ----------- Analyst Develop Feature ----------- Engineer Deploy to Pre-prod ----------- Del Mgr Test Feature ----------- Tester