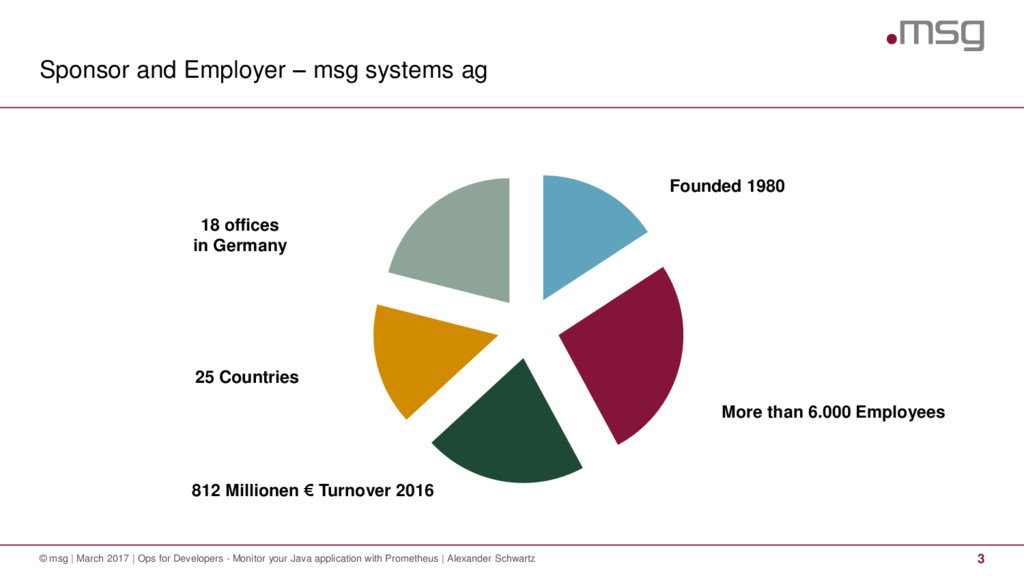
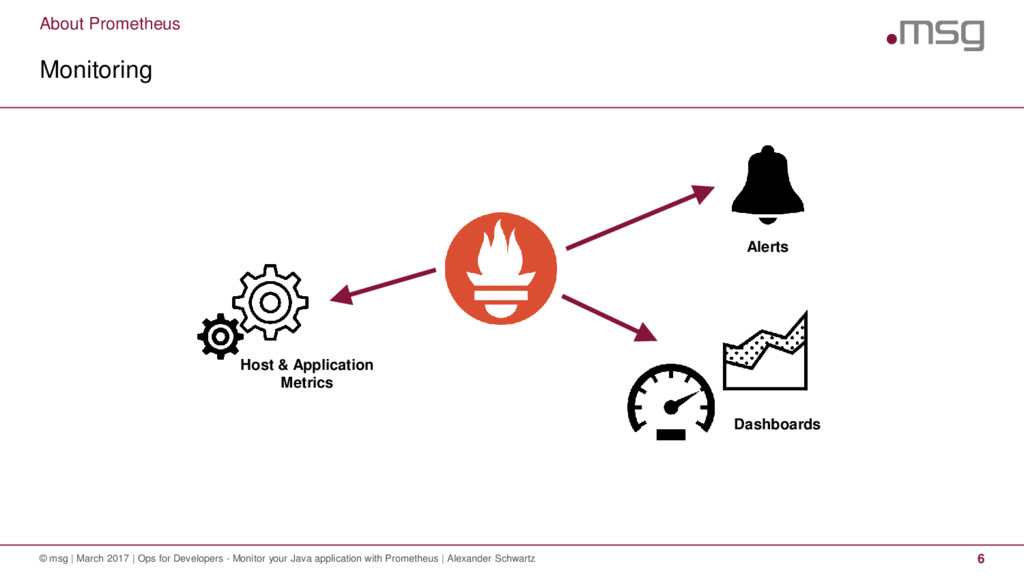
March 2017 | Ops for Developers - Monitor your Java application with Prometheus | Alexander Schwartz 3 Founded 1980 More than 6.000 Employees 812 Millionen € Turnover 2016 25 Countries 18 offices in Germany
2017 | Ops for Developers - Monitor your Java application with Prometheus | Alexander Schwartz 12 Presented by: cadvisor RAM Usage per container: Variable: container_memory_usage_bytes Expression: container_memory_usage_bytes{name=~'.+',id=~'/docker/.*'} CPU Usage per container: Variable: container_cpu_usage_seconds_total Expression: rate(container_cpu_usage_seconds_total [30s]) irate(container_cpu_usage_seconds_total [30s]) sum by (instance, name) (irate(container_cpu_usage_seconds_total{name=~'.+'} [15s]))
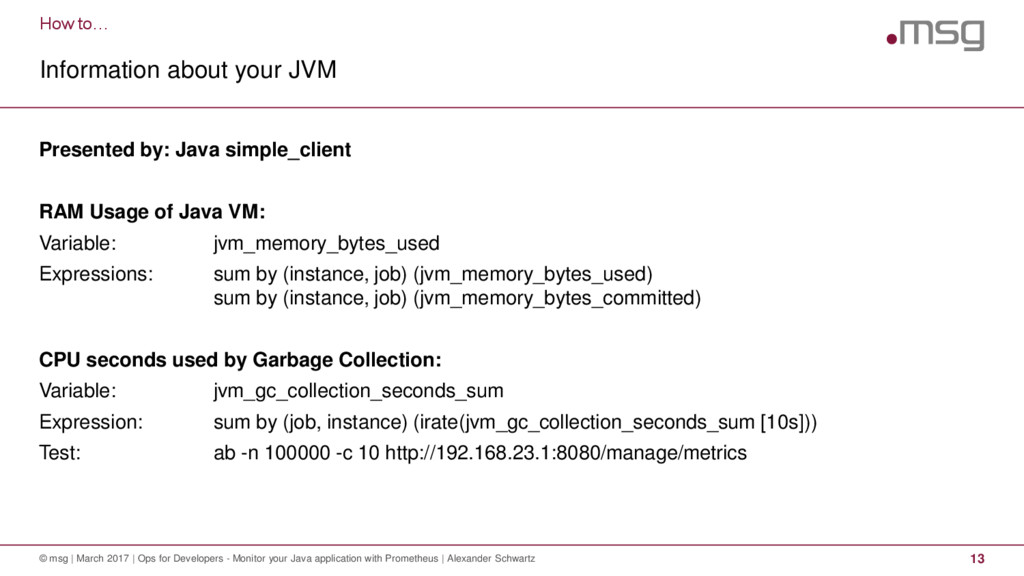
2017 | Ops for Developers - Monitor your Java application with Prometheus | Alexander Schwartz 13 Presented by: Java simple_client RAM Usage of Java VM: Variable: jvm_memory_bytes_used Expressions: sum by (instance, job) (jvm_memory_bytes_used) sum by (instance, job) (jvm_memory_bytes_committed) CPU seconds used by Garbage Collection: Variable: jvm_gc_collection_seconds_sum Expression: sum by (job, instance) (irate(jvm_gc_collection_seconds_sum [10s])) Test: ab -n 100000 -c 10 http://192.168.23.1:8080/manage/metrics
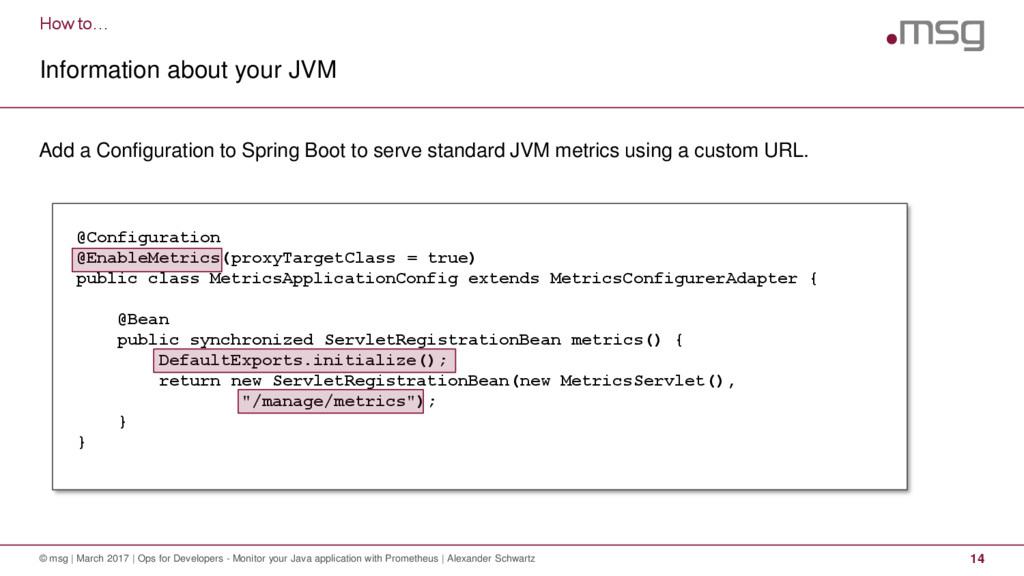
2017 | Ops for Developers - Monitor your Java application with Prometheus | Alexander Schwartz 14 Add a Configuration to Spring Boot to serve standard JVM metrics using a custom URL. @Configuration @EnableMetrics(proxyTargetClass = true) public class MetricsApplicationConfig extends MetricsConfigurerAdapter { @Bean public synchronized ServletRegistrationBean metrics() { DefaultExports.initialize(); return new ServletRegistrationBean(new MetricsServlet(), "/manage/metrics"); } }
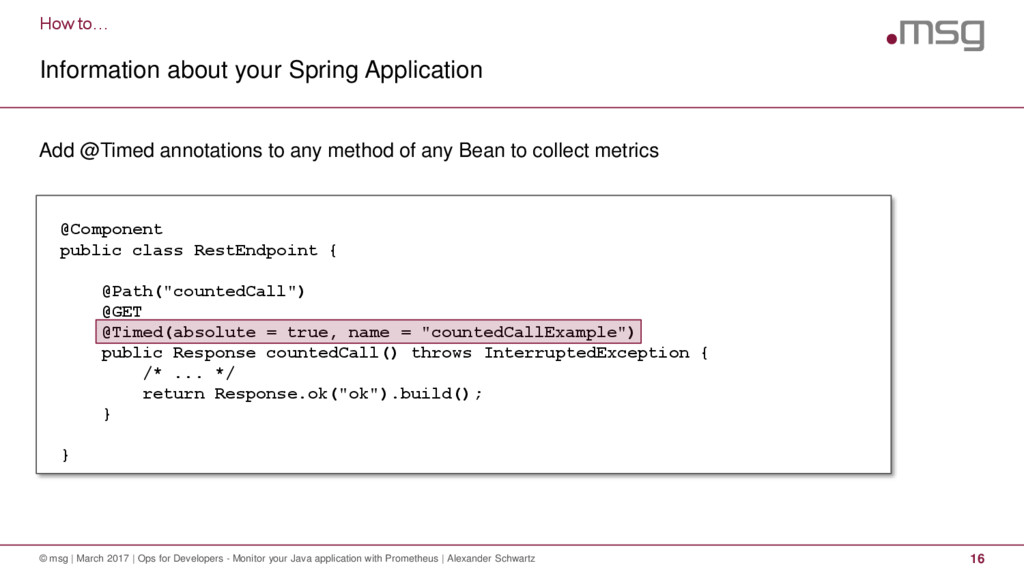
March 2017 | Ops for Developers - Monitor your Java application with Prometheus | Alexander Schwartz 16 Add @Timed annotations to any method of any Bean to collect metrics @Component public class RestEndpoint { @Path("countedCall") @GET @Timed(absolute = true, name = "countedCallExample") public Response countedCall() throws InterruptedException { /* ... */ return Response.ok("ok").build(); } }
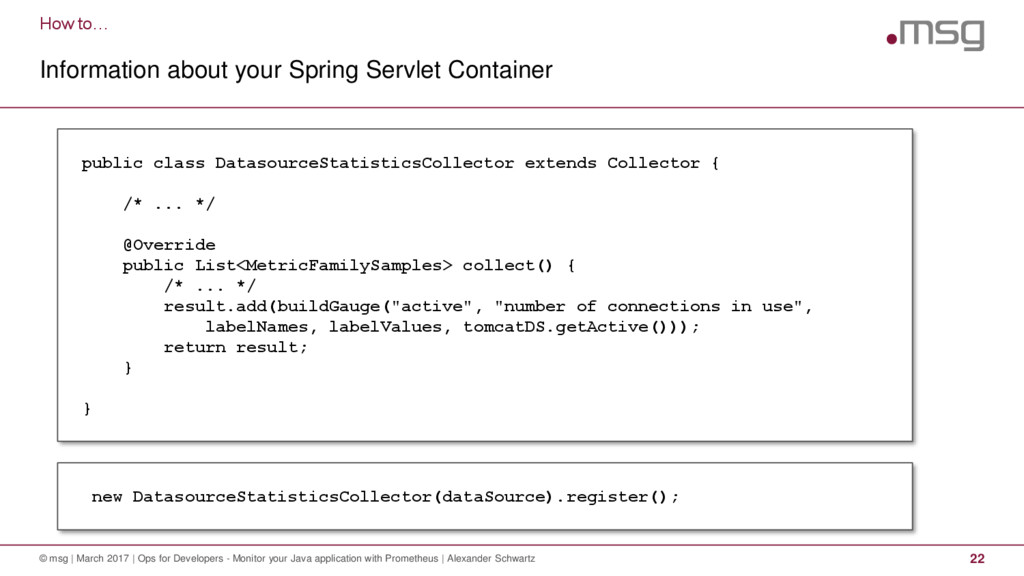
| March 2017 | Ops for Developers - Monitor your Java application with Prometheus | Alexander Schwartz 21 Presented by: your own Java metric provider Tomcat Connector: Java Class: Write your own: TomcatStatisticsCollector Variables: tomcat_thread_pool_current_thread_count tomcat_thread_pool_current_threads_busy Tomcat DB Connection Pool: Java Class: Write your own: DatasourceStatisticsCollector Variables: tomcat_datasource_active tomcat_datasource_idle tomcat_datasource_max_idle
| March 2017 | Ops for Developers - Monitor your Java application with Prometheus | Alexander Schwartz 22 public class DatasourceStatisticsCollector extends Collector { /* ... */ @Override public List<MetricFamilySamples> collect() { /* ... */ result.add(buildGauge("active", "number of connections in use", labelNames, labelValues, tomcatDS.getActive())); return result; } } new DatasourceStatisticsCollector(dataSource).register();
March 2017 | Ops for Developers - Monitor your Java application with Prometheus | Alexander Schwartz 24 // During Setup vertx = Vertx.vertx(new VertxOptions().setMetricsOptions( new DropwizardMetricsOptions() .setRegistryName("vertx") .addMonitoredHttpClientEndpoint( new Match().setValue(".*").setType(MatchType.REGEX)) .setEnabled(true) )); DefaultExports.initialize(); new DropwizardExports(SharedMetricRegistries.getOrCreate("vertx")).register(); // When starting up Routes and a HTTP Server final Router router = Router.router(vertx); router.route("/metrics").handler(new MetricsHandler());
| Ops for Developers - Monitor your Java application with Prometheus | Alexander Schwartz 25 Any Metric can be exported to other Prometheus instances http://localhost/prometheus/federate?match[]={job=%22prometheus%22}
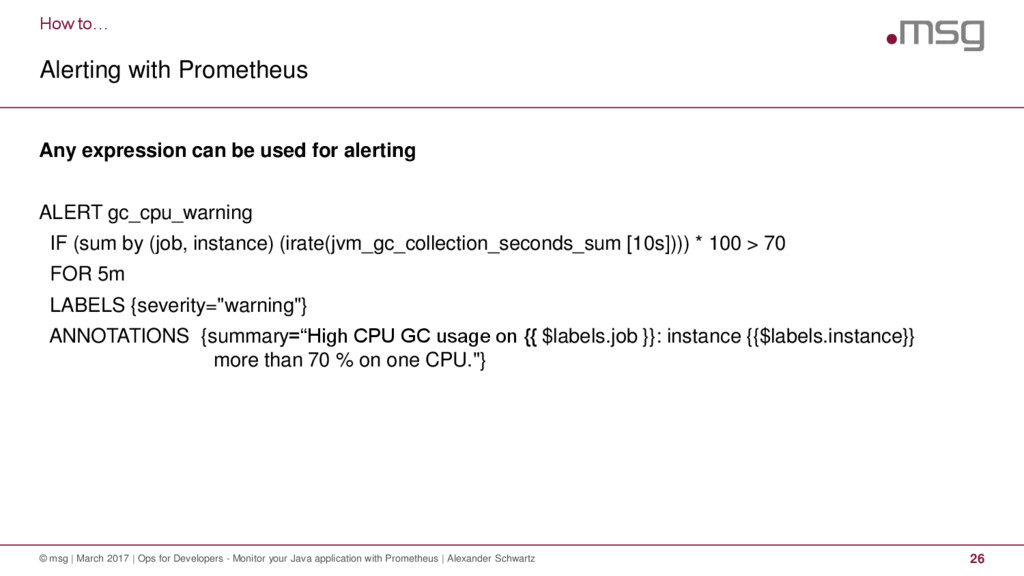
| Ops for Developers - Monitor your Java application with Prometheus | Alexander Schwartz 26 Any expression can be used for alerting ALERT gc_cpu_warning IF (sum by (job, instance) (irate(jvm_gc_collection_seconds_sum [10s]))) * 100 > 70 FOR 5m LABELS {severity="warning"} ANNOTATIONS {summary=“High CPU GC usage on {{ $labels.job }}: instance {{$labels.instance}} more than 70 % on one CPU."}
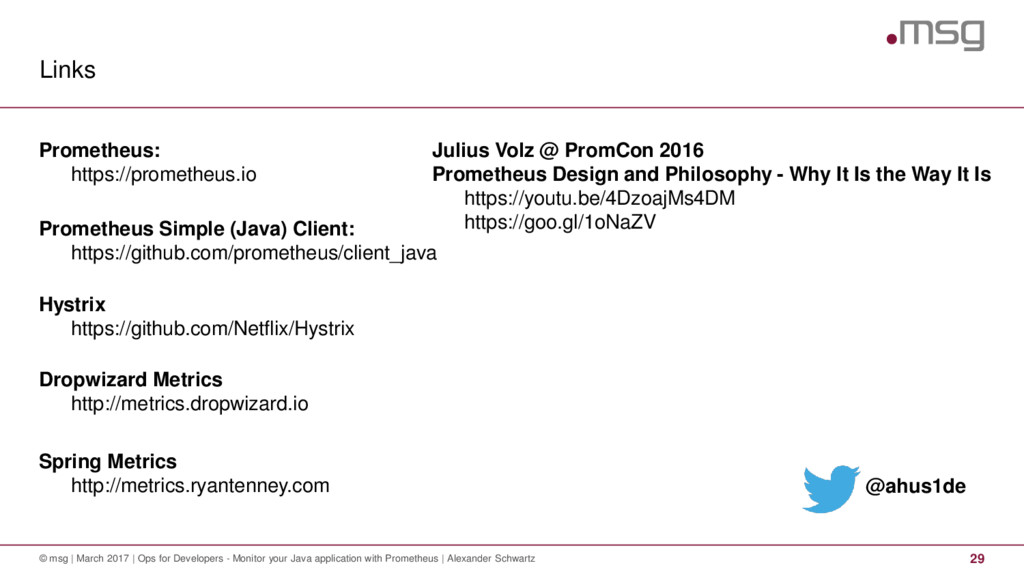
- Monitor your Java application with Prometheus | Alexander Schwartz 29 Prometheus: https://prometheus.io Prometheus Simple (Java) Client: https://github.com/prometheus/client_java Hystrix https://github.com/Netflix/Hystrix Dropwizard Metrics http://metrics.dropwizard.io Spring Metrics http://metrics.ryantenney.com @ahus1de Julius Volz @ PromCon 2016 Prometheus Design and Philosophy - Why It Is the Way It Is https://youtu.be/4DzoajMs4DM https://goo.gl/1oNaZV