Upgrade to Pro — share decks privately, control downloads, hide ads and more …

Making users happy with Service Level Indicator...

Making users happy with Service Level Indicators and observability

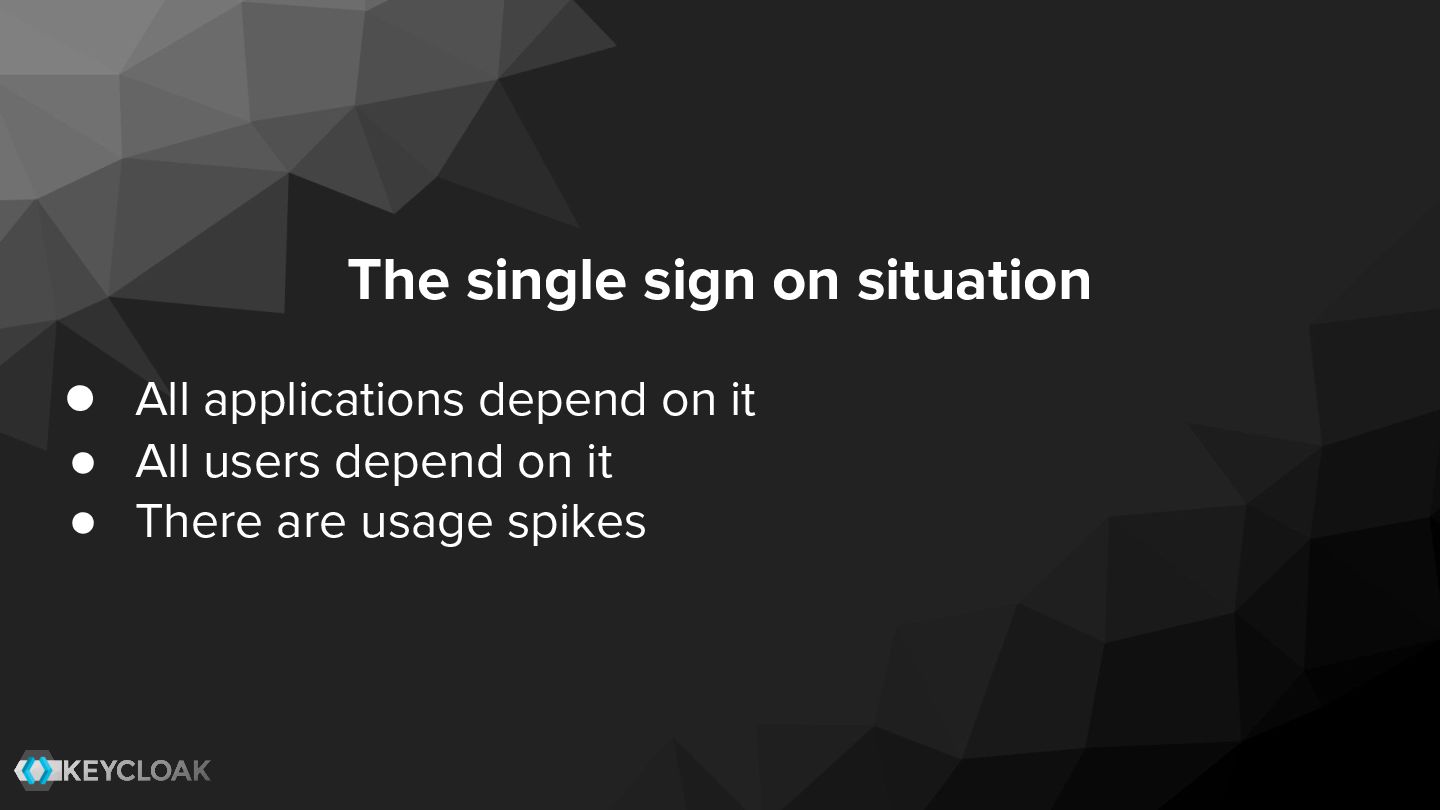
A single sign-on system like Keycloak is a central component of the application landscape. Users depend on it to log in to their applications. Detailed monitoring and analysis options help prevent outages or resolve them quickly.
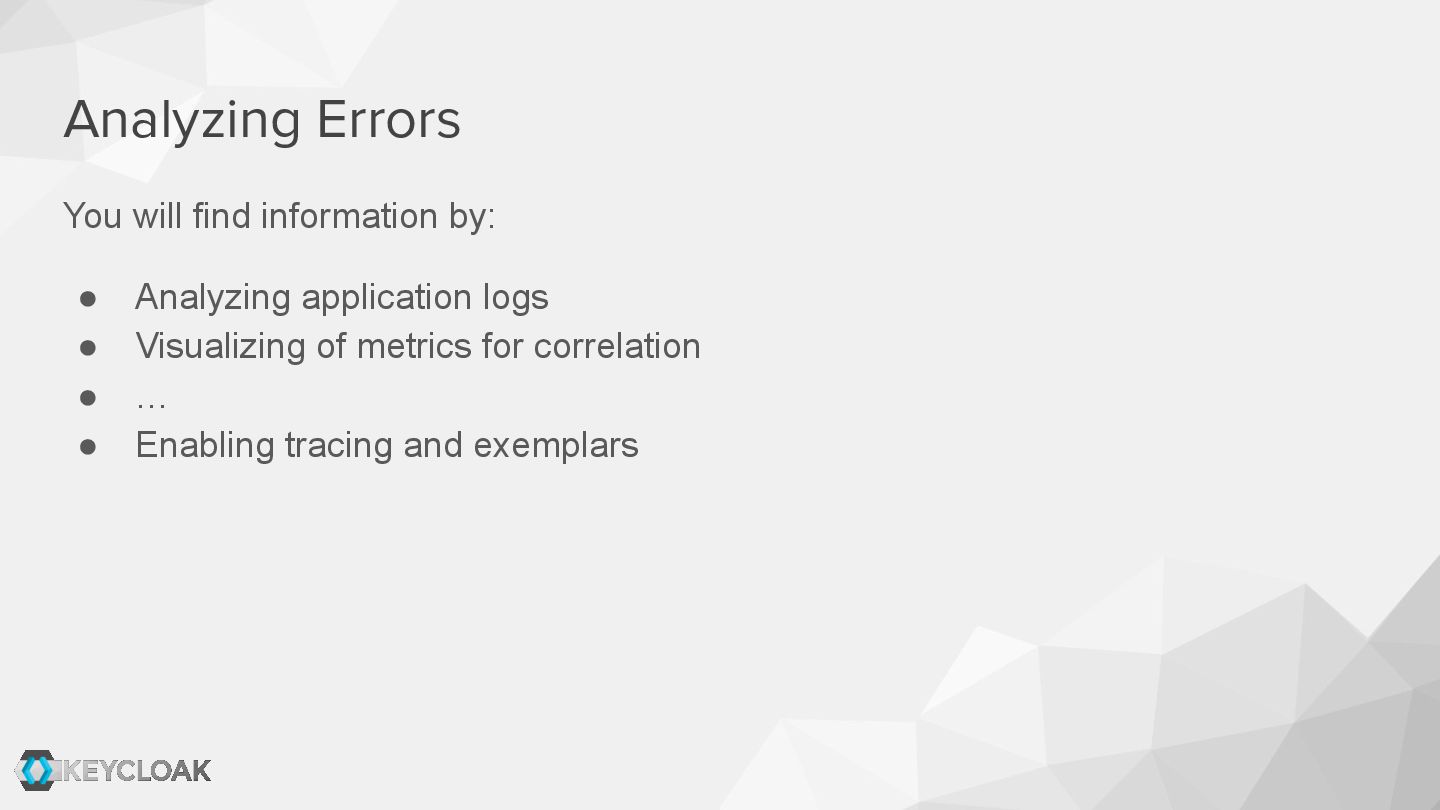
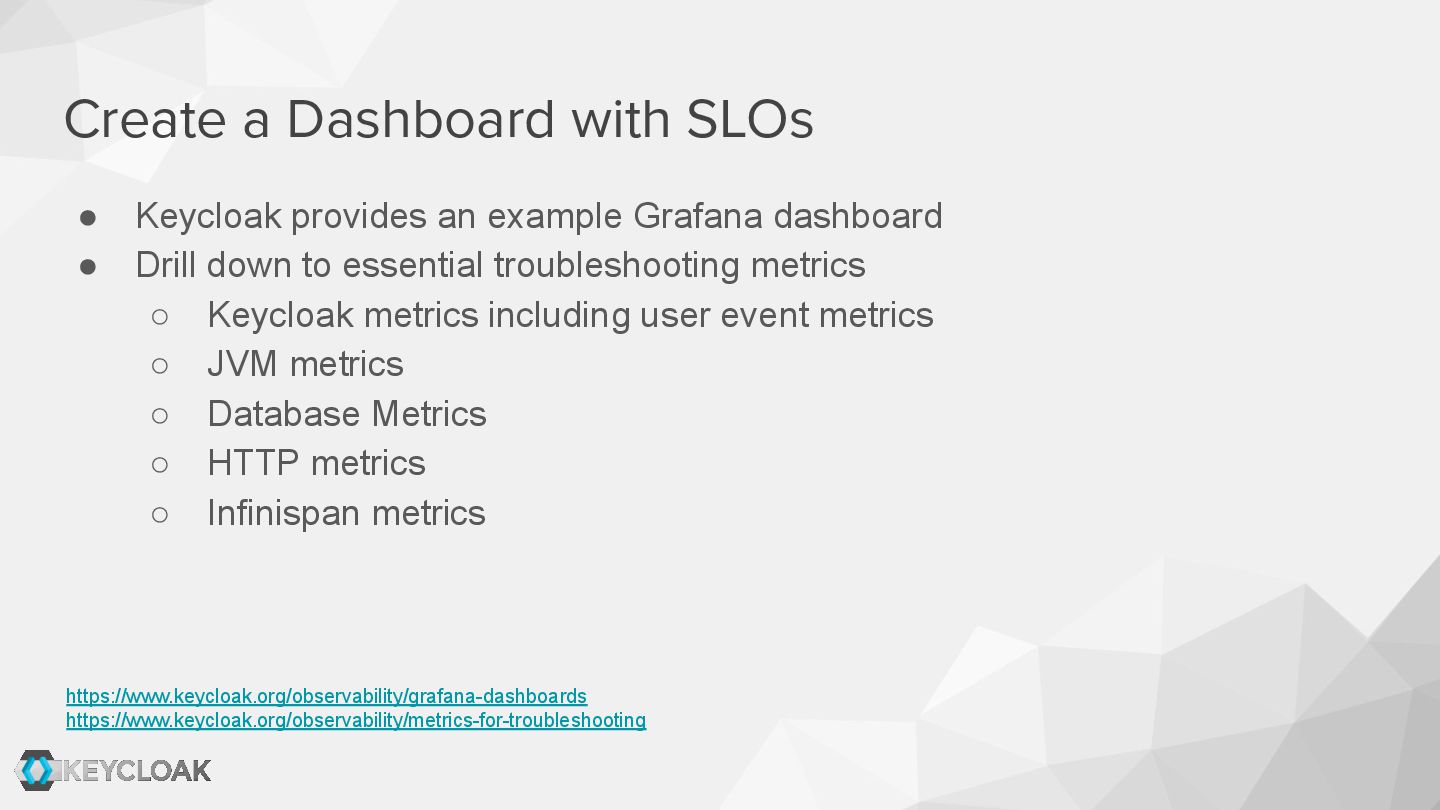
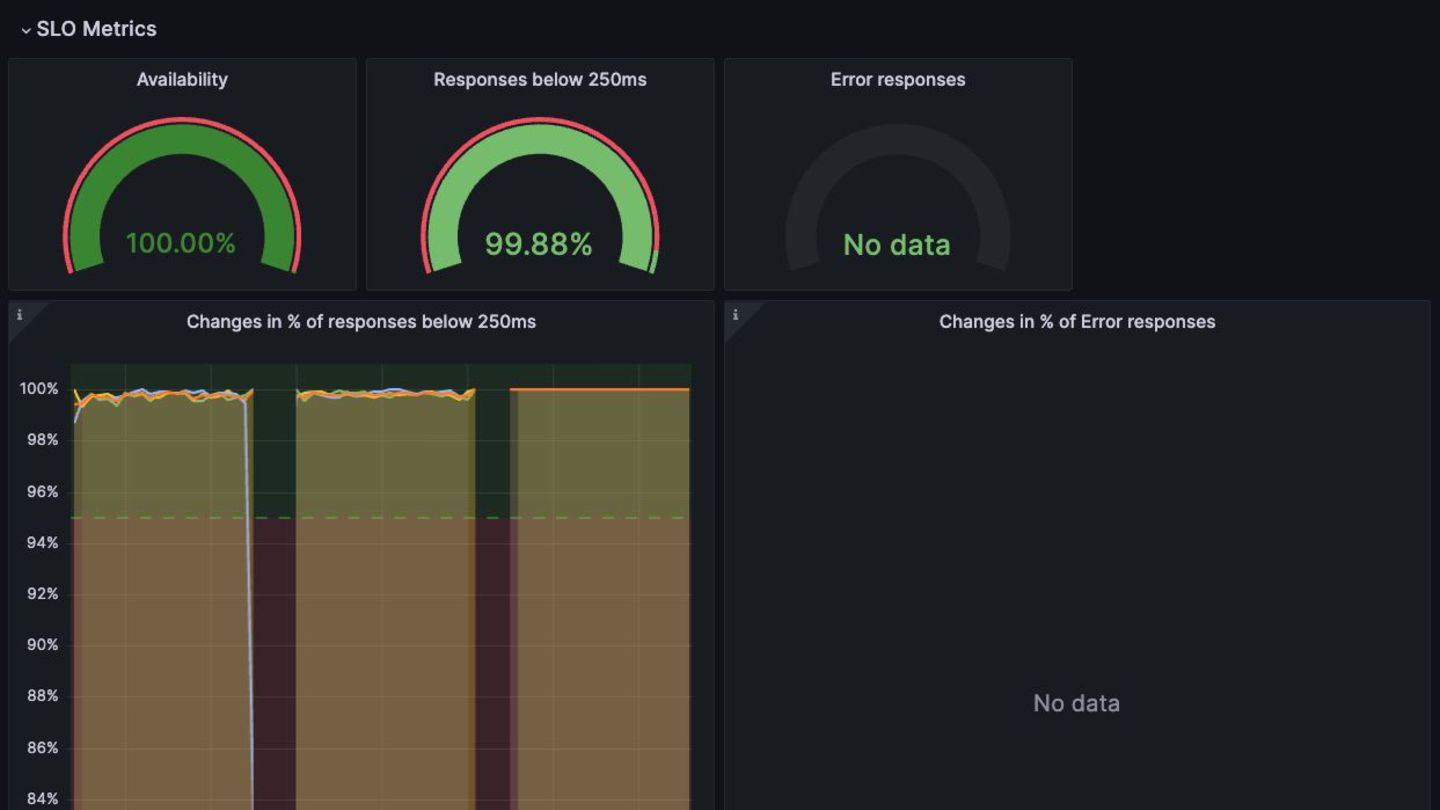
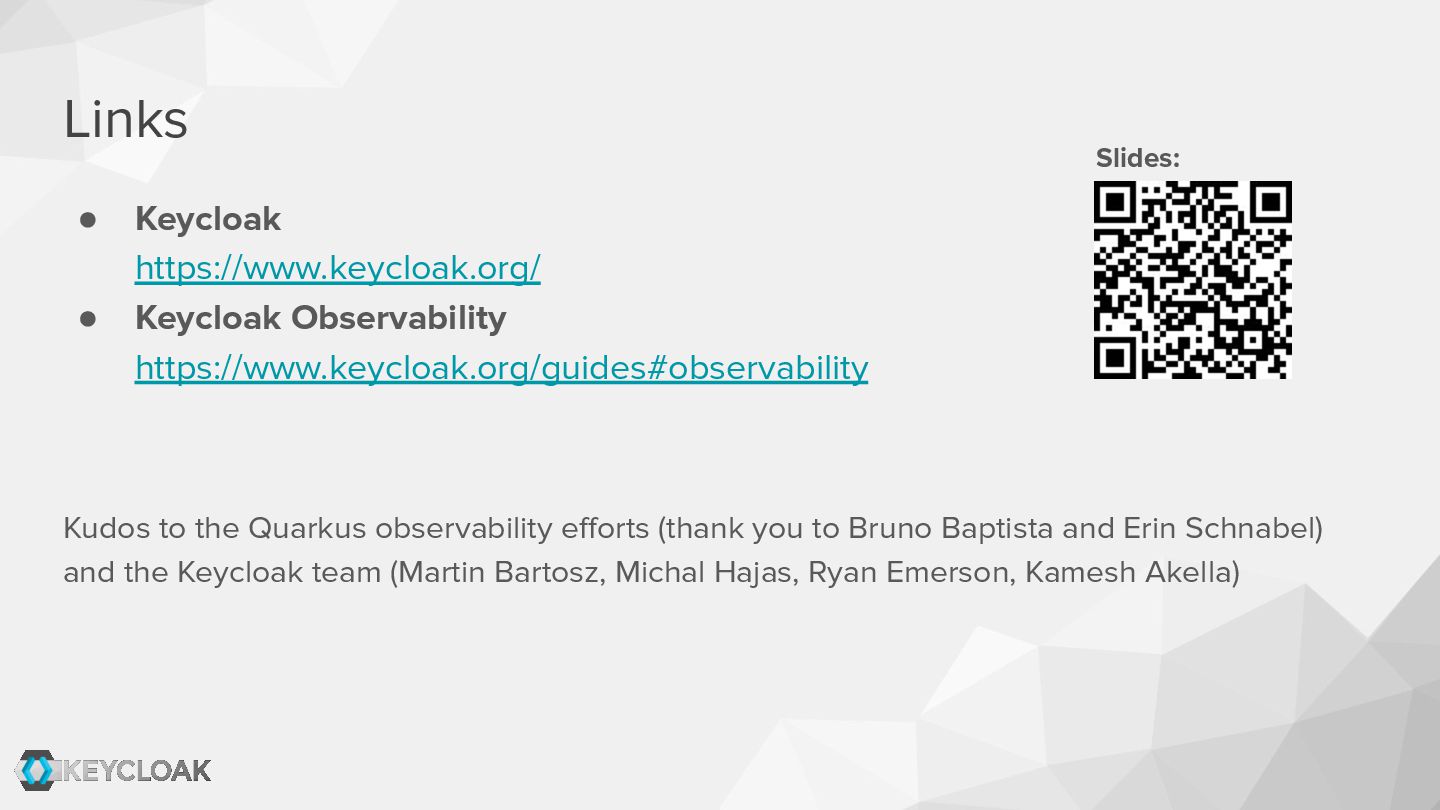
Over the past 12 months, the Keycloak team has implemented numerous technical improvements regarding logs, metrics, and traces. We also provide a guide to service-level indicators and a matching Grafana dashboard for defining and monitoring behavior from the user perspective.
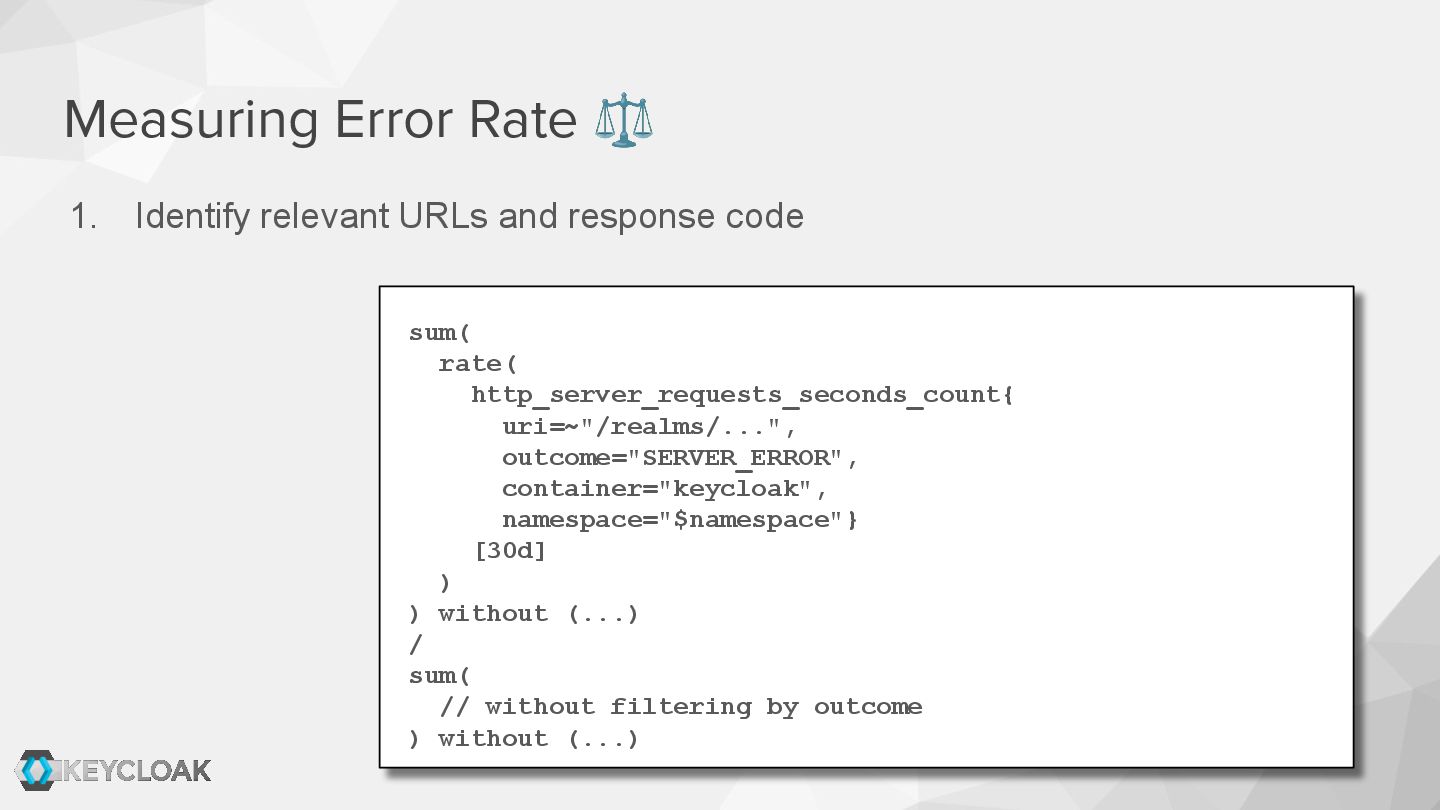
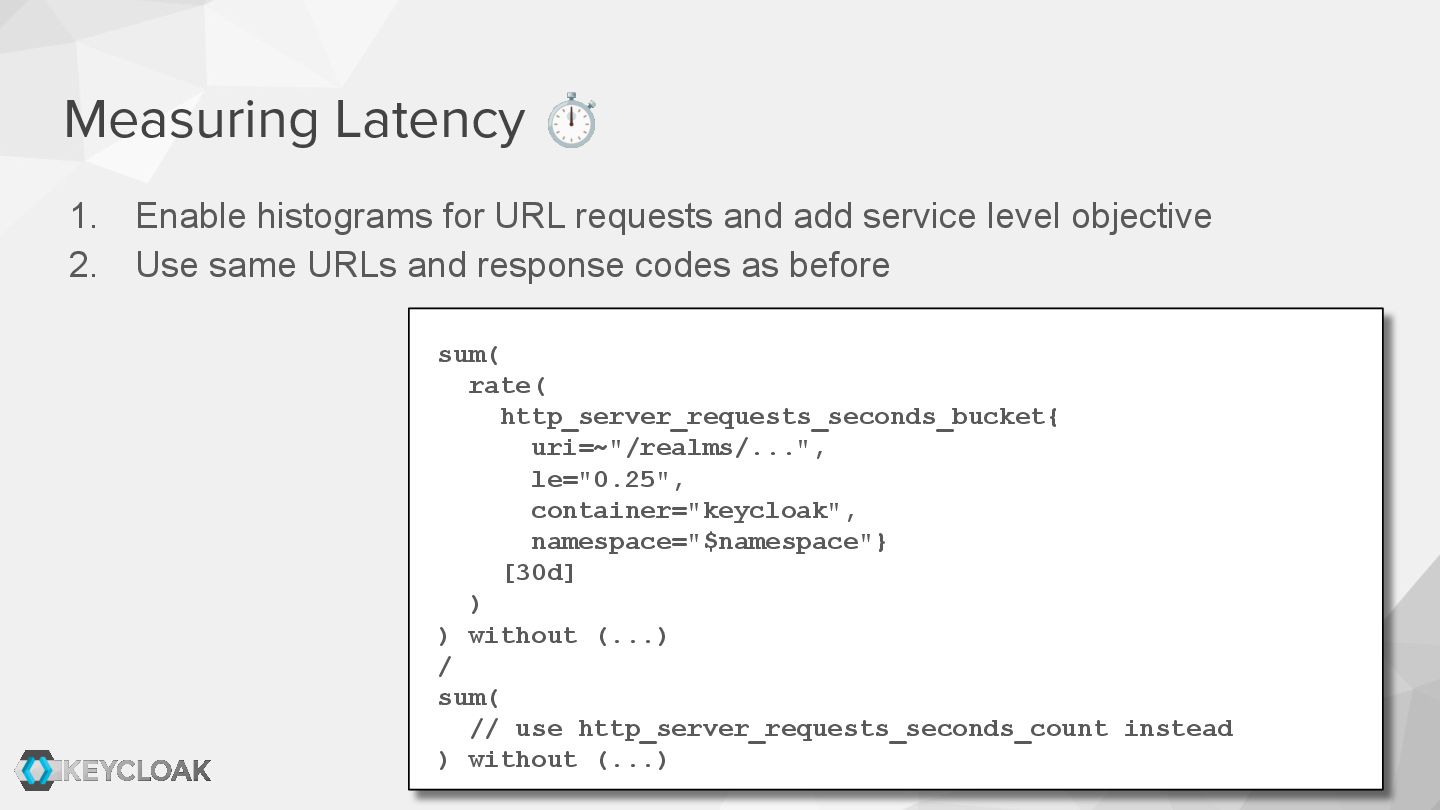
This talk offers practical advice on using Keycloak and is also a case study of how observability can be implemented for custom-built applications.

Avatar for Alexander Schwartz

Alexander Schwartz

June 28, 2025
Tweet

More Decks by Alexander Schwartz

Other Decks in Technology

Transcript

  1. Making users happy with service level indicators and observability Alexander

    Schwartz | Principal Software Engineer | IBM We Are Developers World Congress | Berlin (DE) | 2025-07-09
  2. The single sign on situation • All applications depend on

    it • All users depend on it • There are usage spikes
  3. Keycloak is an Open Source Identity and Access Management Solution

    🎂 Initial commit 2013-07-02 🏆 Cloud Native Computing Foundation Incubating project since April 2023 📜 Apache License, Version 2.0 ⭐ 28k GitHub stars
  4. Recipe to make users happy • Login works • Login

    is fast plus a lot of small details like token refresh, up-to-date user data, logout, password reset, auditing, …
  5. Availability 👍 Measured by external tests to an application endpoint

    SLO: “Keycloak should be available X% of the time within 30 days”. Negatively affected by: • Software upgrades of your service • Unavailable infrastructure • Denial of service attacks • … https://www.keycloak.org/observability/keycloak-service-level-indicators
  6. Reported by the application or a load balancer SLO: “The

    rate of errors due to server problems for authentication requests should be less than X% within 30 days.” Negatively affected by: • Problems with neighboring systems • … Error Rate ⚖
  7. Reported by the application or a load balancer SLO: “X%

    of authentication related requests should be faster than Y ms within 30 days.” Negatively affected by: • Database or other infrastructure load • Application load • Lack of scalability • … Latency ⏱
  8. Measuring Availability 👍 1. Enable metrics. Prometheus will report the

    “up” metric. count_over_time( sum (up{ container="keycloak", namespace="$namespace" } > 0)[30d:15s] ) / count_over_time(vector(1)[30d:15s])
  9. Measuring Error Rate ⚖ 1. Identify relevant URLs and response

    code sum( rate( http_server_requests_seconds_count{ uri=~"/realms/...", outcome="SERVER_ERROR", container="keycloak", namespace="$namespace"} [30d] ) ) without (...) / sum( // without filtering by outcome ) without (...)
  10. 1. Enable histograms for URL requests and add service level

    objective 2. Use same URLs and response codes as before Measuring Latency ⏱ sum( rate( http_server_requests_seconds_bucket{ uri=~"/realms/...", le="0.25", container="keycloak", namespace="$namespace"} [30d] ) ) without (...) / sum( // use http_server_requests_seconds_count instead ) without (...)
  11. You will find information by: • Analyzing application logs •

    Visualizing of metrics for correlation • … • Enabling tracing and exemplars Analyzing Errors
  12. You will find information by: • Additional logging (for example

    hibernate slow queries) • Visualizing of metrics for correlation • … • Enabling tracing and exemplars Analyzing Latencies
  13. • Enable tracing for your application. • In production, apply

    sampling to trace for example 1% of all request to reduce overhead and limit collected data. • Independent of the sampling, 100% of the logs will contain trace IDs, and it will propagate between systems. • Set up firewalls and proxies to limit propagation of trace information • Set up a destination for the tracing data (for example Jaeger or Tempo). • Use web UIs to filter by duration, errors, URIs, and export/import single traces Enabling tracing https://www.keycloak.org/observability/tracing
  14. • Added custom tags for searching (Client ID, Realm name,

    User session ID, Token ID, Authentication Session ID, …) • Default spans for REST, HTTP client calls and SQL • Custom spans for LDAP, transaction handling, password handling Tracing implementation in Keycloak
  15. • Enable metrics and tracing for your application. • Activate

    exemplar handling in Prometheus (or similar). • Scrape the metrics in a format with exemplar support (OpenMetrics). • Set up metrics datasource in Grafana (or similar) where to link for traces • Set up dashboards in Grafana (or similar) to show exemplars Enabling Exemplars https://www.keycloak.org/observability/exemplars
  16. • Keycloak provides an example Grafana dashboard • Drill down

    to essential troubleshooting metrics ◦ Keycloak metrics including user event metrics ◦ JVM metrics ◦ Database Metrics ◦ HTTP metrics ◦ Infinispan metrics Create a Dashboard with SLOs https://www.keycloak.org/observability/grafana-dashboards https://www.keycloak.org/observability/metrics-for-troubleshooting
  17. • Track the metrics that matter for your users •

    Make SLOs the base of your alertings • Chase tail latencies and errors with exemplars Happy users, happy devops team!
  18. • Have one set of numbers to share with your

    management • Optimize your infrastructure costs with the given latency target • Balance feature development vs. SLI optimization Simple numbers, happy management
  19. • Keycloak https://www.keycloak.org/ • Keycloak Observability https://www.keycloak.org/guides#observability Kudos to the

    Quarkus observability efforts (thank you to Bruno Baptista and Erin Schnabel) and the Keycloak team (Martin Bartosz, Michal Hajas, Ryan Emerson, Kamesh Akella) Links Slides: