Upgrade to Pro — share decks privately, control downloads, hide ads and more …

FAANG Stock Charts with Seasonal Colors

FAANG Stock Charts with Seasonal Colors

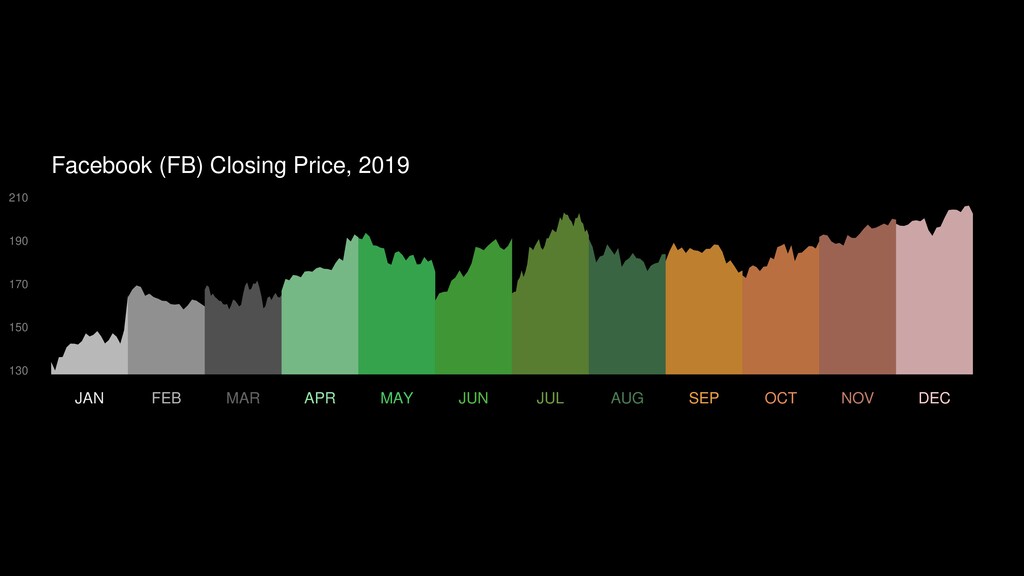
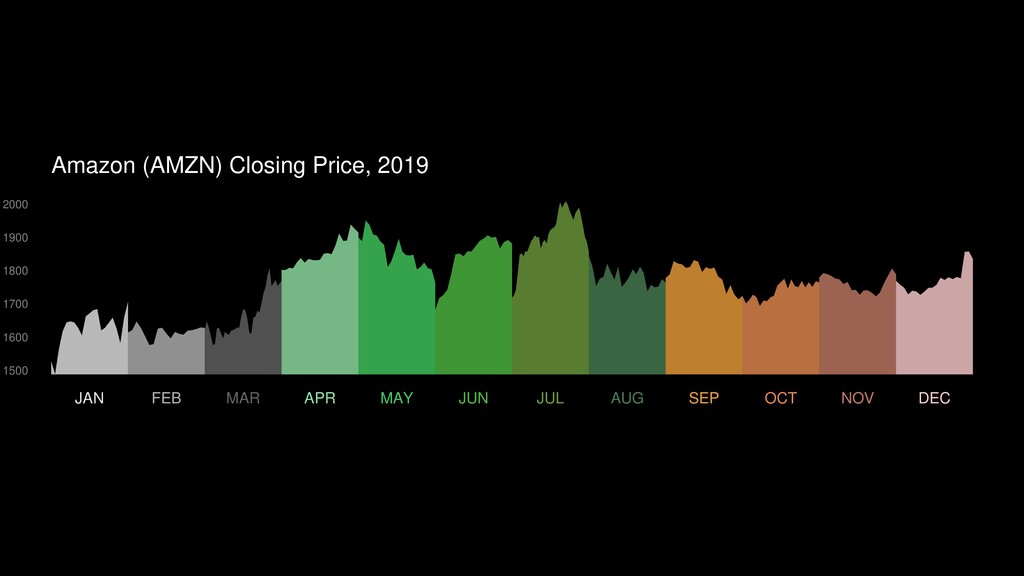
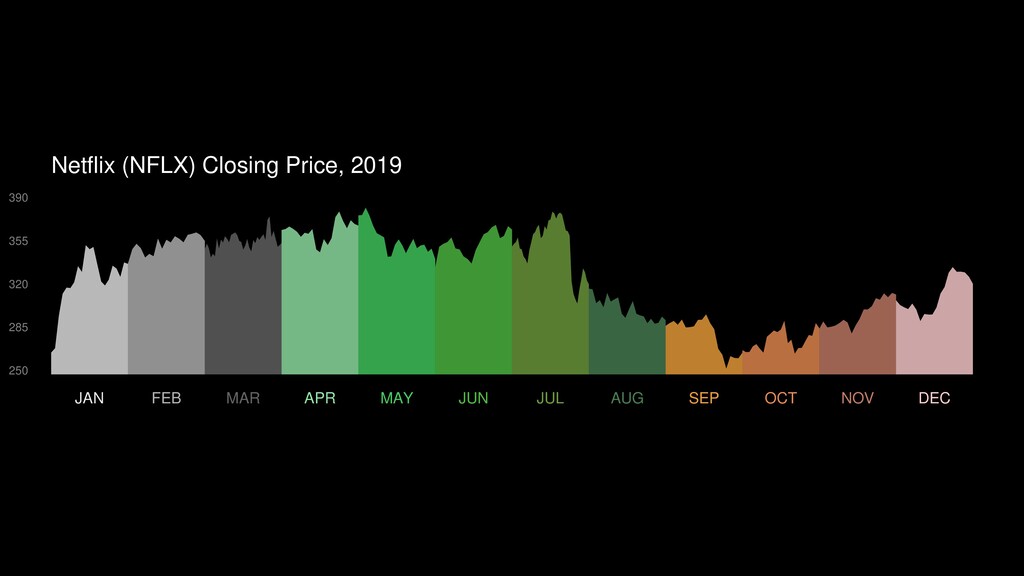
Using the FAANG companies (Facebook, Amazon, Apple, Netflix and Google) as subjects, individual area stock charts for each month are combined to show the yearly performance. Each month has its own color related to the seasons (as seen in the Northern Hemisphere).

Anthony Starks

April 10, 2020
Tweet

More Decks by Anthony Starks

Other Decks in Design

Transcript

  1. Facebook (FB) Closing Price, 2019 130 150 170 190 210

    JAN FEB MAR APR MAY JUN JUL AUG SEP OCT NOV DEC
  2. Apple Computer (AAPL) Closing Price, 2019 140 180 220 260

    300 JAN FEB MAR APR MAY JUN JUL AUG SEP OCT NOV DEC
  3. Amazon (AMZN) Closing Price, 2019 1500 1600 1700 1800 1900

    2000 JAN FEB MAR APR MAY JUN JUL AUG SEP OCT NOV DEC
  4. Netflix (NFLX) Closing Price, 2019 250 285 320 355 390

    JAN FEB MAR APR MAY JUN JUL AUG SEP OCT NOV DEC
  5. Alphabet (GOOG) Closing Price, 2019 1000 1100 1200 1300 1400

    JAN FEB MAR APR MAY JUN JUL AUG SEP OCT NOV DEC
  6. Microsoft (MSFT) Closing Price, 2019 90 100 110 120 130

    140 150 160 JAN FEB MAR APR MAY JUN JUL AUG SEP OCT NOV DEC