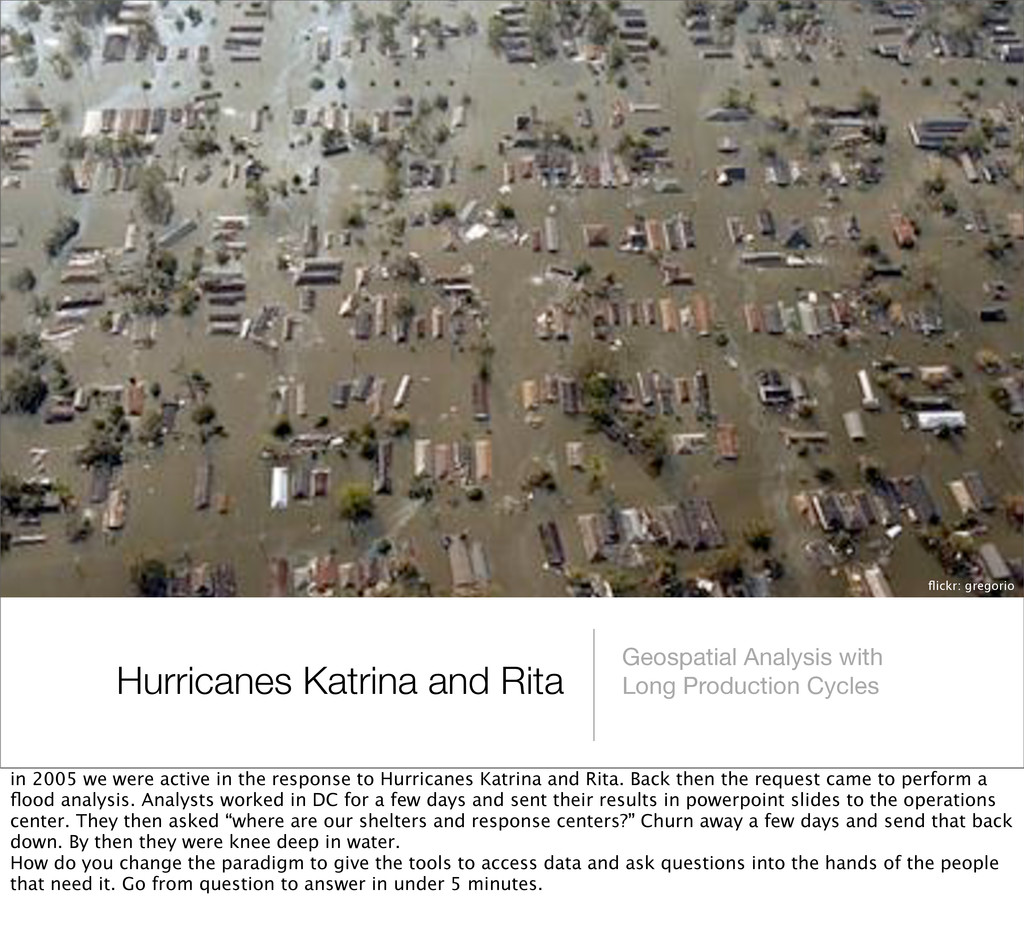
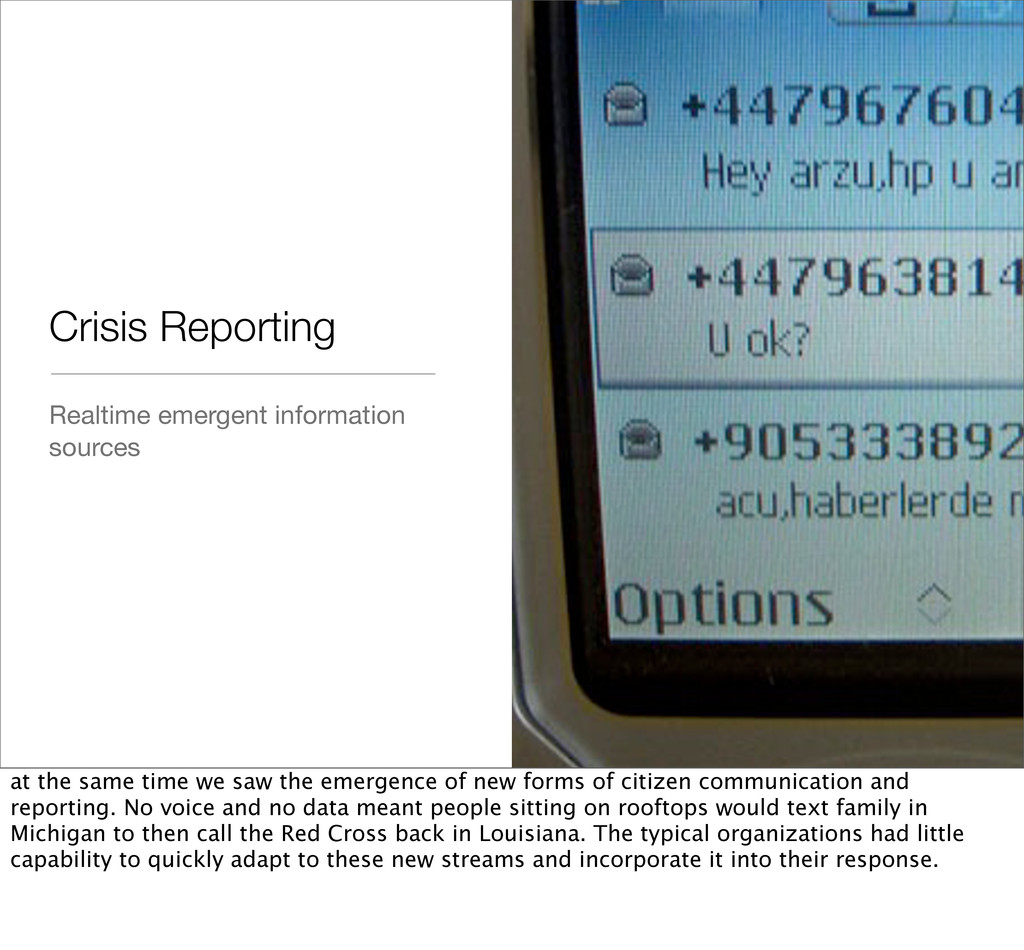
flickr: gregorio in 2005 we were active in the response to Hurricanes Katrina and Rita. Back then the request came to perform a flood analysis. Analysts worked in DC for a few days and sent their results in powerpoint slides to the operations center. They then asked “where are our shelters and response centers?” Churn away a few days and send that back down. By then they were knee deep in water. How do you change the paradigm to give the tools to access data and ask questions into the hands of the people that need it. Go from question to answer in under 5 minutes.
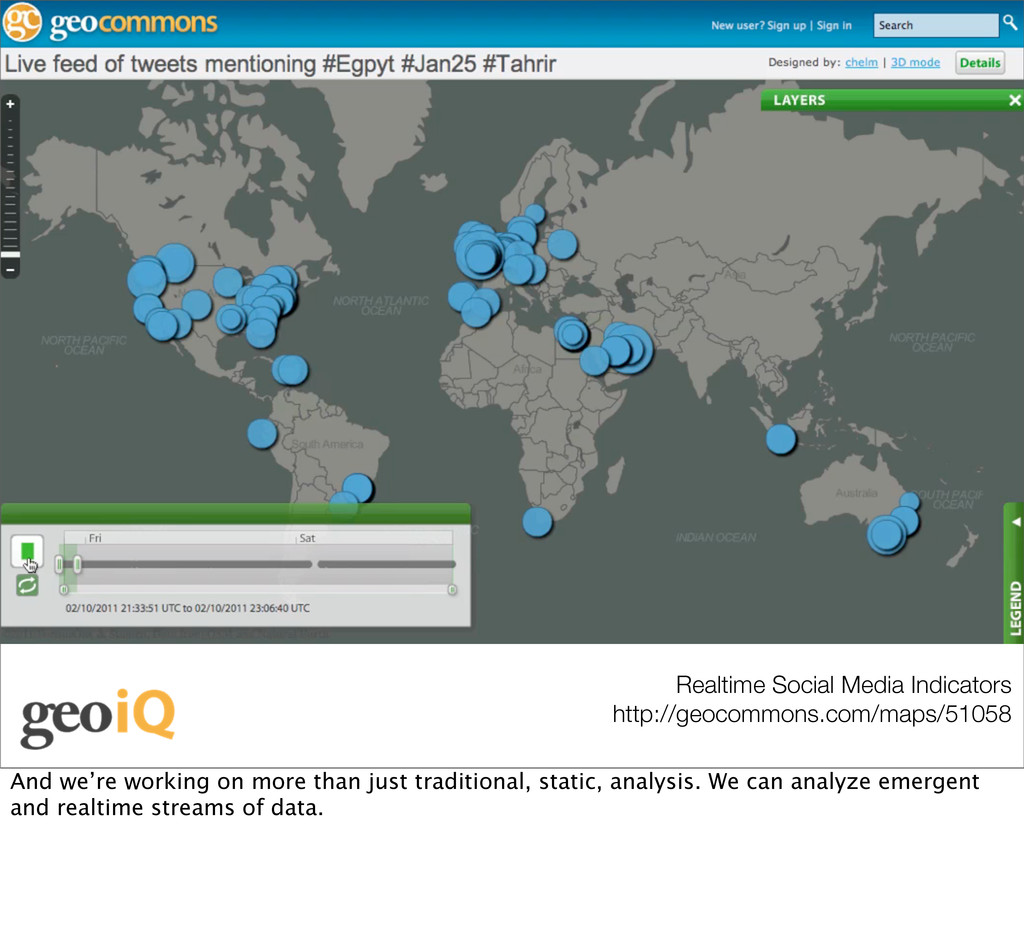
we saw the emergence of new forms of citizen communication and reporting. No voice and no data meant people sitting on rooftops would text family in Michigan to then call the Red Cross back in Louisiana. The typical organizations had little capability to quickly adapt to these new streams and incorporate it into their response.
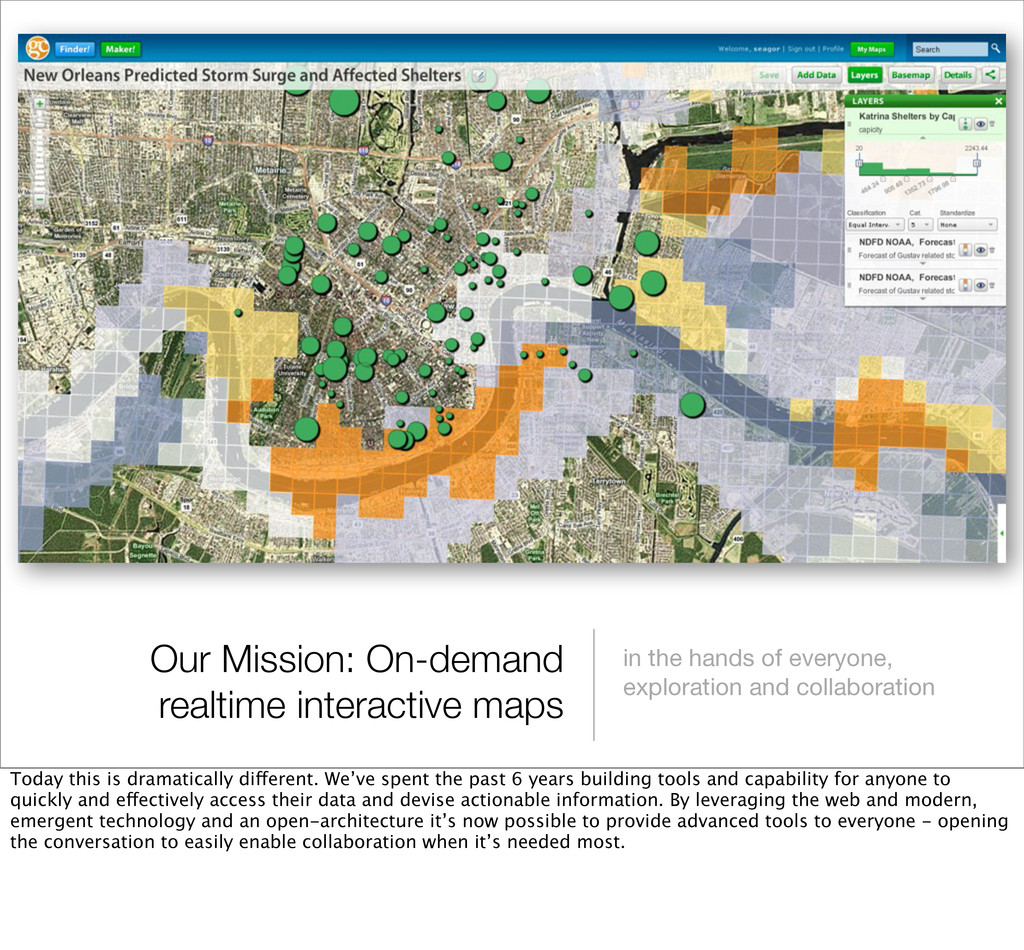
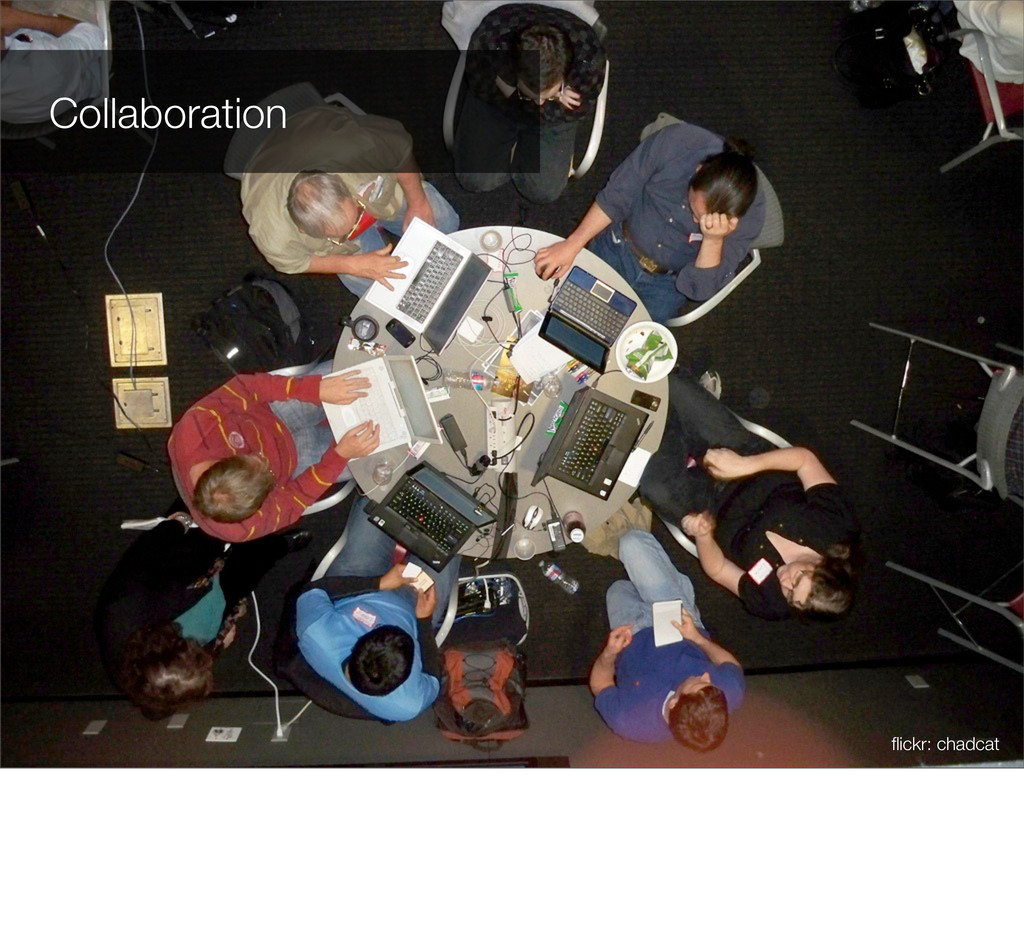
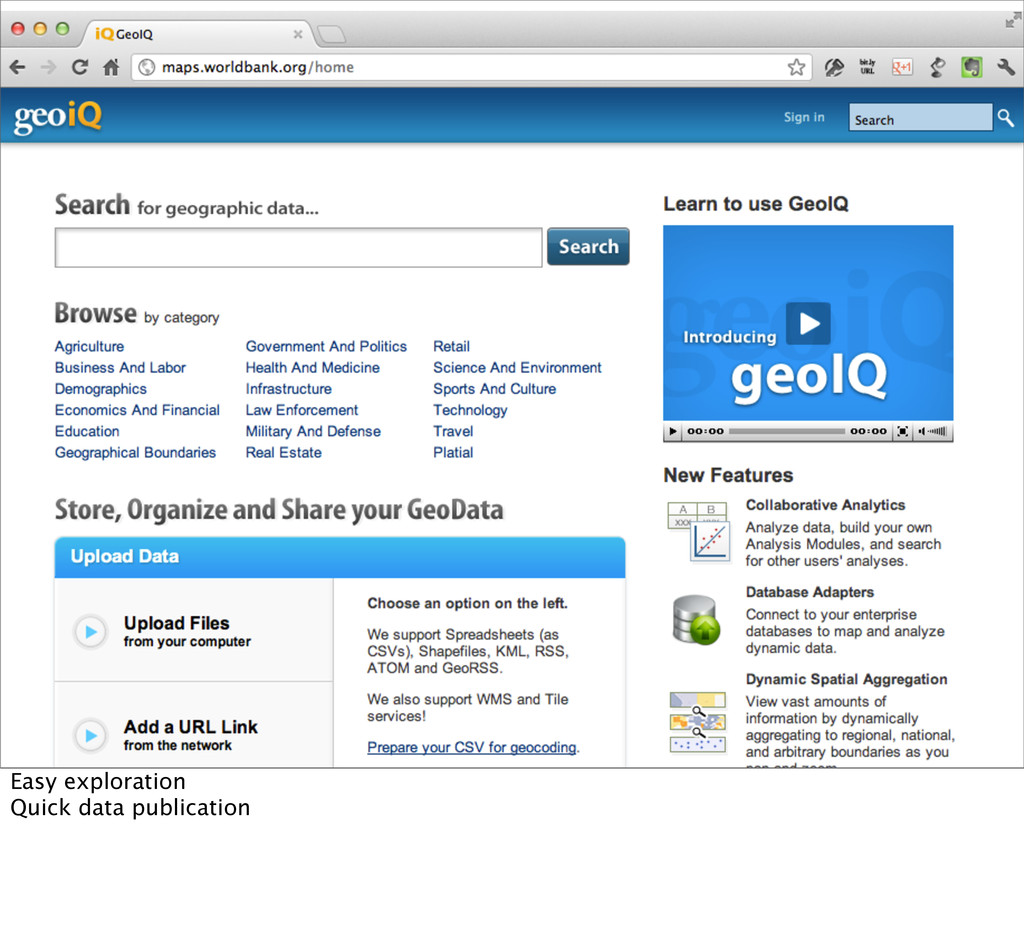
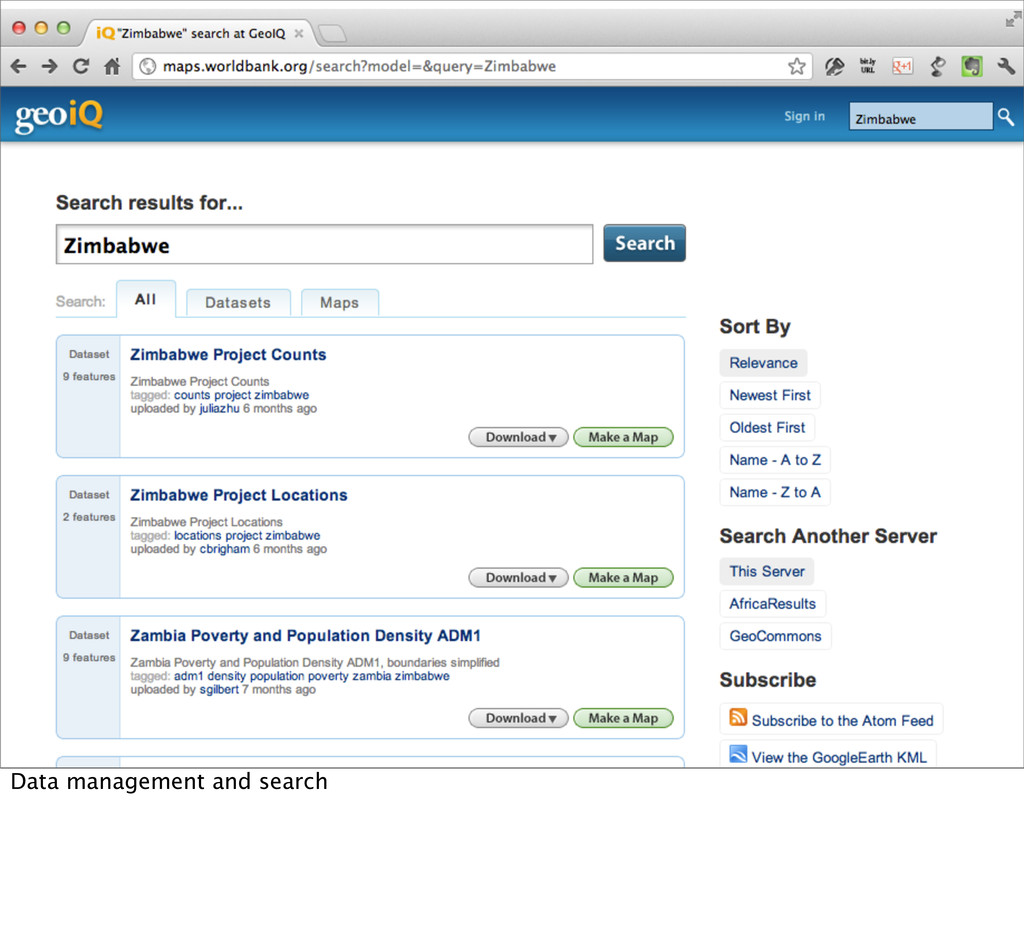
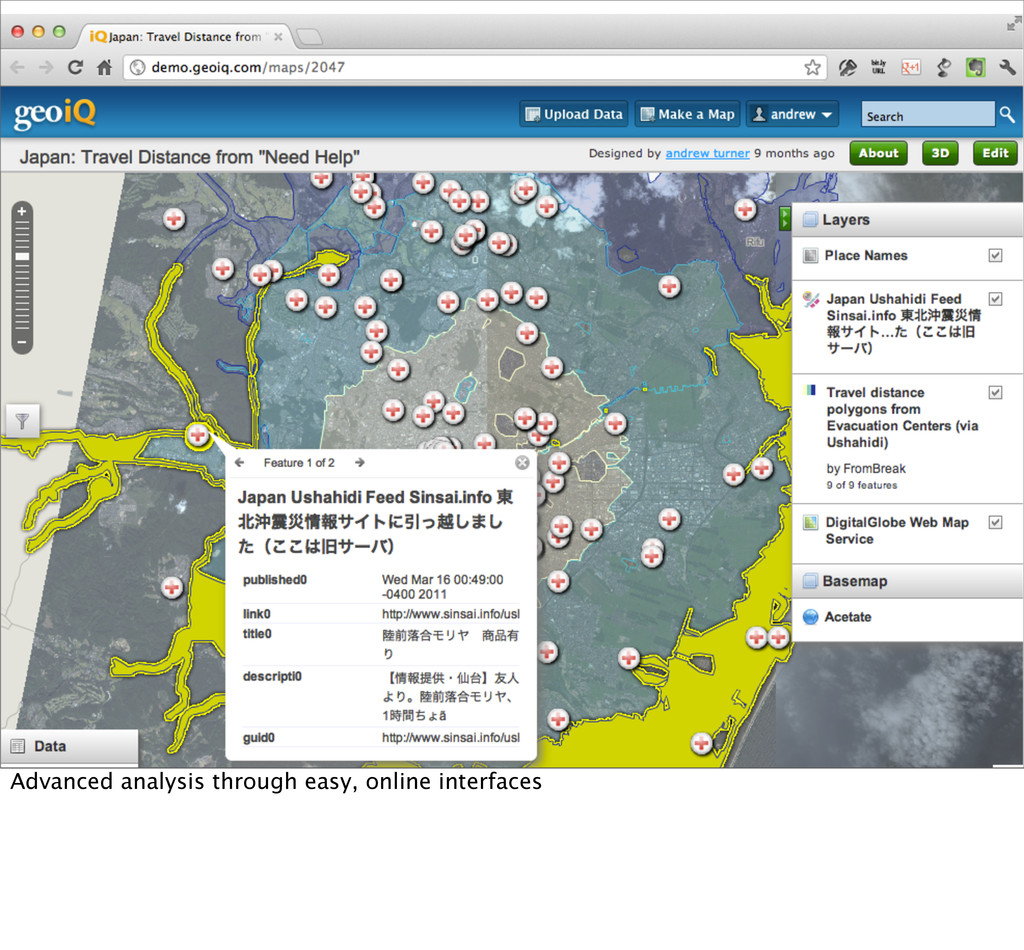
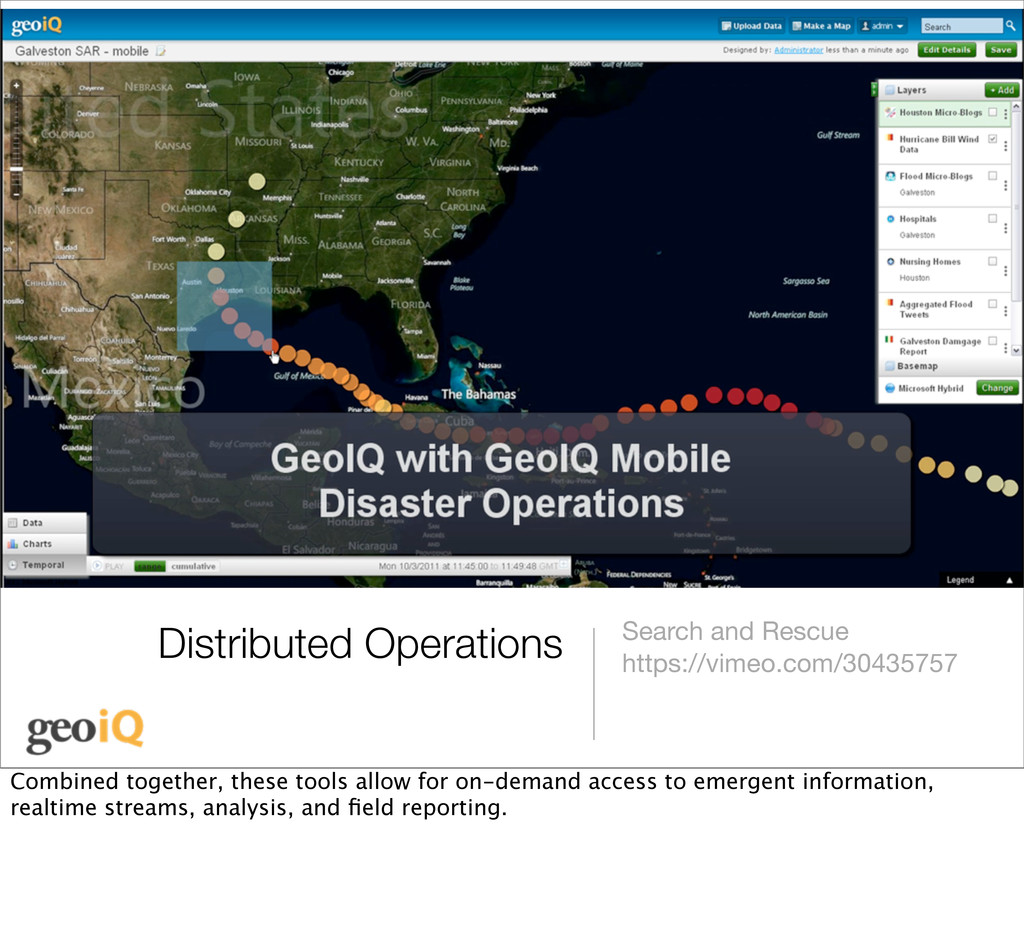
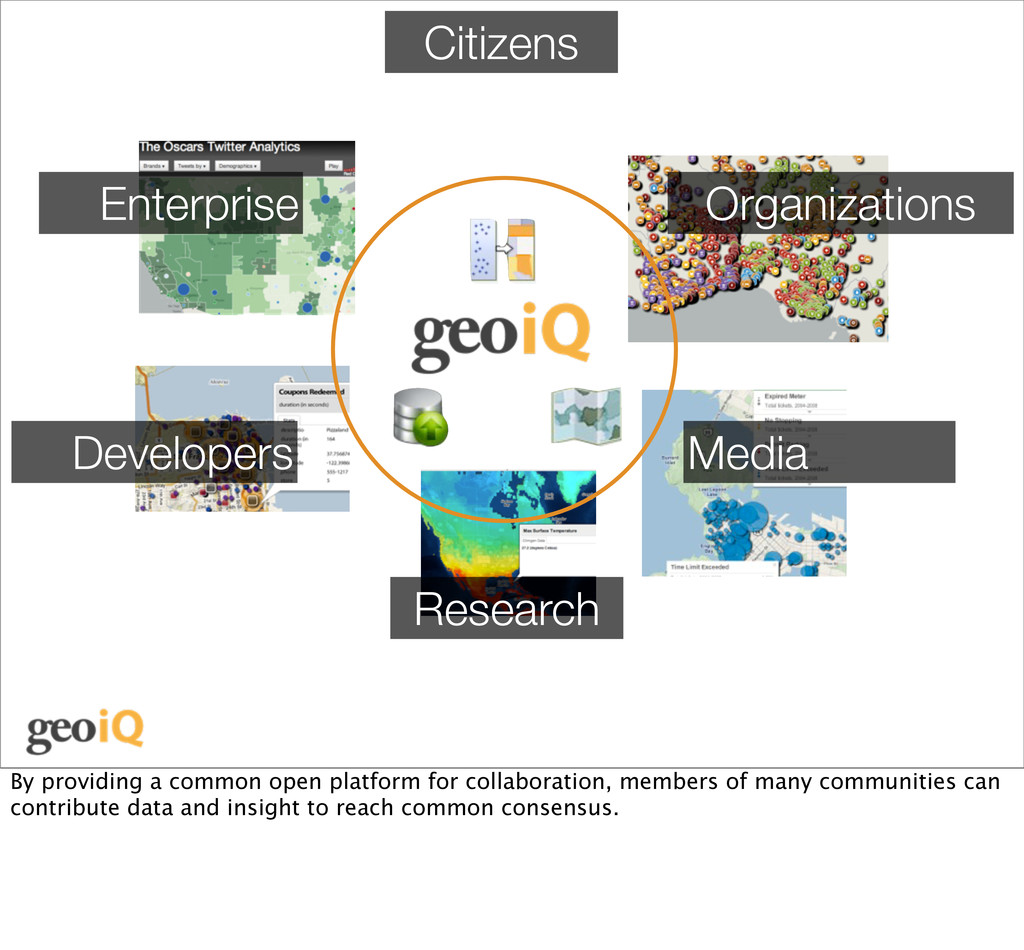
everyone, exploration and collaboration Today this is dramatically different. We’ve spent the past 6 years building tools and capability for anyone to quickly and effectively access their data and devise actionable information. By leveraging the web and modern, emergent technology and an open-architecture it’s now possible to provide advanced tools to everyone - opening the conversation to easily enable collaboration when it’s needed most.
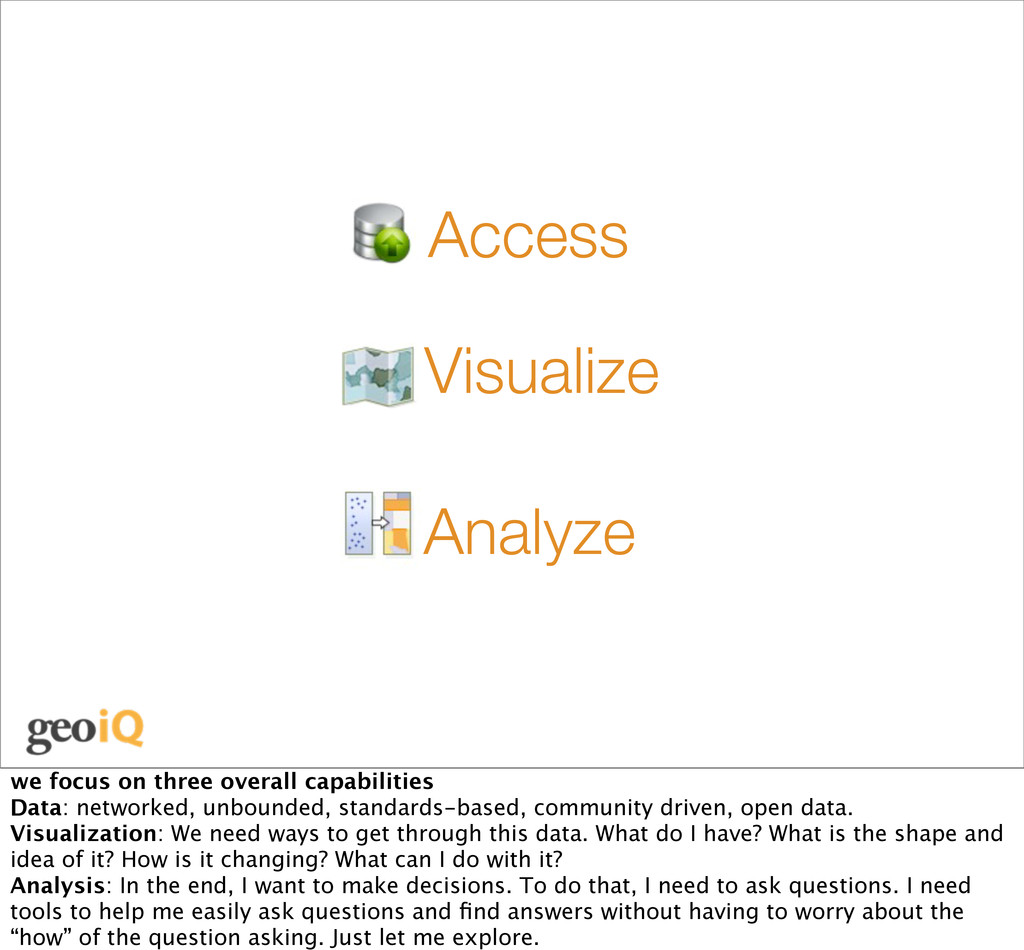
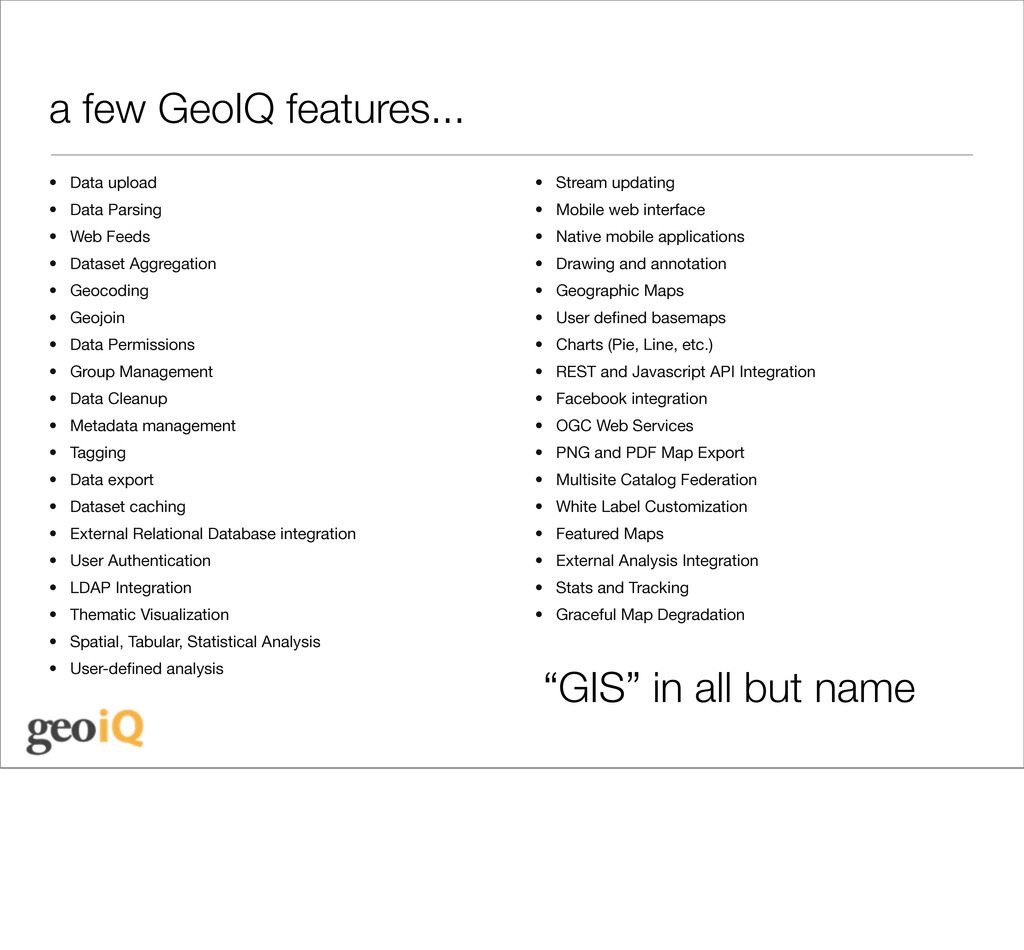
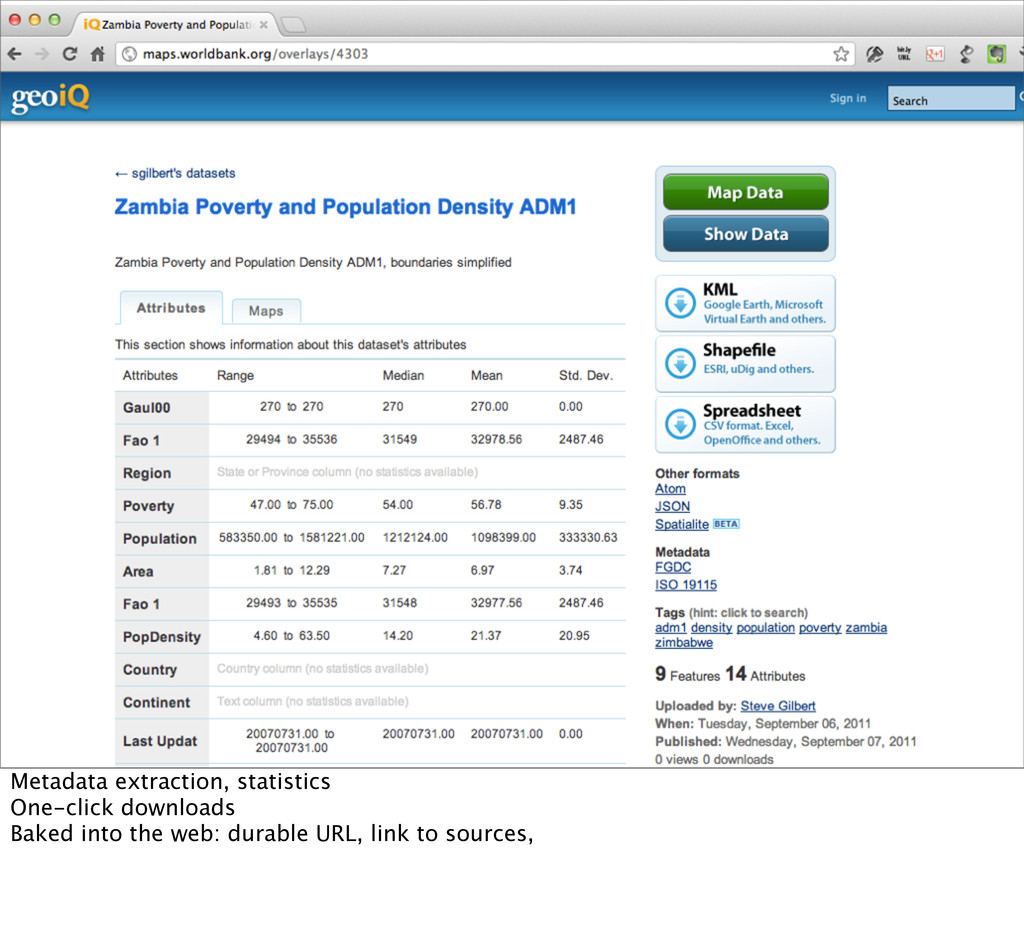
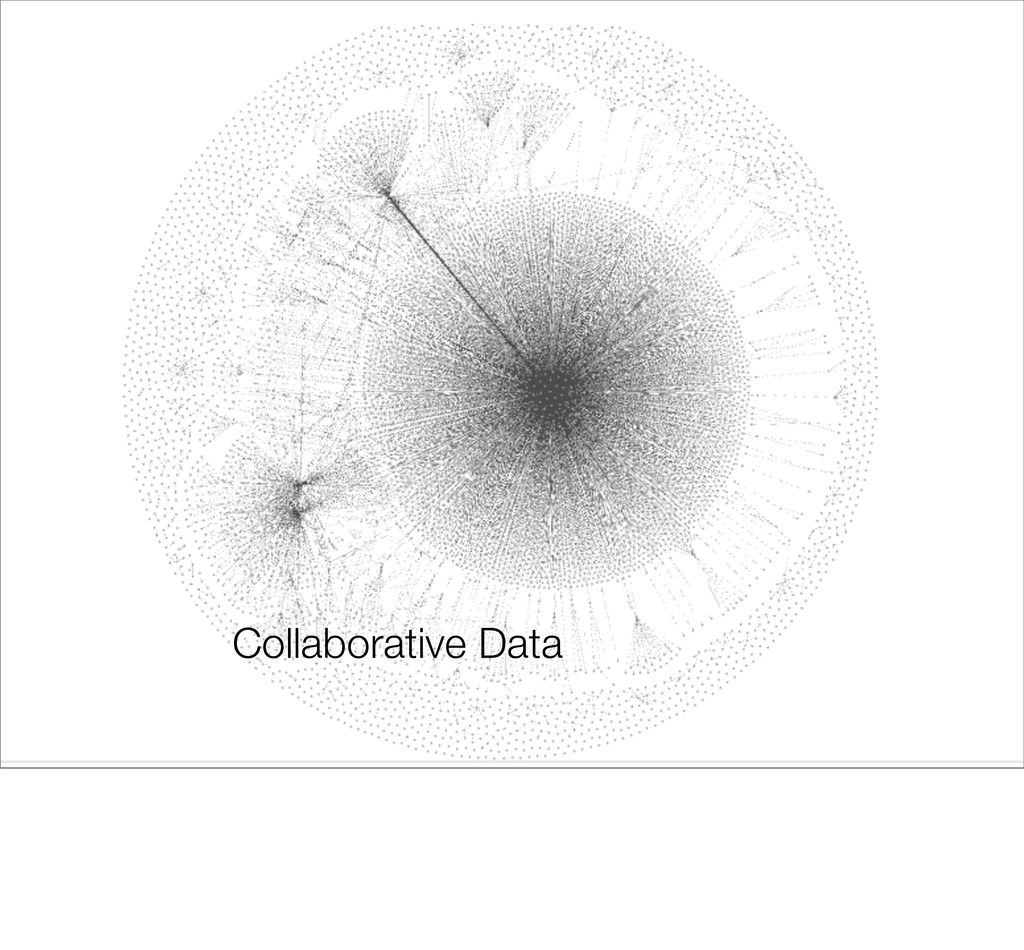
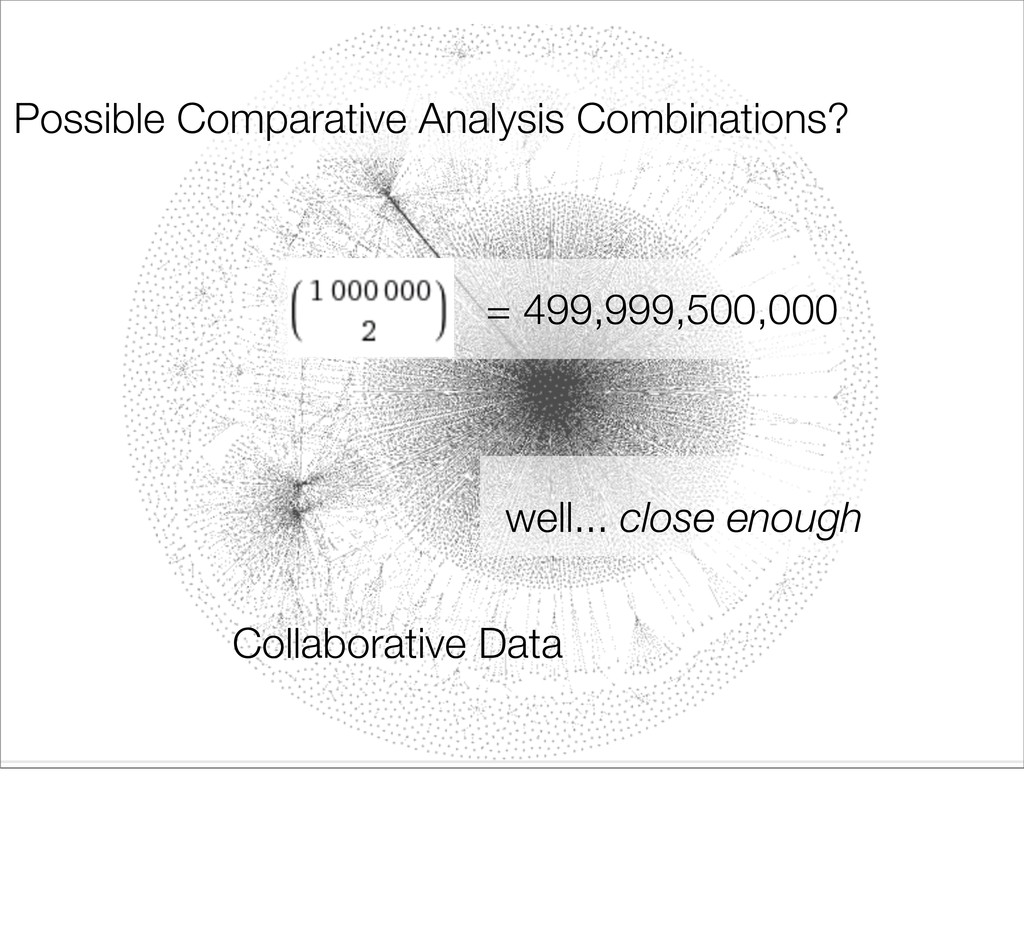
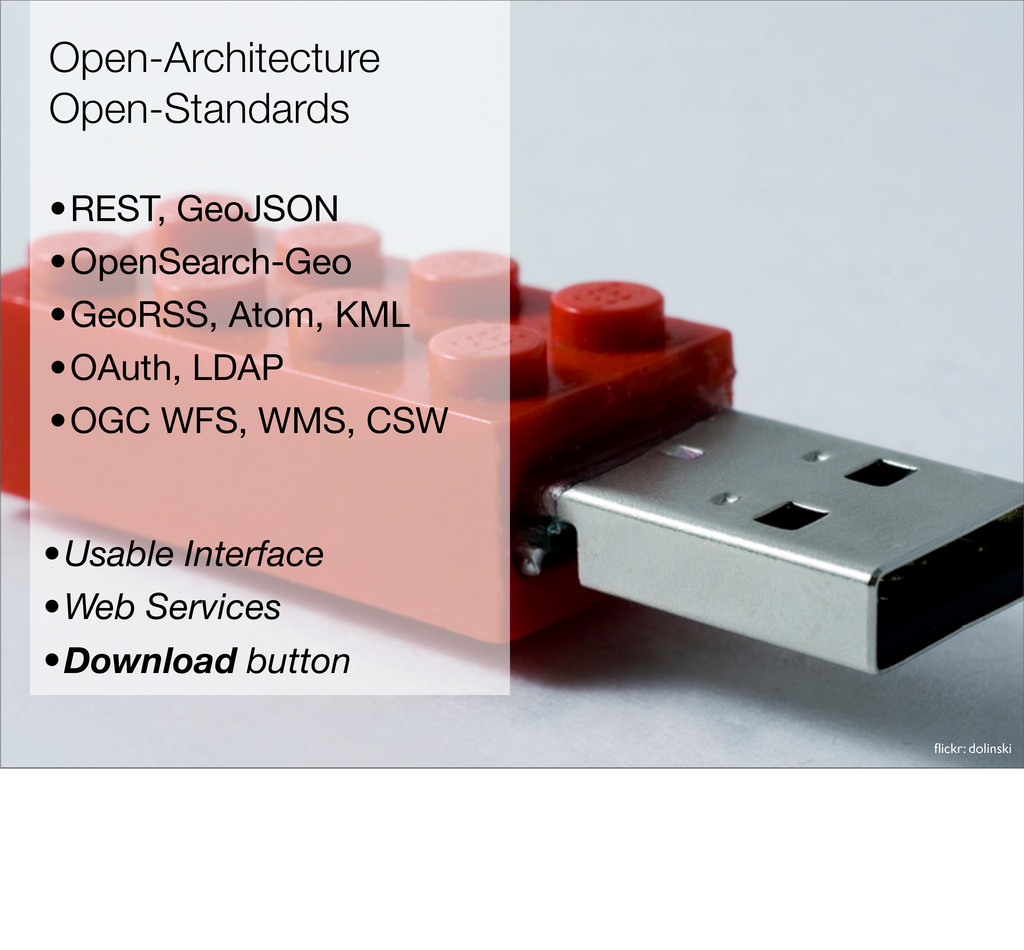
networked, unbounded, standards-based, community driven, open data. Visualization: We need ways to get through this data. What do I have? What is the shape and idea of it? How is it changing? What can I do with it? Analysis: In the end, I want to make decisions. To do that, I need to ask questions. I need tools to help me easily ask questions and find answers without having to worry about the “how” of the question asking. Just let me explore.
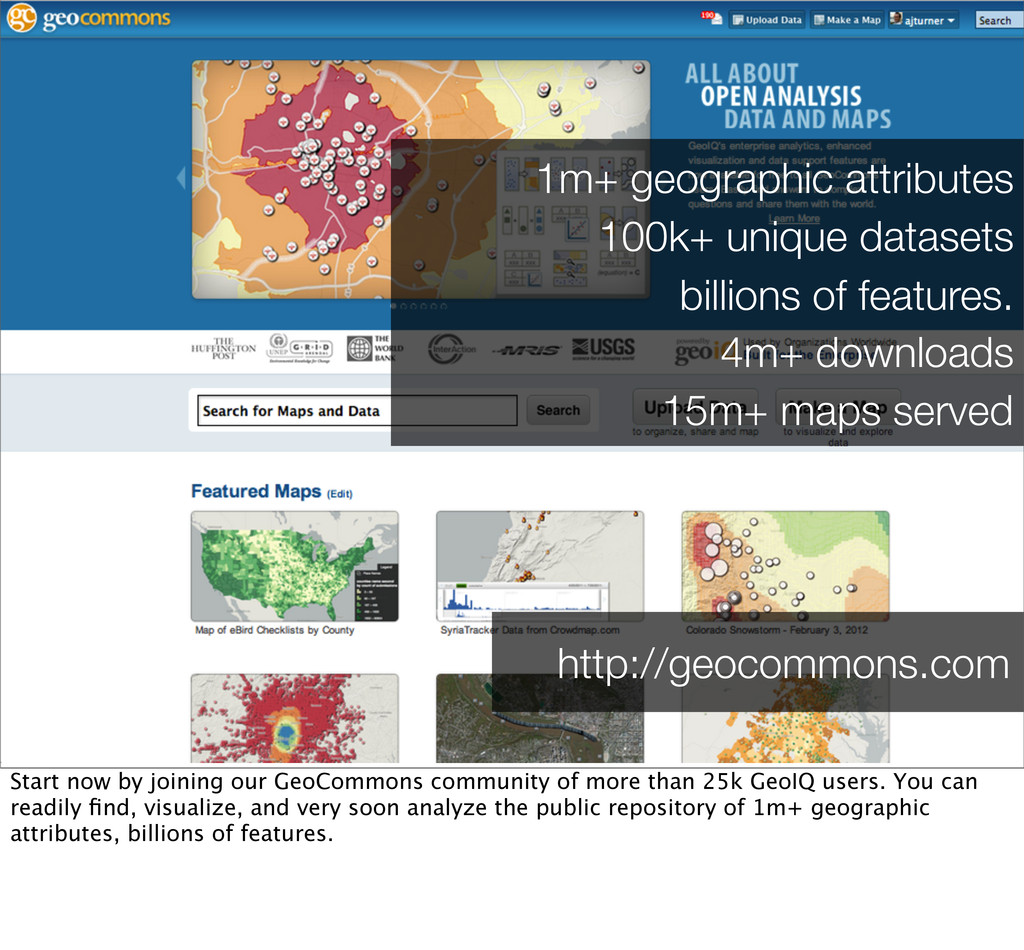
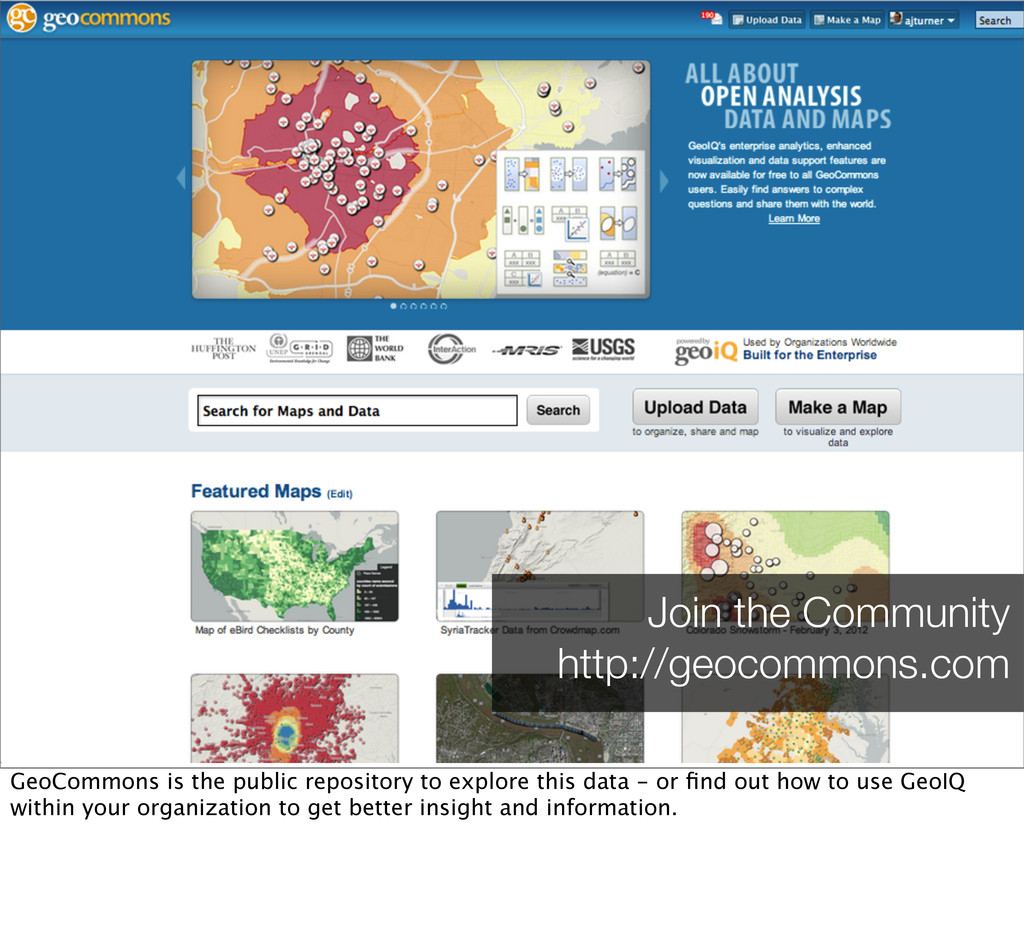
4m+ downloads 1m+ geographic attributes Start now by joining our GeoCommons community of more than 25k GeoIQ users. You can readily find, visualize, and very soon analyze the public repository of 1m+ geographic attributes, billions of features.
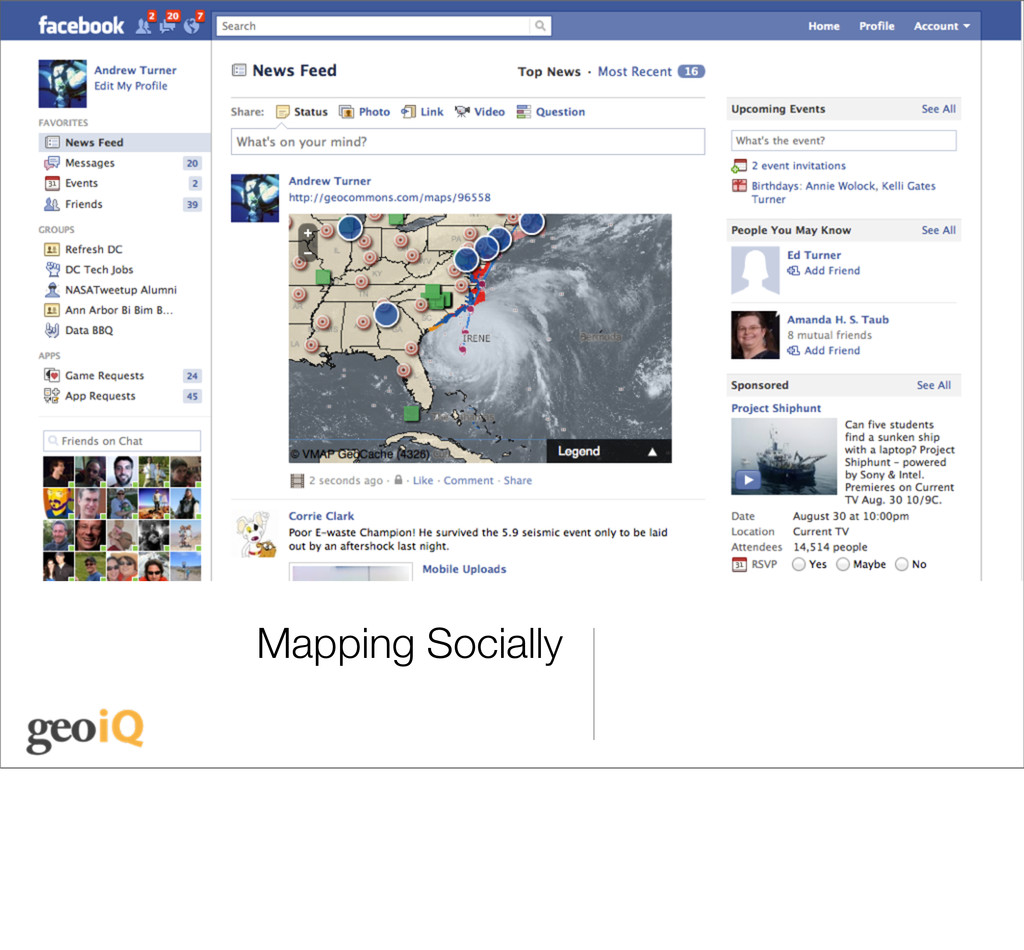
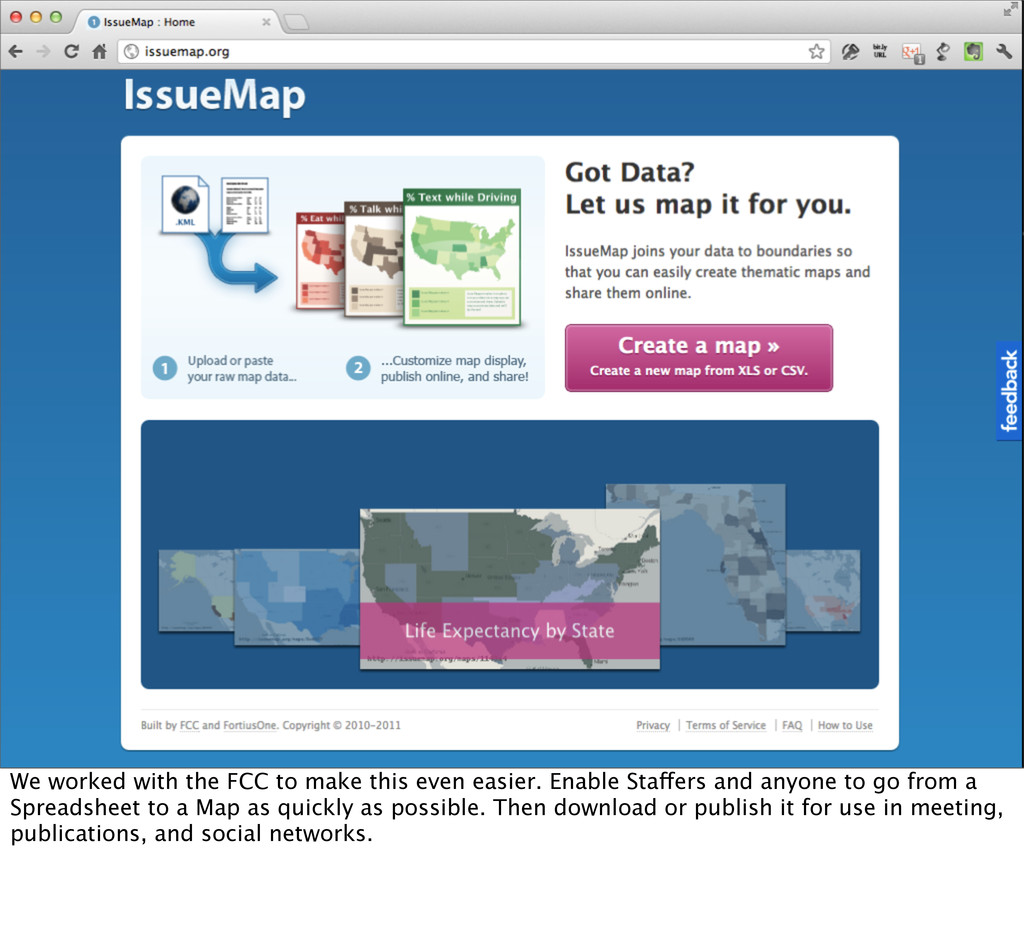
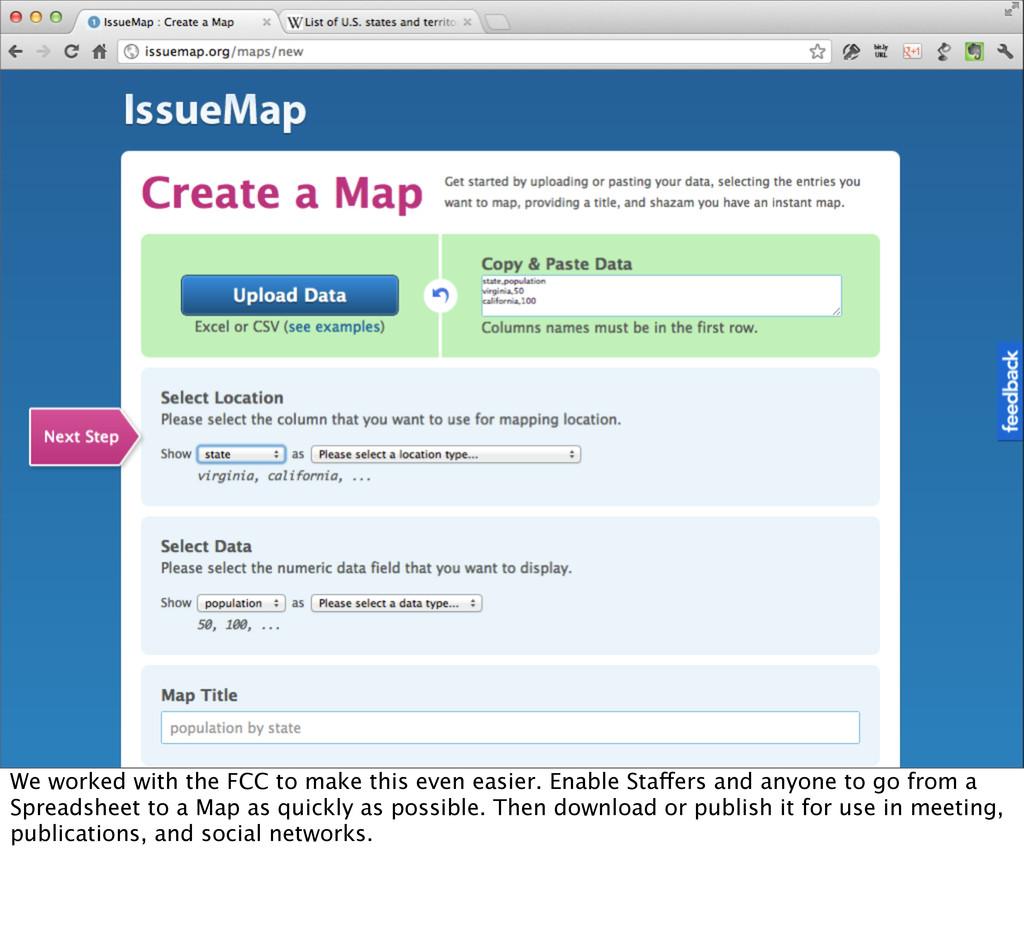
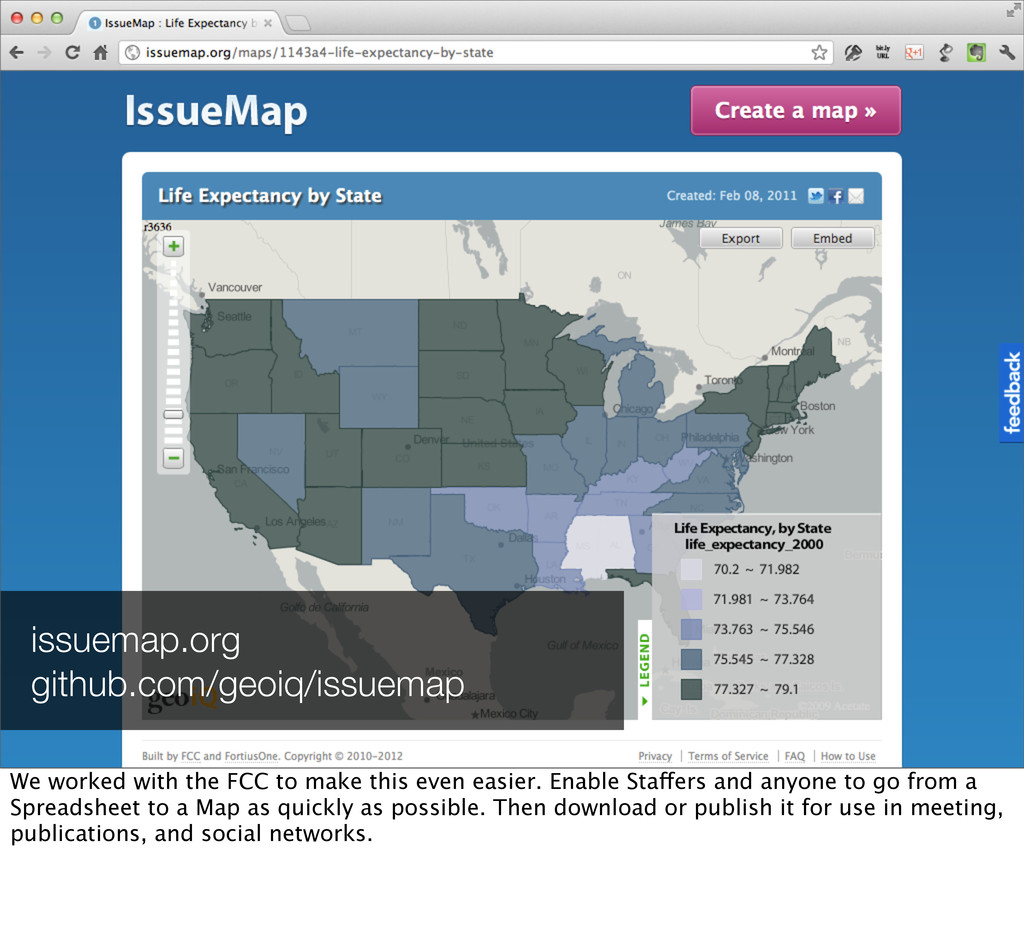
Enable Staffers and anyone to go from a Spreadsheet to a Map as quickly as possible. Then download or publish it for use in meeting, publications, and social networks.
Enable Staffers and anyone to go from a Spreadsheet to a Map as quickly as possible. Then download or publish it for use in meeting, publications, and social networks.
Enable Staffers and anyone to go from a Spreadsheet to a Map as quickly as possible. Then download or publish it for use in meeting, publications, and social networks.
even easier. Enable Staffers and anyone to go from a Spreadsheet to a Map as quickly as possible. Then download or publish it for use in meeting, publications, and social networks.
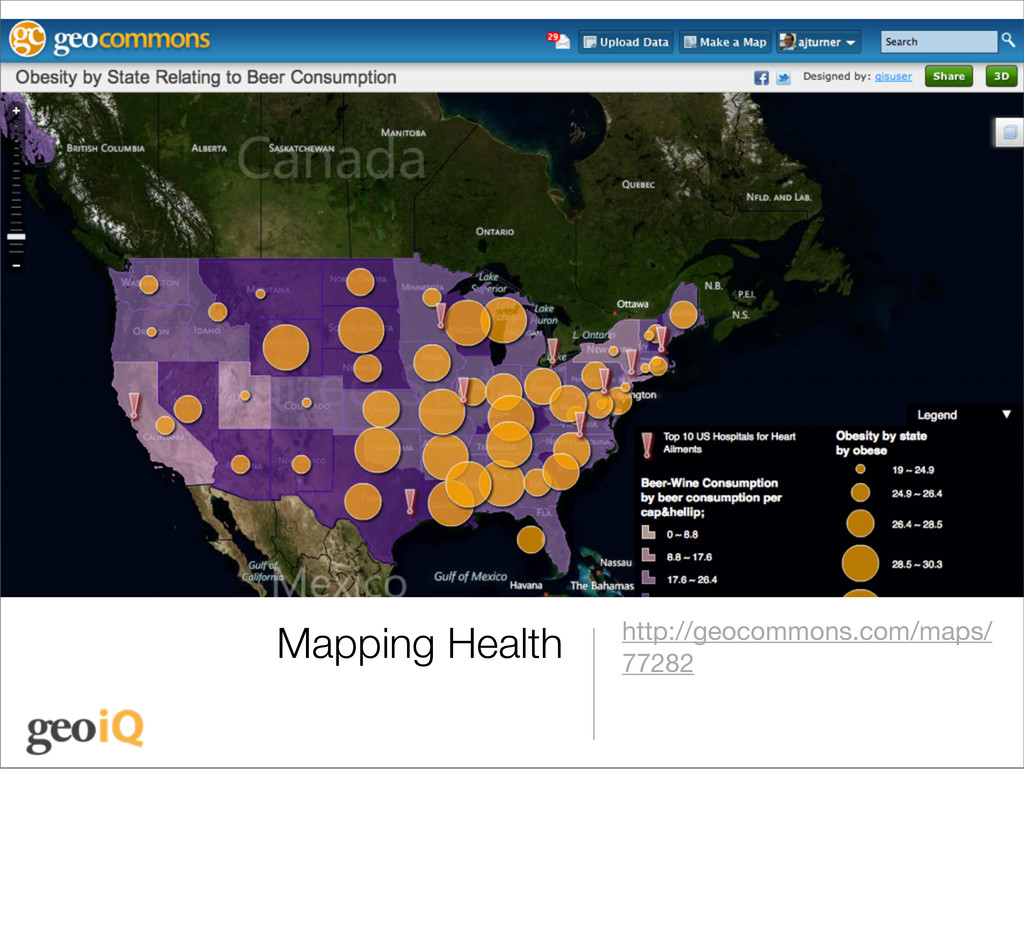
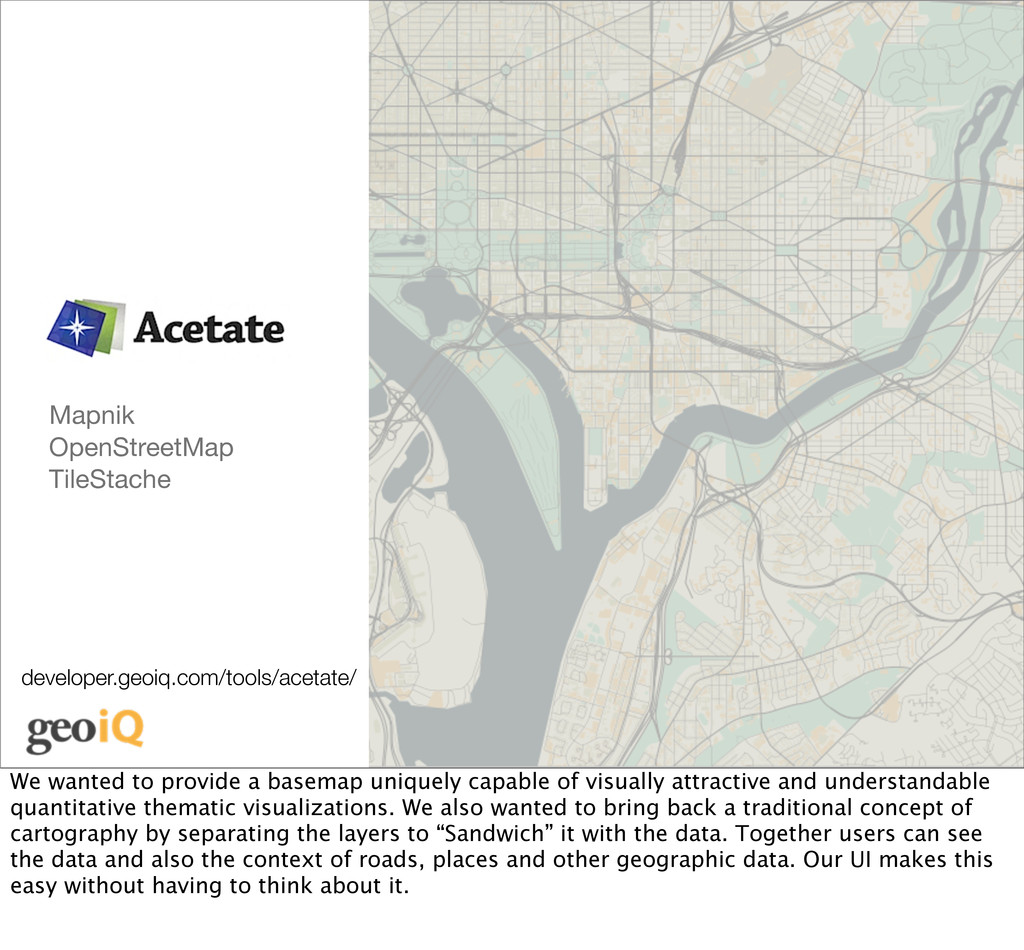
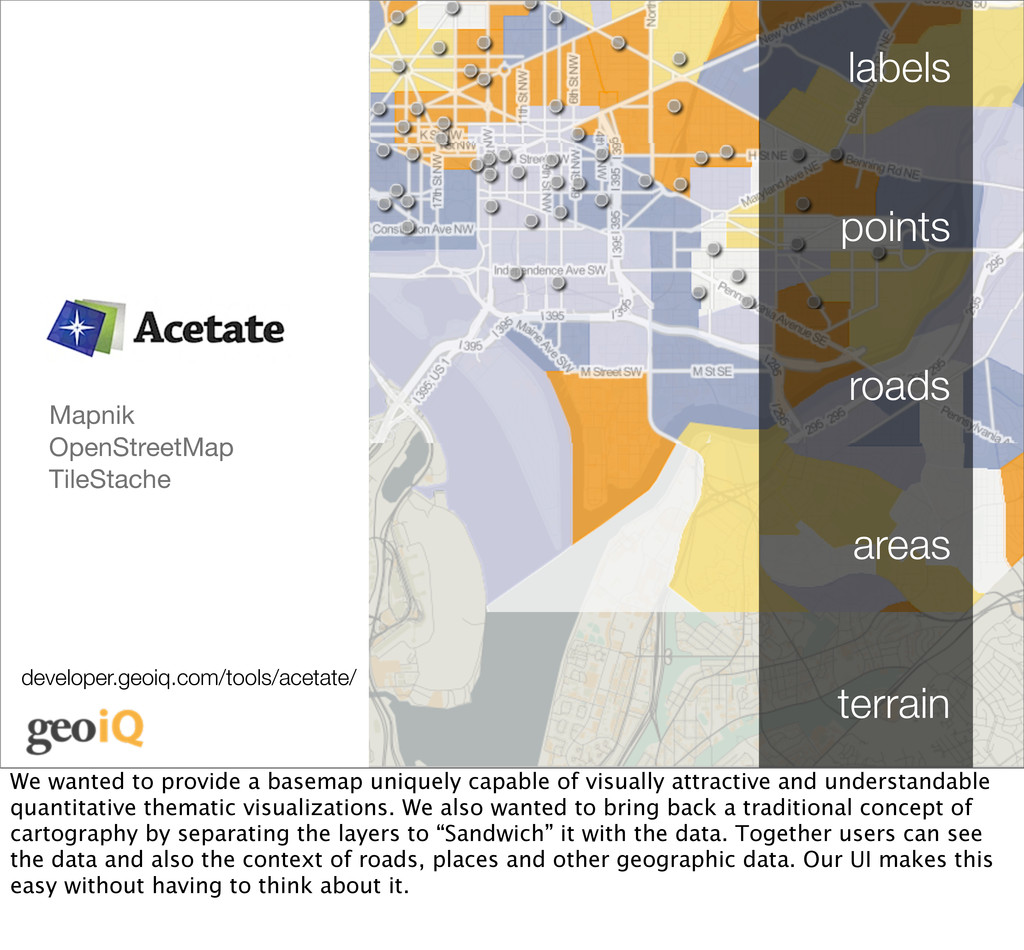
uniquely capable of visually attractive and understandable quantitative thematic visualizations. We also wanted to bring back a traditional concept of cartography by separating the layers to “Sandwich” it with the data. Together users can see the data and also the context of roads, places and other geographic data. Our UI makes this easy without having to think about it.
wanted to provide a basemap uniquely capable of visually attractive and understandable quantitative thematic visualizations. We also wanted to bring back a traditional concept of cartography by separating the layers to “Sandwich” it with the data. Together users can see the data and also the context of roads, places and other geographic data. Our UI makes this easy without having to think about it.
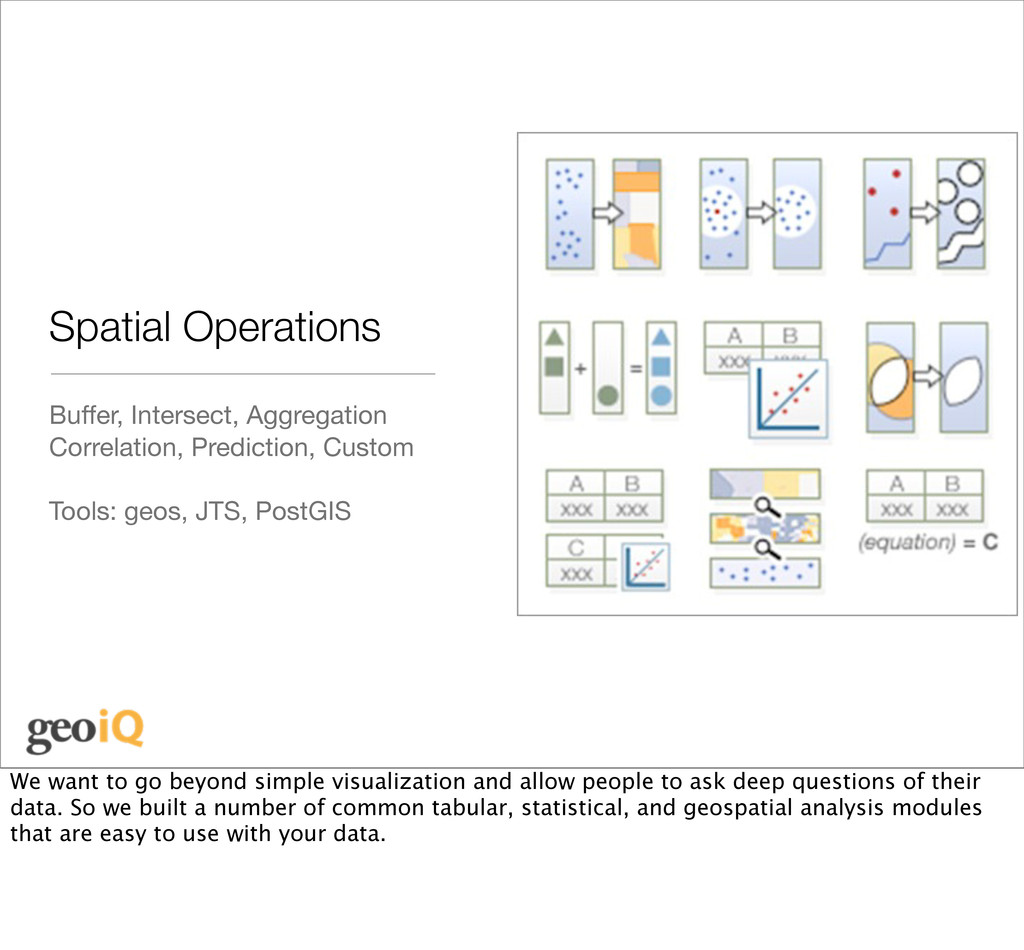
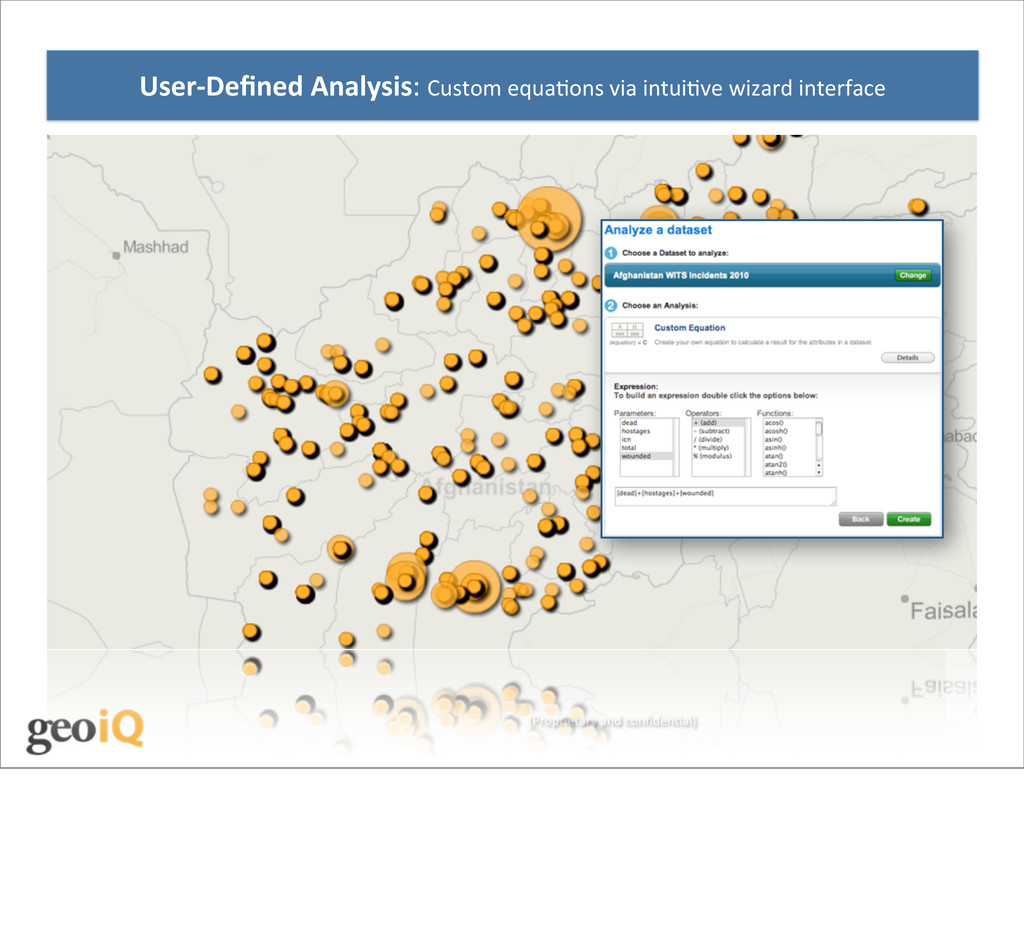
JTS, PostGIS We want to go beyond simple visualization and allow people to ask deep questions of their data. So we built a number of common tabular, statistical, and geospatial analysis modules that are easy to use with your data.
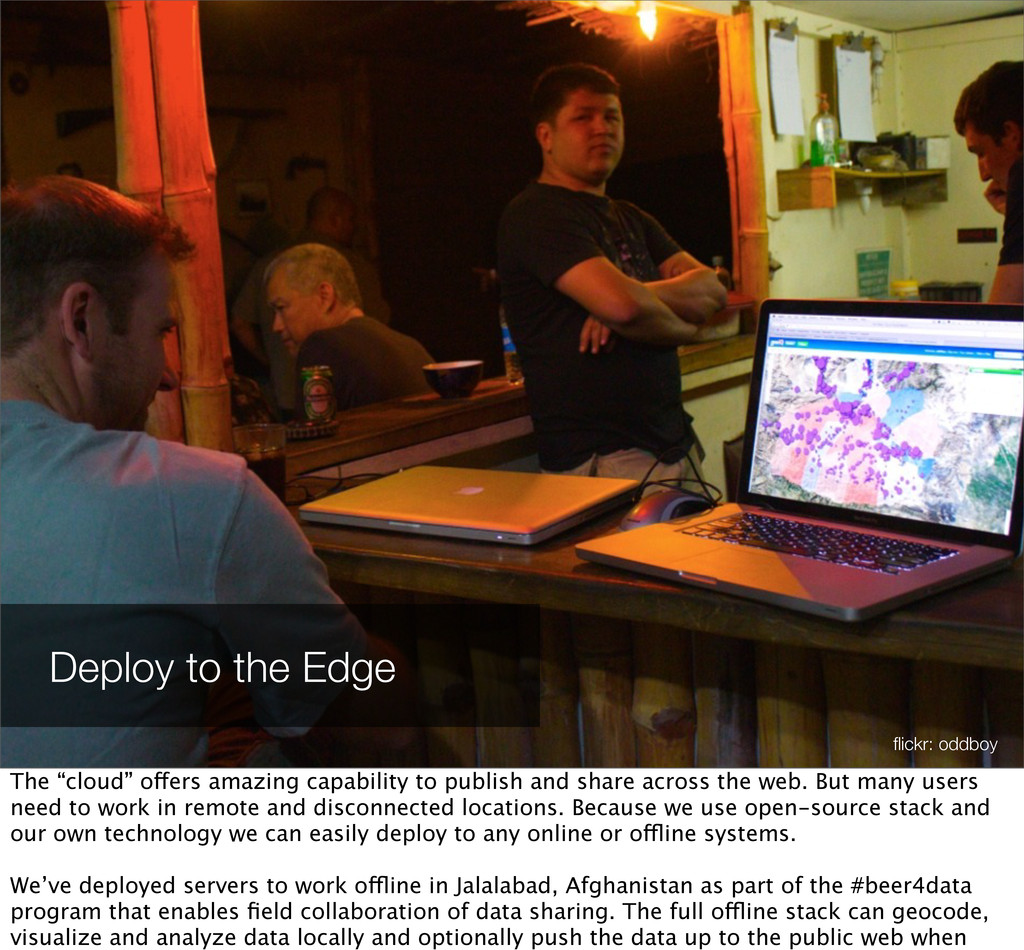
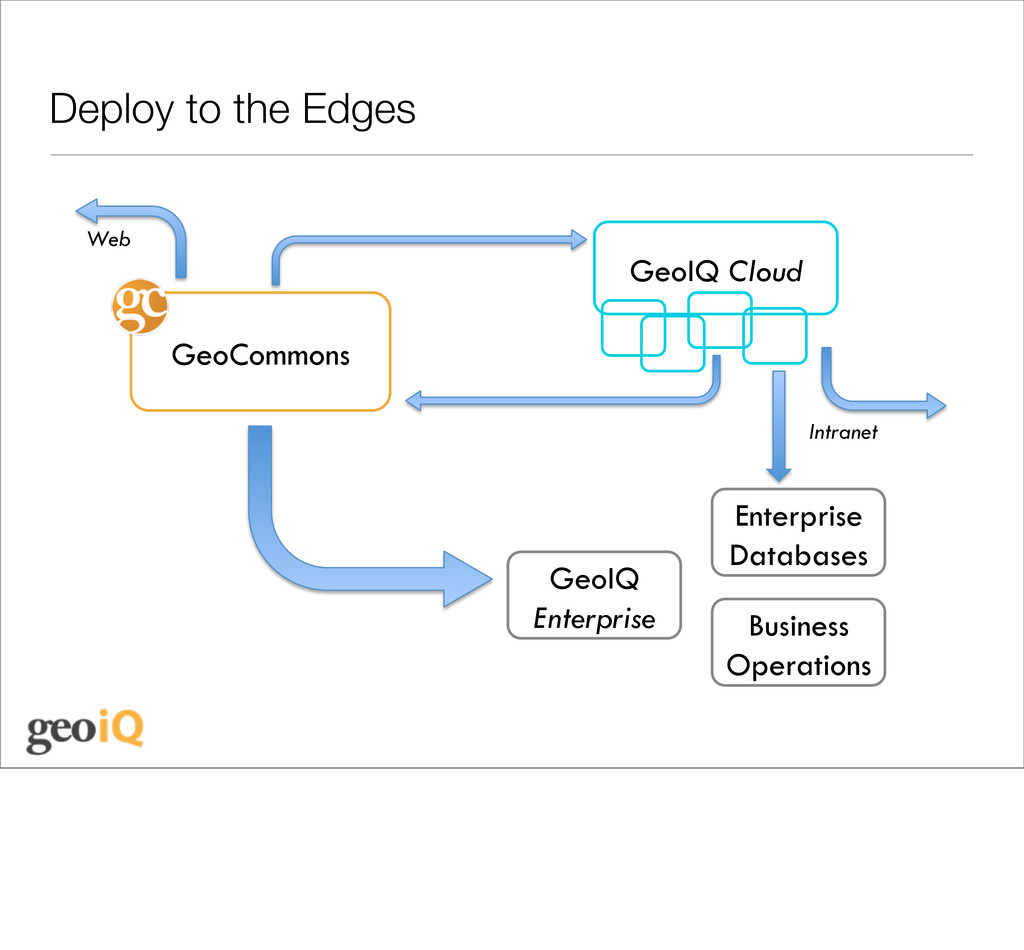
capability to publish and share across the web. But many users need to work in remote and disconnected locations. Because we use open-source stack and our own technology we can easily deploy to any online or offline systems. We’ve deployed servers to work offline in Jalalabad, Afghanistan as part of the #beer4data program that enables field collaboration of data sharing. The full offline stack can geocode, visualize and analyze data locally and optionally push the data up to the public web when
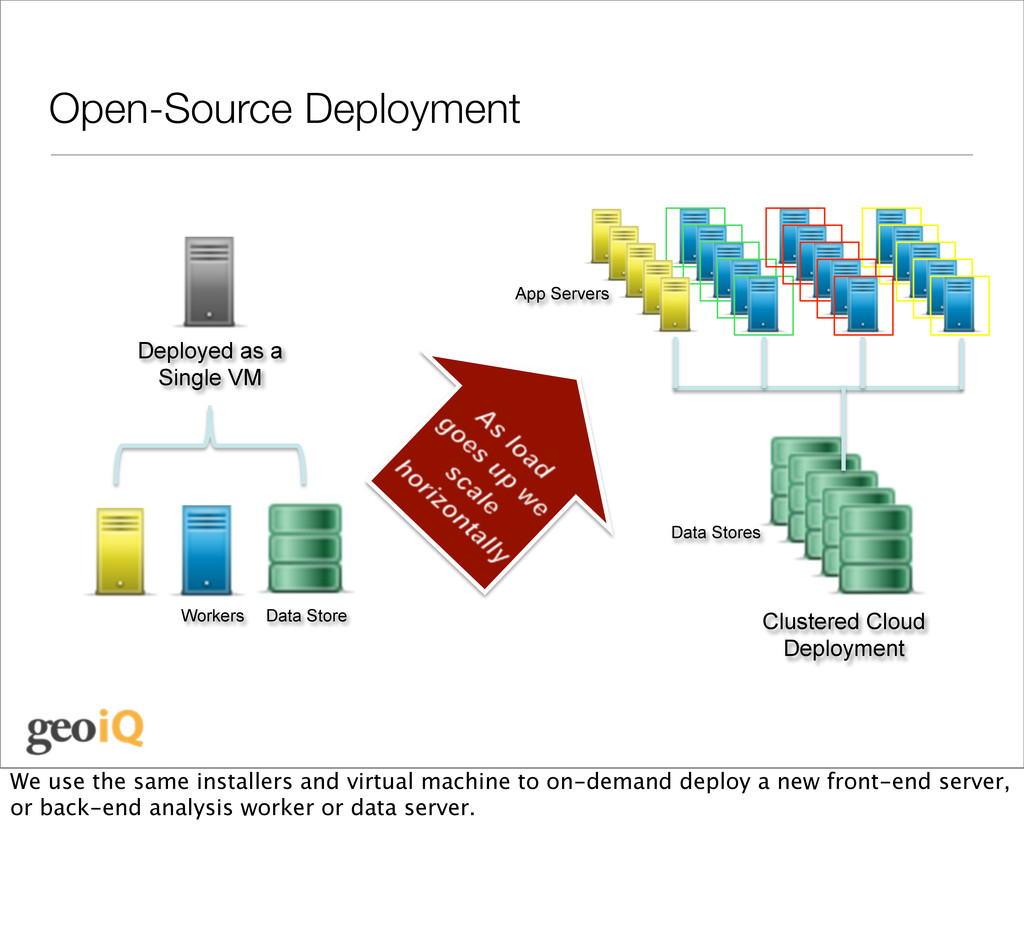
App Servers Data Stores Clustered Cloud Deployment We use the same installers and virtual machine to on-demand deploy a new front-end server, or back-end analysis worker or data server.
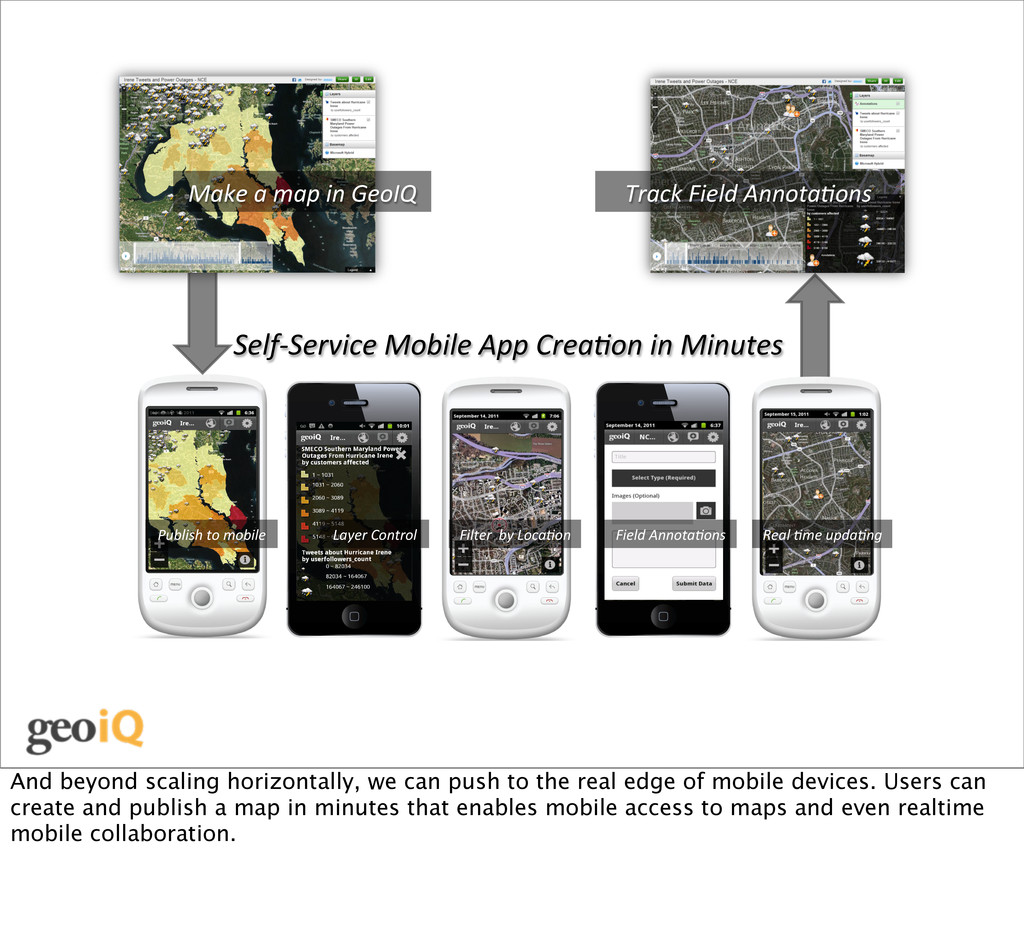
scaling horizontally, we can push to the real edge of mobile devices. Users can create and publish a map in minutes that enables mobile access to maps and even realtime mobile collaboration.
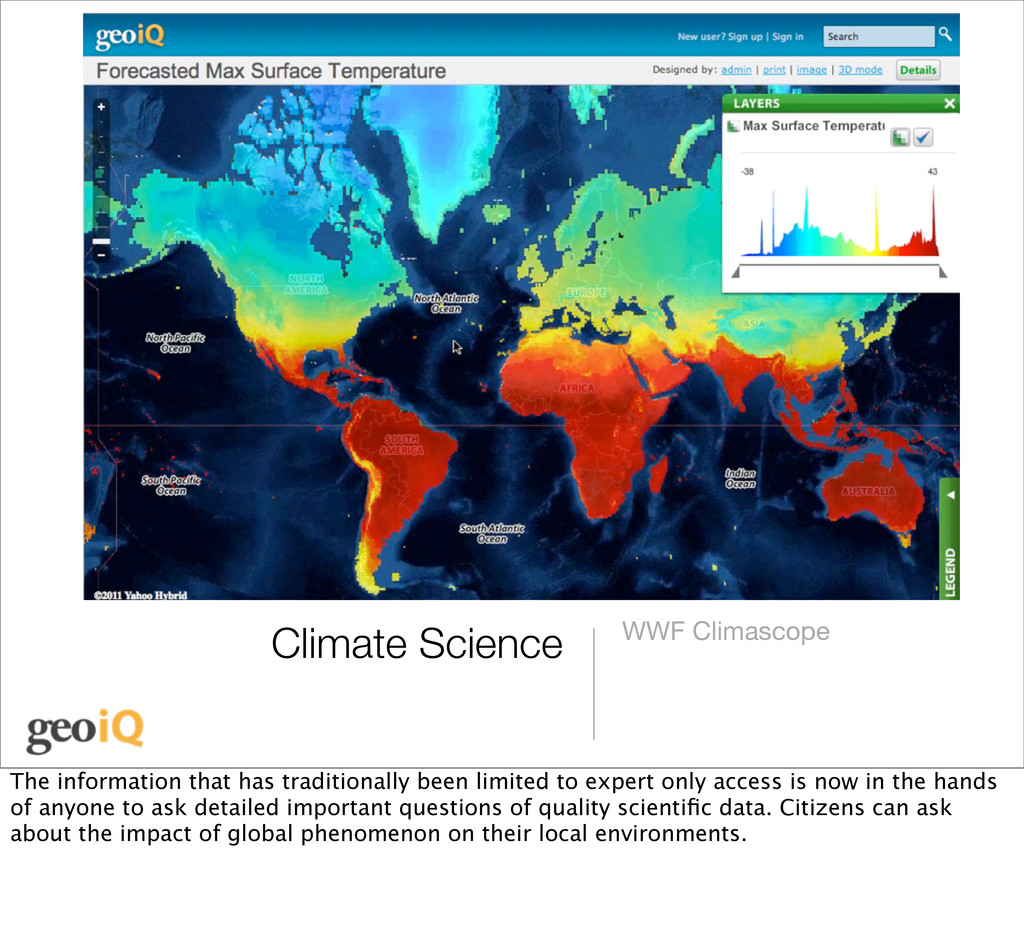
limited to expert only access is now in the hands of anyone to ask detailed important questions of quality scientific data. Citizens can ask about the impact of global phenomenon on their local environments.
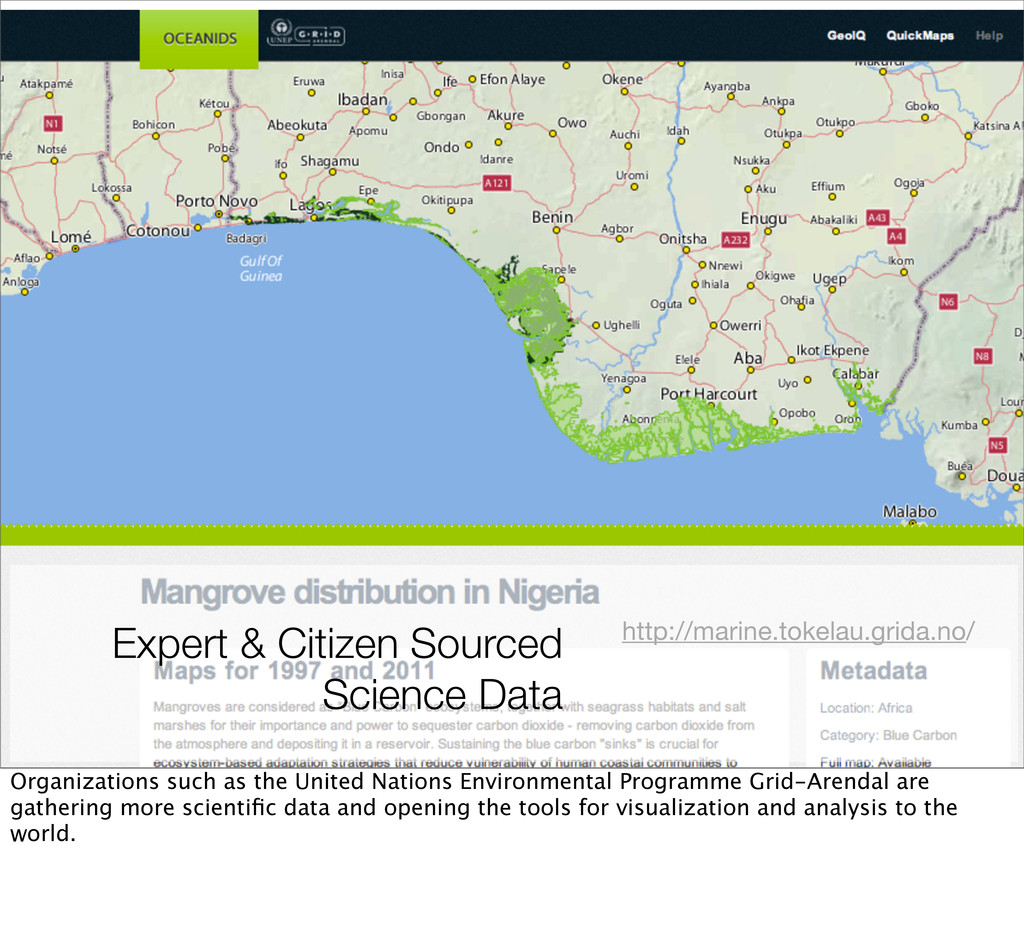
the United Nations Environmental Programme Grid-Arendal are gathering more scientific data and opening the tools for visualization and analysis to the world.
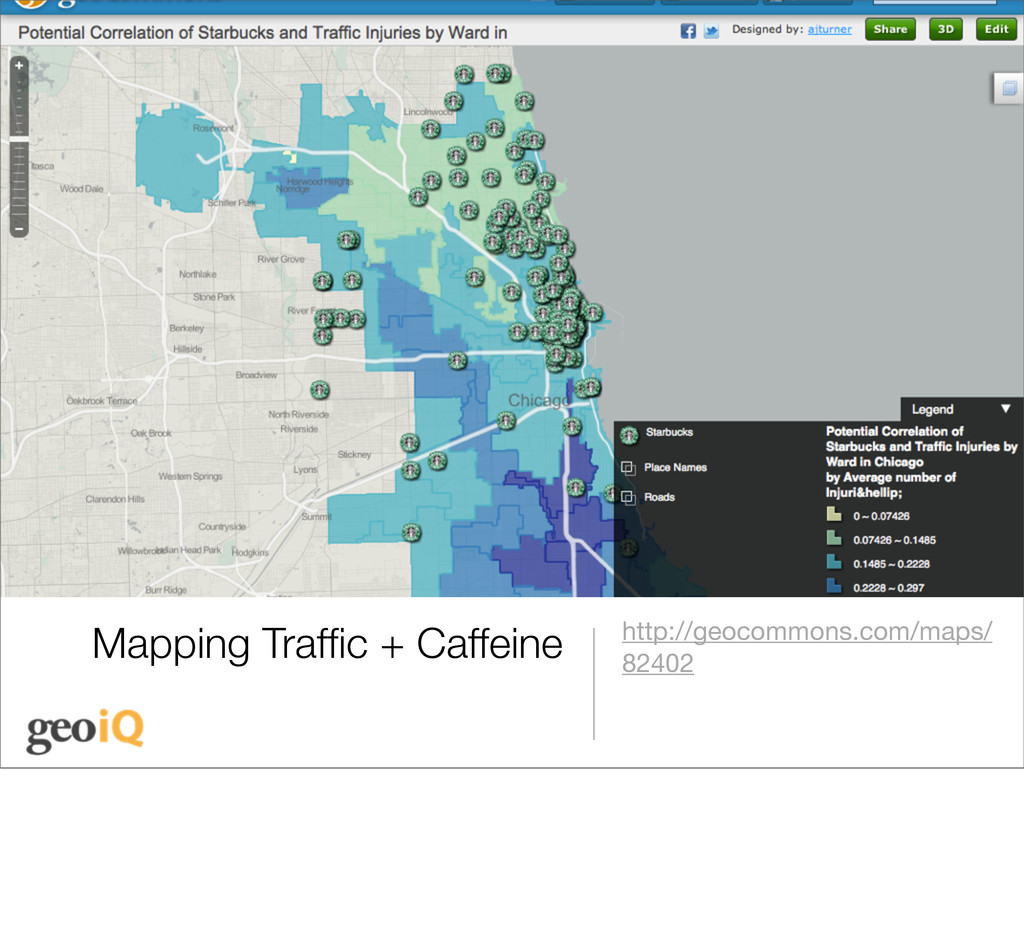
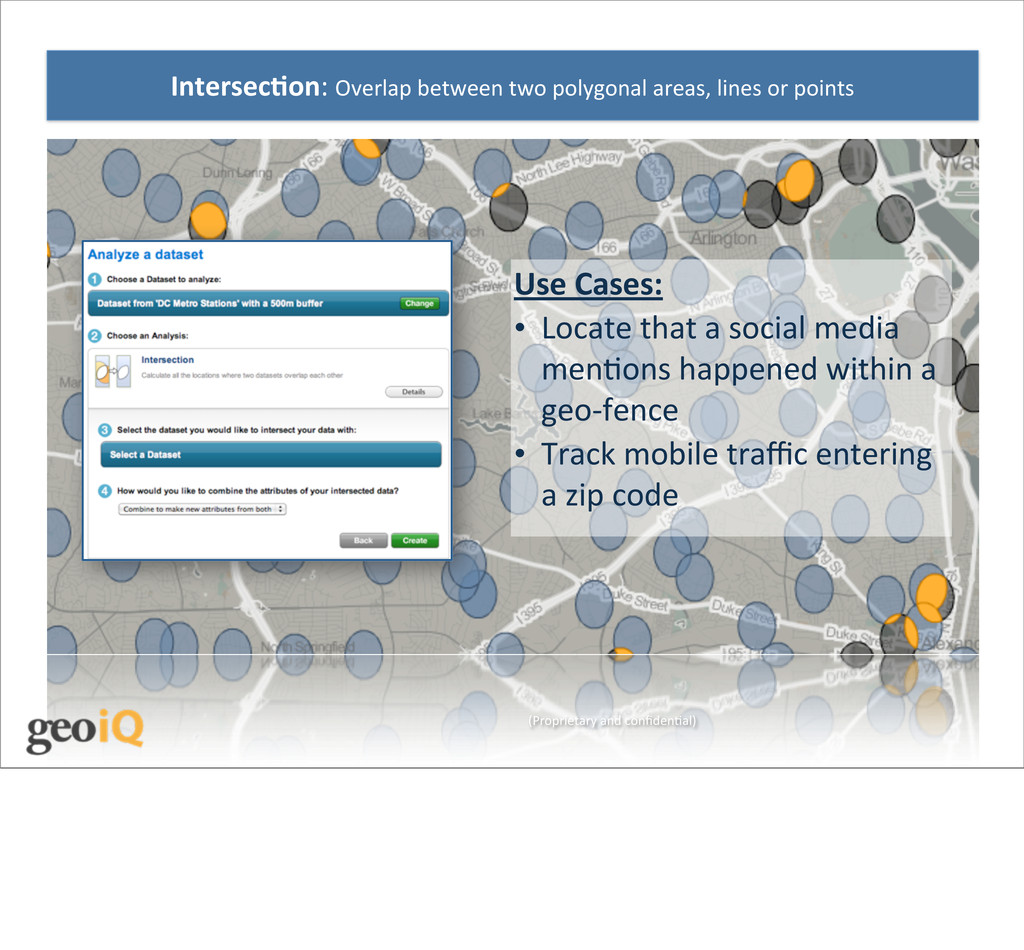
relevant questions on urban planning and society by combining social media information. For example, investigating the crowding and ‘popularity’ of metro transit locations compared with location checkins.