Upgrade to Pro — share decks privately, control downloads, hide ads and more …

Python Performance Profiling

Avatar for Ikram Ali Ikram Ali
November 18, 2018

Python Performance Profiling

Your Python program is too slow, and you need to optimize it. Where do you
start? With the right tools, you can optimize your code where it counts. We’ll
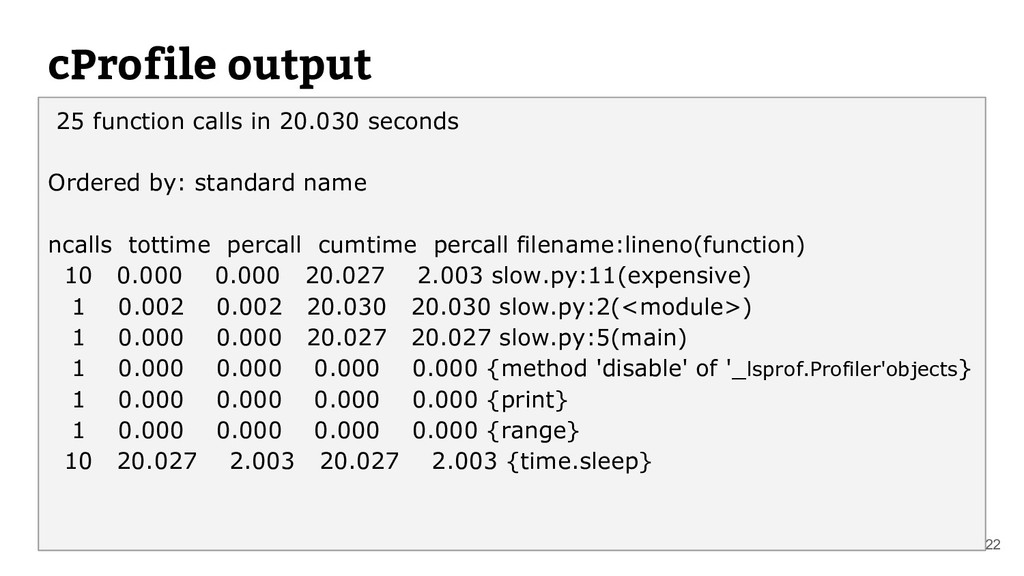
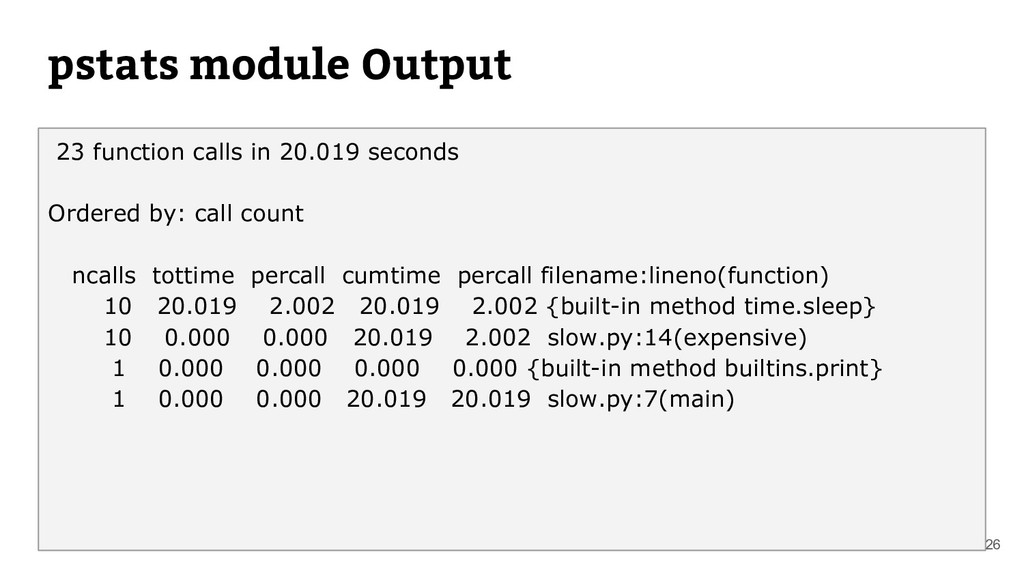
explore the guts of the Python profiler "cProfile" to understand its features and
limitations. We’ll learn how to find the maximum performance wins with minimum
effort.

Avatar for Ikram Ali

Ikram Ali

November 18, 2018
Tweet

Other Decks in Programming

Transcript

  1. 2 HELLO! I am Ikram Ali ➔ Data Scientist @

    Arbisoft ➔ Working on Deep learning projects for Kayak ➔ Github.com/akkefa ➔ Linkedin.com/in/akkefa
  2. Profiling Definition? ➔ Measuring the execution time. ➔ Insight of

    run time performance of a given piece of code. ➔ Frequently used to optimize execution time. ➔ Used to analyze other characteristics such as memory consumption. 4
  3. Why Profile? ➔ Why is this program slow? ➔ Why

    does it slow my computer to a crawl? ➔ What is actually happening when this code executes? ➔ Is there anything I can improve? ➔ How much memory consumed by program? ➔ How much time taken by each function execution? You can use a profiler to answer questions like these: 6
  4. 7 Why You should care about Performance ➔ “If You

    Can’t Measure It, You Can’t Manage It.” ➔ Writing efficient code saves money in modern "cloud economy" (e.g. you need fewer VM instances). ➔ Even if you don't use clouds, a particular problem domain can have strict performance requirements (e.g. when you have to process a chunk of data in time before the next chunk arrives).
  5. Available options for measuring Performance 8 ➔ Command Line ➔

    time Module ➔ timeit Module ➔ cProfile Module
  6. Command Line The time command is available in *nix systems.

    $ time python some_program.py 9 real 0m4.536s user 0m3.411s sys 0m0.979s
  7. Command Line ➔ Easy to use 10 PROS ➔ Very

    limited information ➔ Not very deterministic ➔ Not available on Windows CONS
  8. Python time Module Naive approach: time.time() statements import time initial_time

    = time.time() time.sleep(1) final_time = time.time() print('Duration: {}'.format(final_time - initial_time)) Duration: 1.0035021305084229 11
  9. Python time Module ➔ Easy to use ➔ Simple to

    understand 12 PROS ➔ Very limited information ➔ Not very deterministic ➔ Manual code modification and analysis CONS
  10. Python timeit Module import timeit print('Plus:', timeit.timeit("['Hello world: ' +

    str(n) for n in range(100)]", number=1000)) print('Format:', timeit.timeit("['Hello world: {0}'.format(n) for n in range(100)]", number=1000)) print('Percent:', timeit.timeit("['Hello world: %s' % n for n in range(100)]", number=1000)) 13 Better approach: timeit Plus: 0.025120729998889146 Format: 0.03536501300004602 Percent: 0.017073806000553304
  11. timeit Module ➔ Easy to use ➔ Simple to understand

    ➔ Measure execution time of small code snippets 14 PROS ➔ Simple code only ➔ Not very deterministic ➔ Have to manually create runnable code snippets ➔ Manual analysis CONS
  12. cProfile Module 15 Best approach: cProfile ➔ Python comes with

    two profiling tools, profile and cProfile. ➔ Both share the same API, and should act the same. 3 function calls in 0.000 seconds Ordered by: standard name ncalls tottime percall cumtime percall filename:lineno(function) 1 0.000 0.000 0.000 0.000 <string>:1(<module>) 1 0.000 0.000 0.000 0.000 {method 'disable' of '_lsprof.Profiler'} >>> import cProfile >>> cProfile.run('2 + 2')
  13. Running a script with cProfile 16 # slow.py import time

    def main(): sum = 0 for i in range(10): sum += expensive(i // 2) return sum def expensive(t): time.sleep(t) return t if __name__ == '__main__': print(main())
  14. 17 25 function calls in 20.030 seconds Ordered by: standard

    name ncalls tottime percall cumtime percall filename:lineno(function) 10 0.000 0.000 20.027 2.003 slow.py:11(expensive) 1 0.002 0.002 20.030 20.030 slow.py:2(<module>) 1 0.000 0.000 20.027 20.027 slow.py:5(main) 1 0.000 0.000 0.000 0.000 {method 'disable' of '_lsprof.Profiler'objects} 1 0.000 0.000 0.000 0.000 {print} 1 0.000 0.000 0.000 0.000 {range} 10 20.027 2.003 20.027 2.003 {time.sleep} python -m cProfile slow.py
  15. cProfile sort by options For the number of calls 18

    ncalls for the total time spent in the given function tottime is the quotient of tottime divided by ncalls percall is the cumulative time spent in this and all subfunctions. cumtime is the quotient of cumtime divided by primitive calls percall filename:lineno(function) provides the respective data of each function
  16. cProfile result sorted by tottime 25 function calls in 20.015

    seconds Ordered by: internal time ncalls tottime percall cumtime percall filename:lineno(function) 10 20.015 2.001 20.015 2.001 {built-in method time.sleep} 1 0.000 0.000 0.000 0.000 {built-in method builtins.print} 1 0.000 0.000 20.015 20.015 slow.py:6(main) 10 0.000 0.000 20.015 2.001 slow.py:13(expensive) 1 0.000 0.000 20.015 20.015 slow.py:3(<module>) 1 0.000 0.000 20.015 20.015 {built-in method builtins.exec} 1 0.000 0.000 0.000 0.000 {method 'disable' of '_lsprof.Profiler' objects} 19 python -m cProfile -s tottime slow.py
  17. cProfile result sorted by ncalls 25 function calls in 20.015

    seconds Ordered by: call count ncalls tottime percall cumtime percall filename:lineno(function) 10 20.020 2.002 20.020 2.002 {built-in method time.sleep} 10 0.000 0.000 20.020 2.002 slow.py:13(expensive) 1 0.000 0.000 20.020 20.020 {built-in method builtins.exec} 1 0.000 0.000 0.000 0.000 {built-in method builtins.print} 1 0.000 0.000 20.020 20.020 slow.py:6(main) 1 0.000 0.000 20.020 20.020 slow.py:3(<module>) 1 0.000 0.000 0.000 0.000 {method 'disable' of '_lsprof.Profiler' objects} 20 python -m cProfile -s ncalls slow.py
  18. Easiest way to profile Python code 21 def main(): sum

    = 0 for i in range(10): sum += expensive(i // 2) return sum def expensive(t): time.sleep(t) return t if __name__ == '__main__': pr = cProfile.Profile() pr.enable() main() pr.disable() pr.print_stats()
  19. 22 25 function calls in 20.030 seconds Ordered by: standard

    name ncalls tottime percall cumtime percall filename:lineno(function) 10 0.000 0.000 20.027 2.003 slow.py:11(expensive) 1 0.002 0.002 20.030 20.030 slow.py:2(<module>) 1 0.000 0.000 20.027 20.027 slow.py:5(main) 1 0.000 0.000 0.000 0.000 {method 'disable' of '_lsprof.Profiler'objects} 1 0.000 0.000 0.000 0.000 {print} 1 0.000 0.000 0.000 0.000 {range} 10 20.027 2.003 20.027 2.003 {time.sleep} cProfile output
  20. 23 We can also save the output! if __name__ ==

    '__main__': pr = cProfile.Profile() pr.enable() main() pr.disable() pr.dump_stats("profile.output")
  21. pstats Module 25 ➔ You can use pstats to format

    the output in various ways. ➔ pstats provides sorting options. ( calls, time, cumulative ) import pstats p = pstats.Stats("profile.output") p.strip_dirs().sort_stats("calls").print_stats()
  22. 26 23 function calls in 20.019 seconds Ordered by: call

    count ncalls tottime percall cumtime percall filename:lineno(function) 10 20.019 2.002 20.019 2.002 {built-in method time.sleep} 10 0.000 0.000 20.019 2.002 slow.py:14(expensive) 1 0.000 0.000 0.000 0.000 {built-in method builtins.print} 1 0.000 0.000 20.019 20.019 slow.py:7(main) pstats module Output
  23. SNAKEVIZ 28 pip install snakeviz ➔ Snakeviz provides two ways

    to explore profiler data ➔ Summaries Times ➔ You can choose the sorting criterion in the output table $ snakeviz profile.output
  24. PyCallGraph 30 pip install pycallgraph ➔ Visual extension of cProfile.

    ➔ Understand code structure and Flow ➔ Summaries Times ➔ Darker color represent more time spent. $ pycallgraph graphviz -- python slow.py
  25. Other profiling options 31 ➔ line_profiler will profile the time

    individual lines of code take to execute. ➔ https://github.com/rkern/line_profiler Line profiler ➔ Monitoring memory consumption of a process. ➔ line-by-line analysis of memory consumption. ➔ https://pypi.org/project/memory_profiler/ Memory profiler