the odds here, but I bet every one of you works on a computer program with bugs. Hi, I’m Alex Gaynor, and I’m a software engineer, which is an ancient phrase meaning, “Person who types bugs into a computer”. This talk is about grappling with the reality of our fallibility.
Source contributor • Django, PyPy, CPython, pyca/cryptography, etc. • Washington D.C. resident • Bagel and Deli fan (Also US government employee, nothing I say represents the views of my employer, if you liked yesterday’s keynote please come and talk to me about it)
one thing this talk is not going to cover. How to deal with hard social problems. This talk is about *technical* problems. If you have a social problem, you need a different talk.
what does that even mean? To me it means “problems where my usual techniques aren’t working” — often this means things that take more than 15 minutes or so to debug. If you’re debugging something relatively straightforward, an AttributeError or something, doing what you do today is probably fine — it’s not worth adopting anything new, the best thing you can do is stay in your normal flow. The debugging techniques I’m going to talk about *will break your flow* they are for problems you cannot solve any other way.
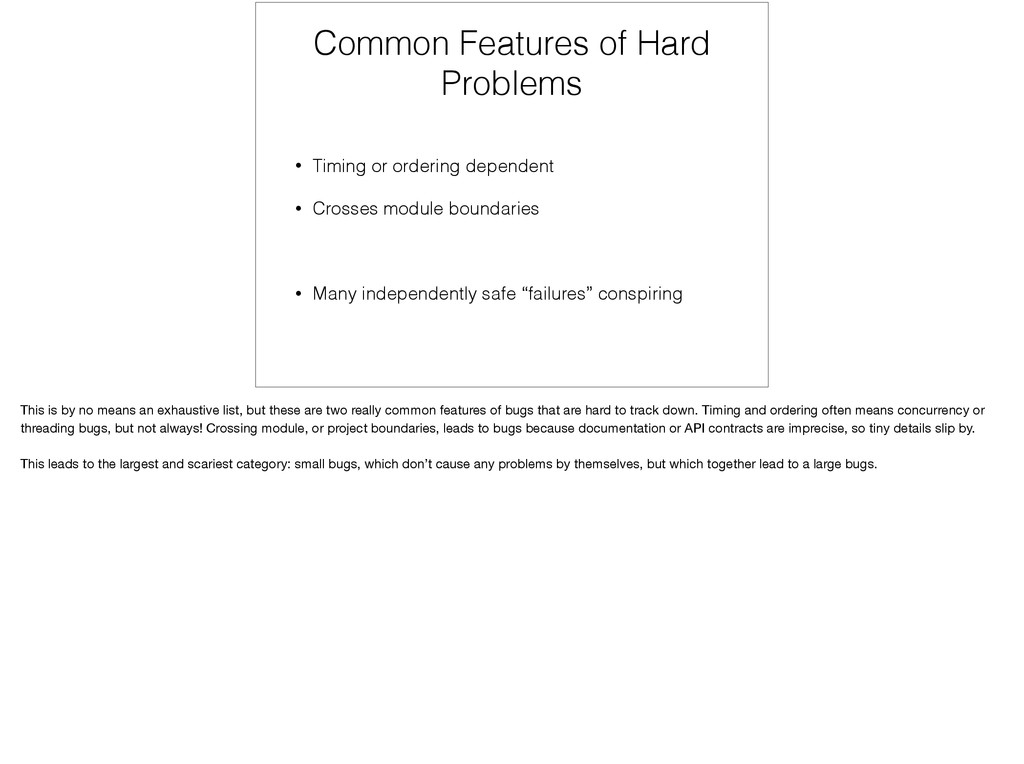
• Crosses module boundaries • Many independently safe “failures” conspiring This is by no means an exhaustive list, but these are two really common features of bugs that are hard to track down. Timing and ordering often means concurrency or threading bugs, but not always! Crossing module, or project boundaries, leads to bugs because documentation or API contracts are imprecise, so tiny details slip by. This leads to the largest and scariest category: small bugs, which don’t cause any problems by themselves, but which together lead to a large bugs.
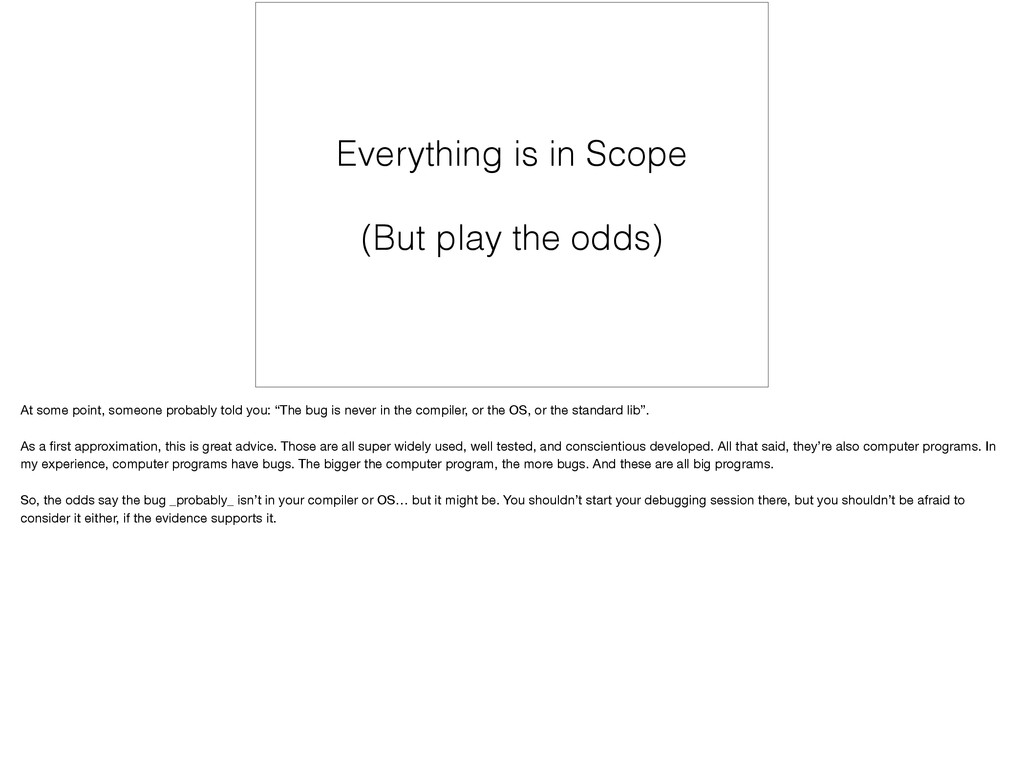
point, someone probably told you: “The bug is never in the compiler, or the OS, or the standard lib”. As a first approximation, this is great advice. Those are all super widely used, well tested, and conscientious developed. All that said, they’re also computer programs. In my experience, computer programs have bugs. The bigger the computer program, the more bugs. And these are all big programs. So, the odds say the bug _probably_ isn’t in your compiler or OS… but it might be. You shouldn’t start your debugging session there, but you shouldn’t be afraid to consider it either, if the evidence supports it.
whether prose or auto-generated, is nice (and essential, please write docs!), but source code is king. When you’re working on a hard bug, there’s a good chance it’s because of subtle behavior, the kind of stuff that isn’t actually documented. The only way you’ll find it is to read the source. And don’t stop at reading your own source code. Read your library’s source code, read your language’s source code, read anything you can get your hands on. Get a shovel and dig.
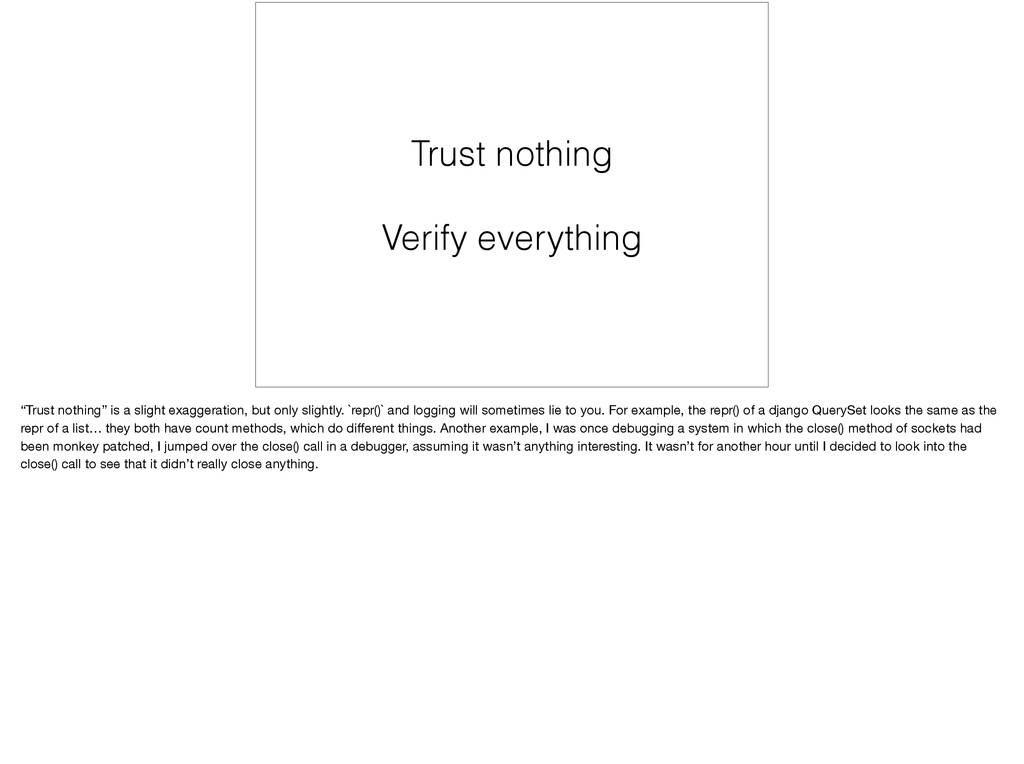
but only slightly. `repr()` and logging will sometimes lie to you. For example, the repr() of a django QuerySet looks the same as the repr of a list… they both have count methods, which do different things. Another example, I was once debugging a system in which the close() method of sockets had been monkey patched, I jumped over the close() call in a debugger, assuming it wasn’t anything interesting. It wasn’t for another hour until I decided to look into the close() call to see that it didn’t really close anything.
haven’t actually done this one, but I have several friends who are great debuggers who do this, and I often wish I did. Pretend that instead of becoming a programmer, you become a proper lab scientist, and get a notebook. Take notes on what experiments you’ve tried, jot down assumptions you’re making. When you’ve got a multi-hour or multi-day debugging session, you will forget the things you’ve tried before. A lab notebook’s job is to prevent yourself from duplicating work, or misremembering the results of an earlier experiment.
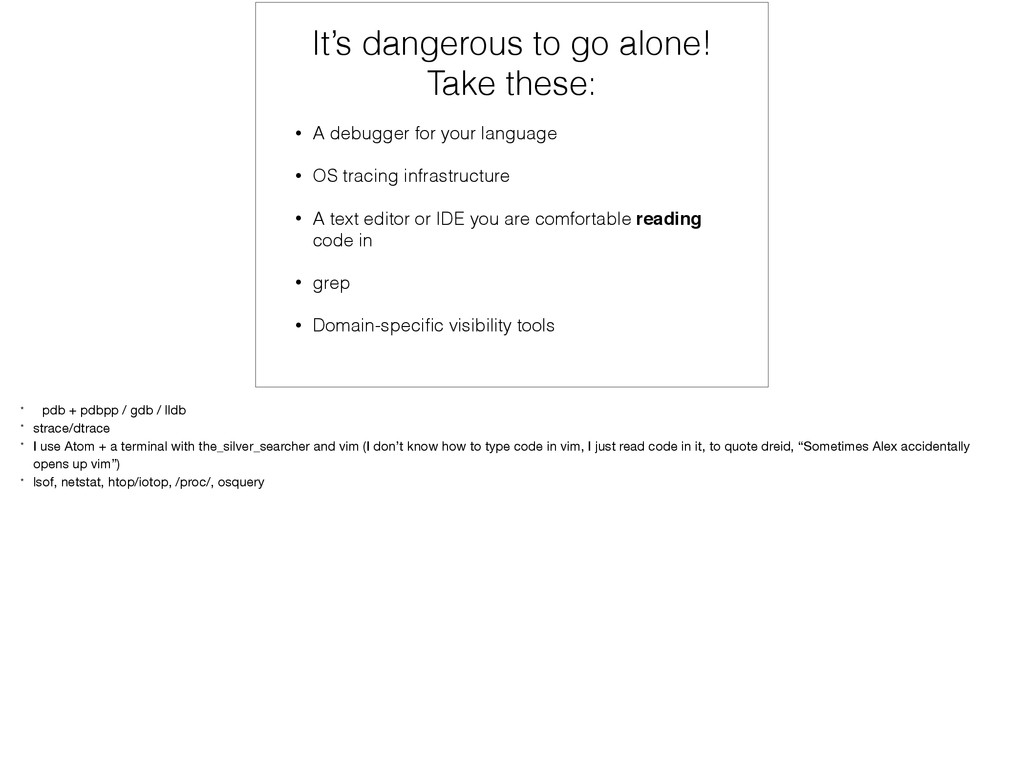
for your language • OS tracing infrastructure • A text editor or IDE you are comfortable reading code in • grep • Domain-specific visibility tools * pdb + pdbpp / gdb / lldb * strace/dtrace * I use Atom + a terminal with the_silver_searcher and vim (I don’t know how to type code in vim, I just read code in it, to quote dreid, “Sometimes Alex accidentally opens up vim”) * lsof, netstat, htop/iotop, /proc/, osquery
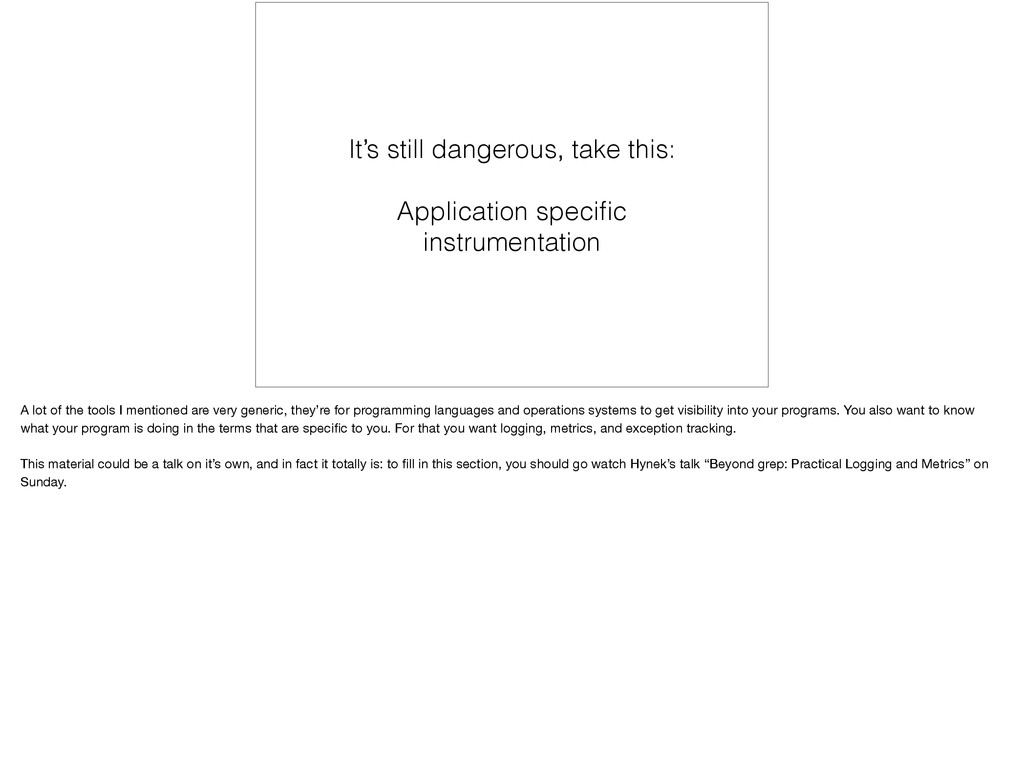
of the tools I mentioned are very generic, they’re for programming languages and operations systems to get visibility into your programs. You also want to know what your program is doing in the terms that are specific to you. For that you want logging, metrics, and exception tracking. This material could be a talk on it’s own, and in fact it totally is: to fill in this section, you should go watch Hynek’s talk “Beyond grep: Practical Logging and Metrics” on Sunday.
always do, and Tools, which are technologies that you can apply as necessary. Now we’re going to talk about techniques, which are strategies you can use as appropriate.
a familiar concept. Grab a friend of coworker and have them sit or stand with you and work through things with them. For me this is really difficult, but talk about what you’re seeing and thinking. Whenever you find yourselves having different instincts or interpretations of the data, step back from the computer and try to understand why.
is pretty simple: try to get a program which fails in the same way as your original problem, and make that program as small as possible. You don’t just want as few lines of code, you want as few moving parts. Ideally try to remove as many libraries as possible. If your program has any concurrency or randomness in it, try to remove those as well. Reducing the size of your reproducer means less code that you have to read, and fewer potential culprits. Even more important, if your bug is a result of a bad interaction, the number of interactions scales quadratically with the number of “things” in your program, so removing a few things MASSIVELY shrinks the search space. If you find something that, when you remove it the bug disappears, that’s a great first place to start looking for a bug.
software, and 5 minutes later you start getting emails with tracebacks in them, it’s a fair bet your release caused the problem, and the first thing you should do is look to see what exactly changed. There’s no law of the universe that requires the most recent change in your code cause a bug, sometimes the change you’re looking for is in something else, it could be something else about your environment, or it could be totally unrelated to anything recent, a lurking bug. If your bug is a regression, something which used to work but is now broken, you want to track down exactly which change introduced the bug. For this you want to use git bisect (or the right command in your VCS), to help you quickly narrow down which commit caused the issue.
sufficiently complex bug, it’s quite likely you will stumble across other things that are broken. It’s very likely you will mutter the phrase “how did this ever work?” As you encounter these, you need to keep asking yourself, “Does this explain the symptoms I’m seeing?” If the answer is “no”, file a bug to fix it later, and continue looking for the actual source of your bug. The corollary to this is that when you aren’t looking for hideously complex bugs, you should be doing constant clean up on your code base. Ideally you should never be distracted by minorly broken things when you’re looking for majorly broken things. Remember: complex system failures are almost never caused by a single being broken, they’re caused my a series of smaller interconnected failures. If you fix the small failures quickly, you can avoid letting them become larger, more complex, failures.
bug in production environment, you should try to find a way to reproduce it elsewhere as quickly as possible. Being in production limits the set of tooling you can bring to bear on a problem. Many debugging tools do things like slow down the program you’re debugging, or produce very large outputs. Doing this in production would probably disrupt other traffic, which isn’t hitting your bug. Get the bug onto your development environment, so you can experiment more freely. That said, sometimes the bug refuses to cooperate and reproduce itself on your laptop. In those cases, you need to gradually scale up your usage of non-invasive debugging tools, like logging and metrics, until you can understand where the bug is.
this work in practice? I’m going to tell you the story of a bug which took three people a day or two to debug. Probably 15+ collective developer-hours. How did we figure it out? * Explain fork/exec and posix_spawn * David hits the bug — futzes with it, eventually Glyph and myself come over to take a look * Google maps the error to what causes it * Unstructured attempts to change the code that reproduces it (modes, fds, etc.) * Too many moving parts! Move to just C code, then just Python code, then copy Python code into py.test — look at the diff! * Glyph spots the difference, moves one line code which triggers the failure * Look at the glibc source code — I recognize a difference from what the code does, and what the spec says * David comes up with a workaround we can use
not a science, though the scientific method can be a good approach to thinking about it, each debugging episode is different. Sometimes the only thing that works is staring at the code until an idea pops into your head, other times judicious use of a debugger and logging will steer you towards the culprit. Hopefully this talk has equipped you with some tools and techniques which you can bring to bear the next time you’re confronted with one of these bugs.