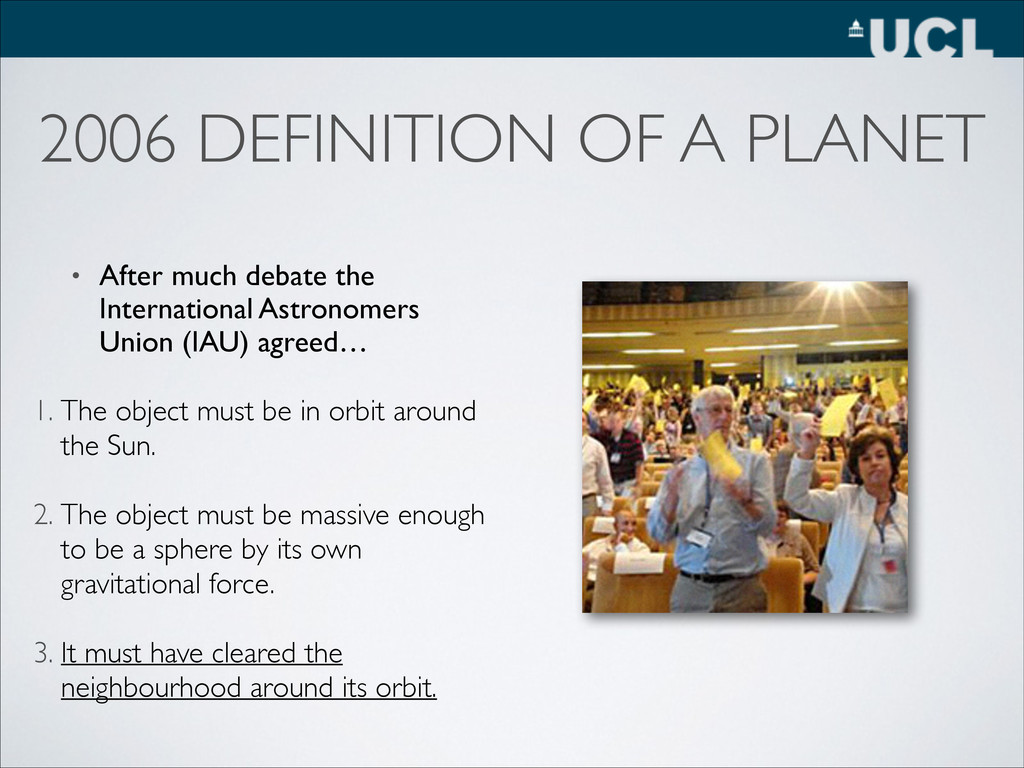
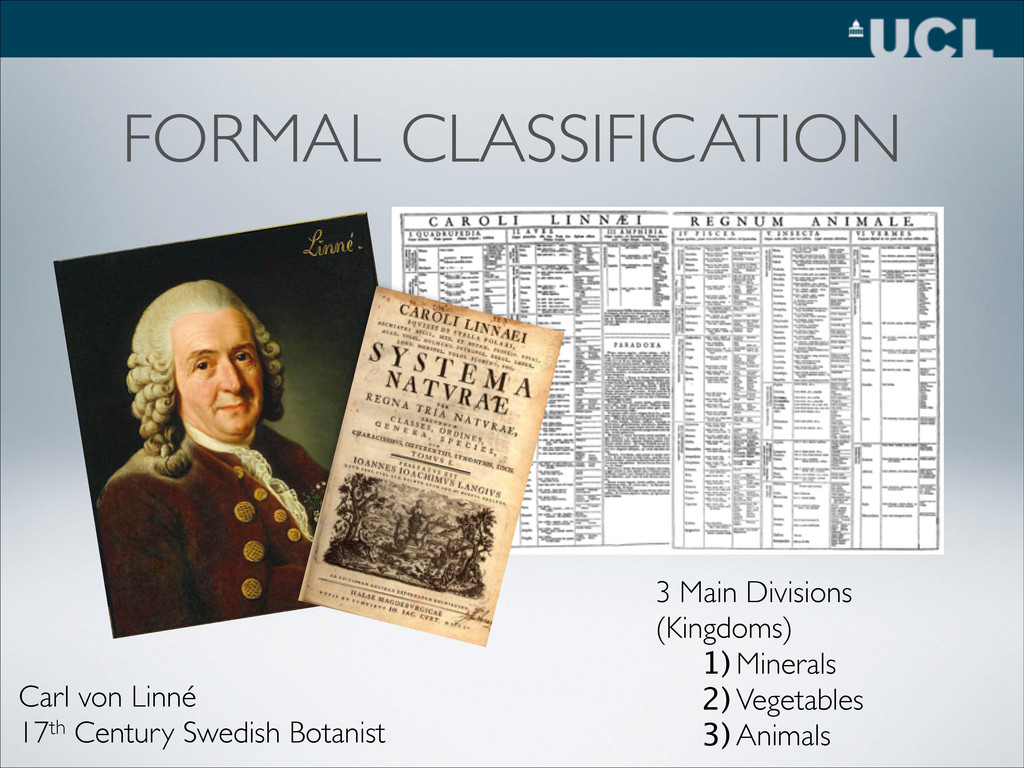
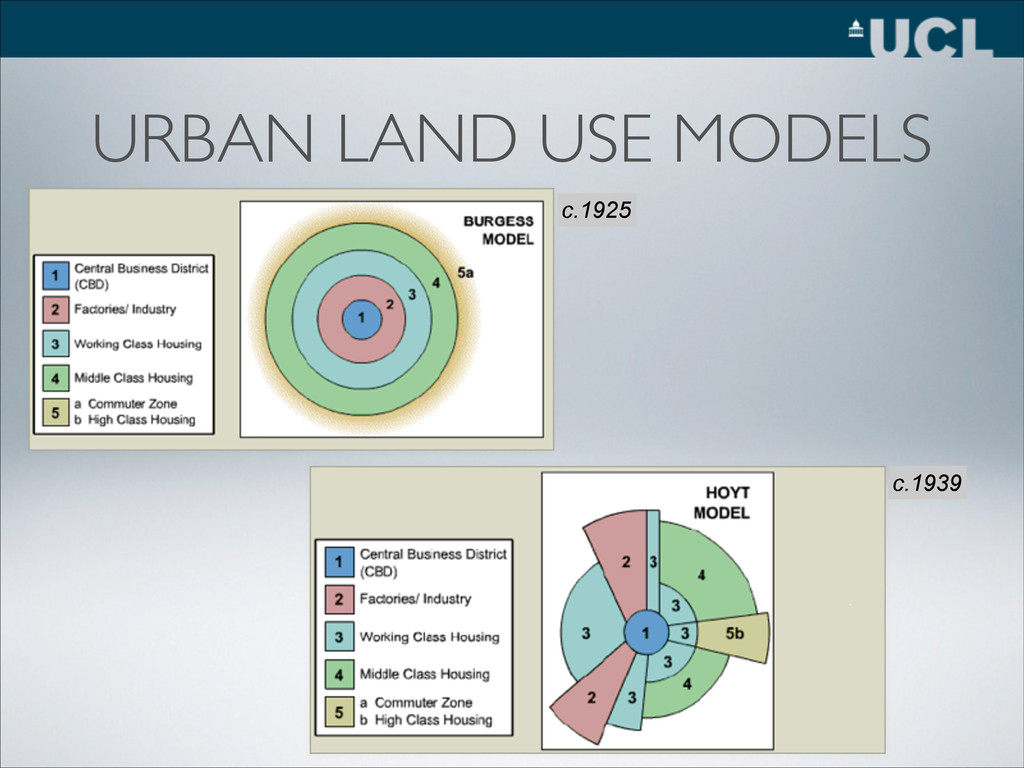
International Astronomers Union (IAU) agreed… 1. The object must be in orbit around the Sun. 2. The object must be massive enough to be a sphere by its own gravitational force. 3. It must have cleared the neighbourhood around its orbit.
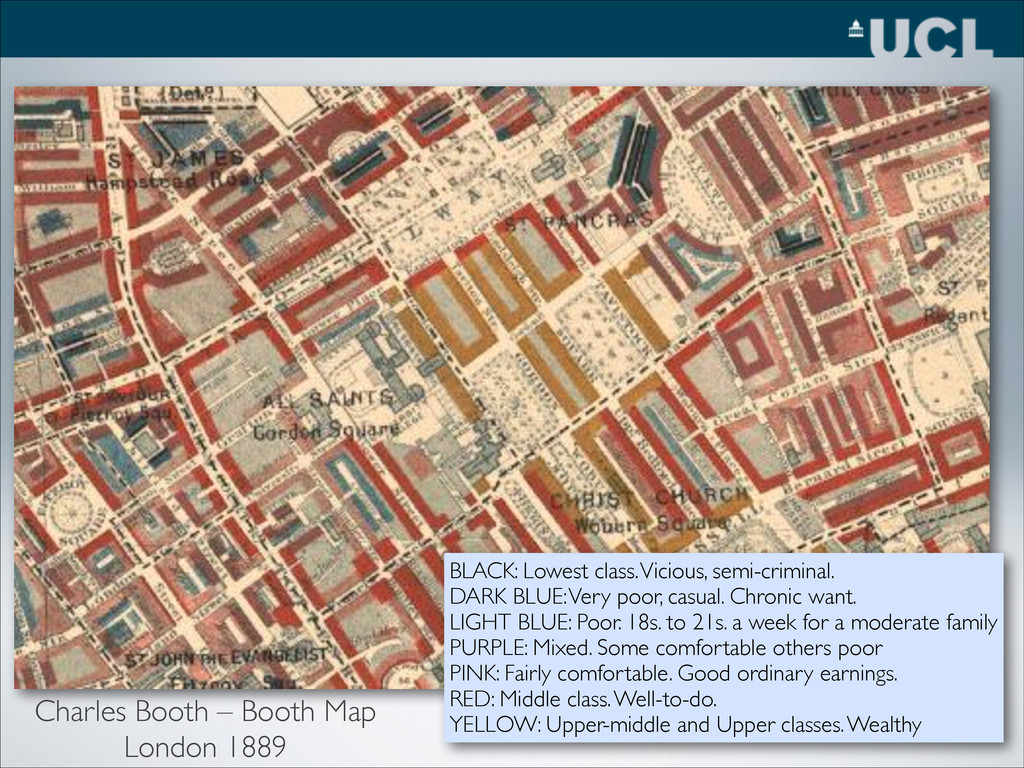
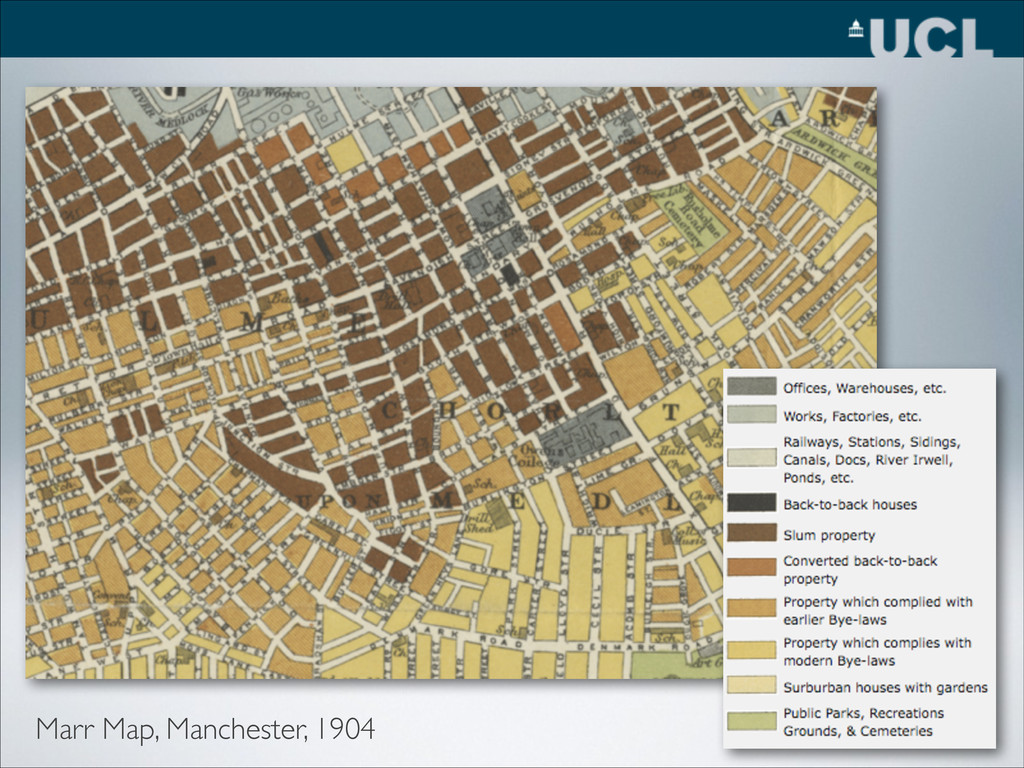
Chronic want. LIGHT BLUE: Poor. 18s. to 21s. a week for a moderate family PURPLE: Mixed. Some comfortable others poor PINK: Fairly comfortable. Good ordinary earnings. RED: Middle class. Well-to-do. YELLOW: Upper-middle and Upper classes. Wealthy Charles Booth – Booth Map London 1889
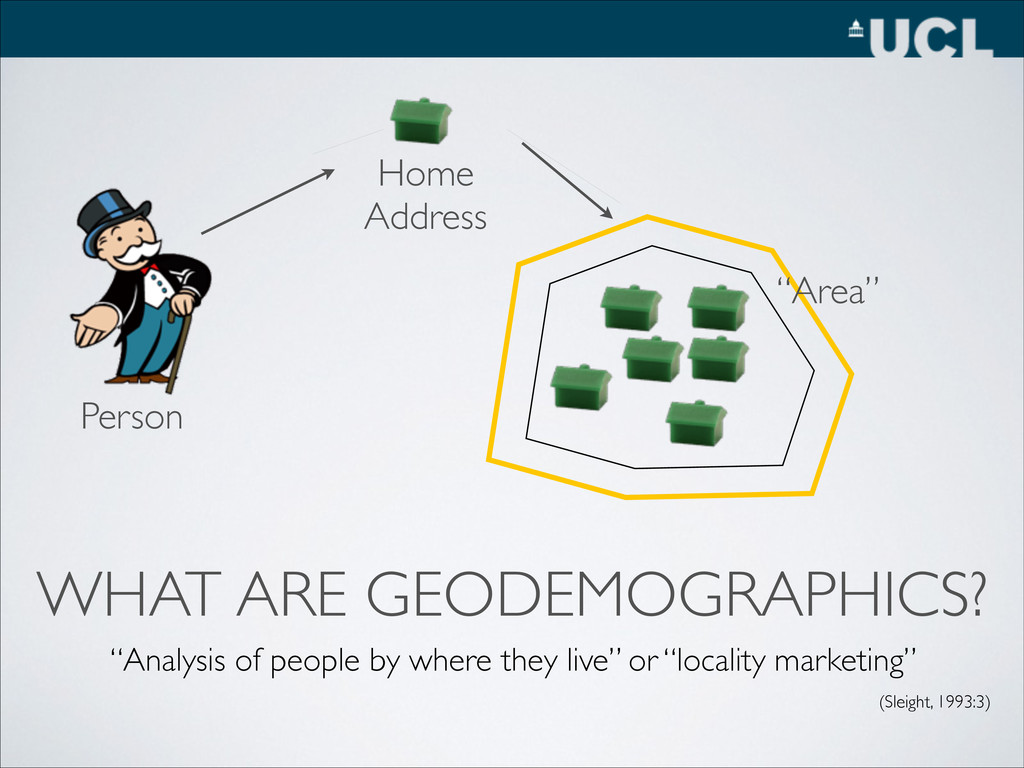
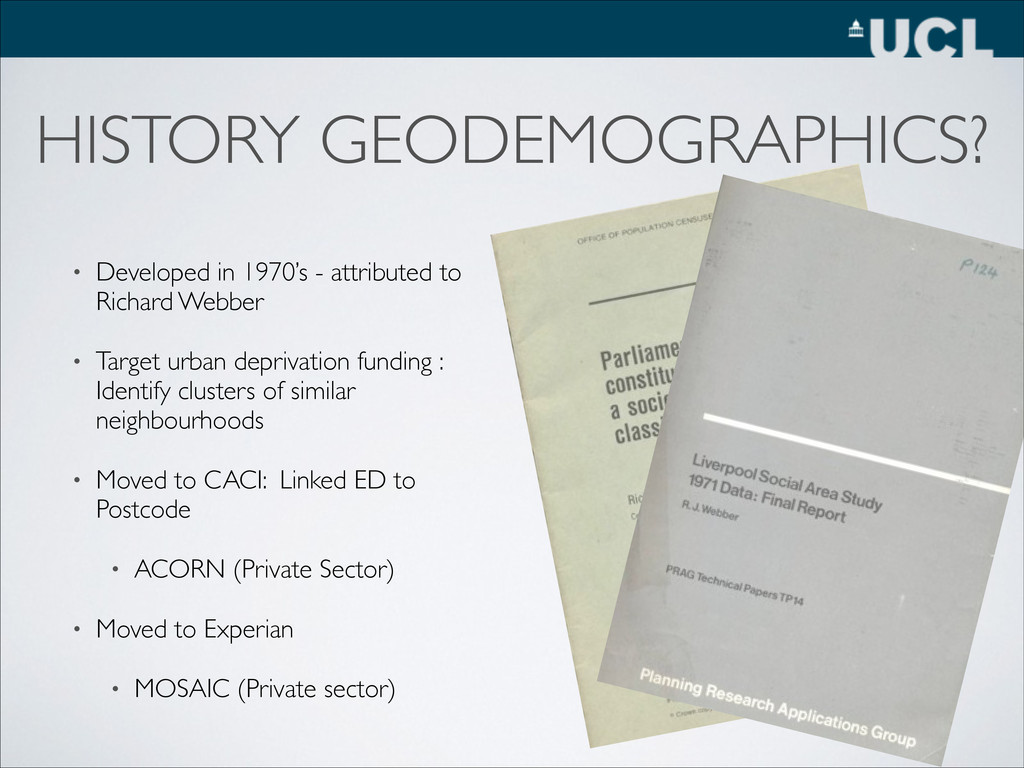
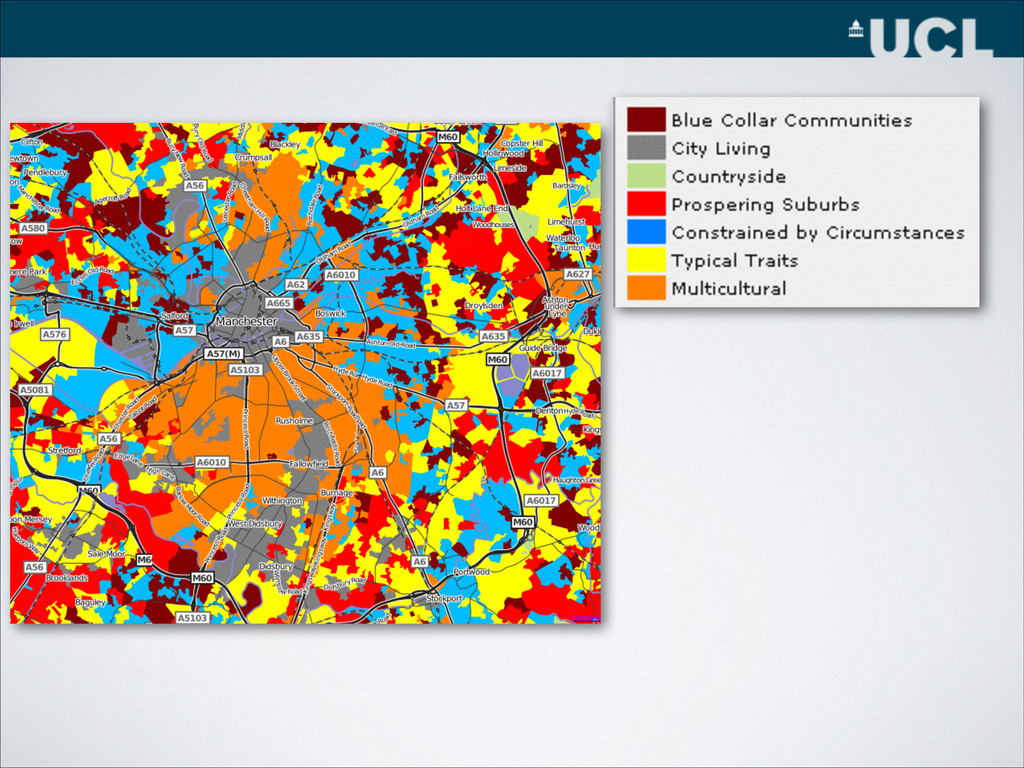
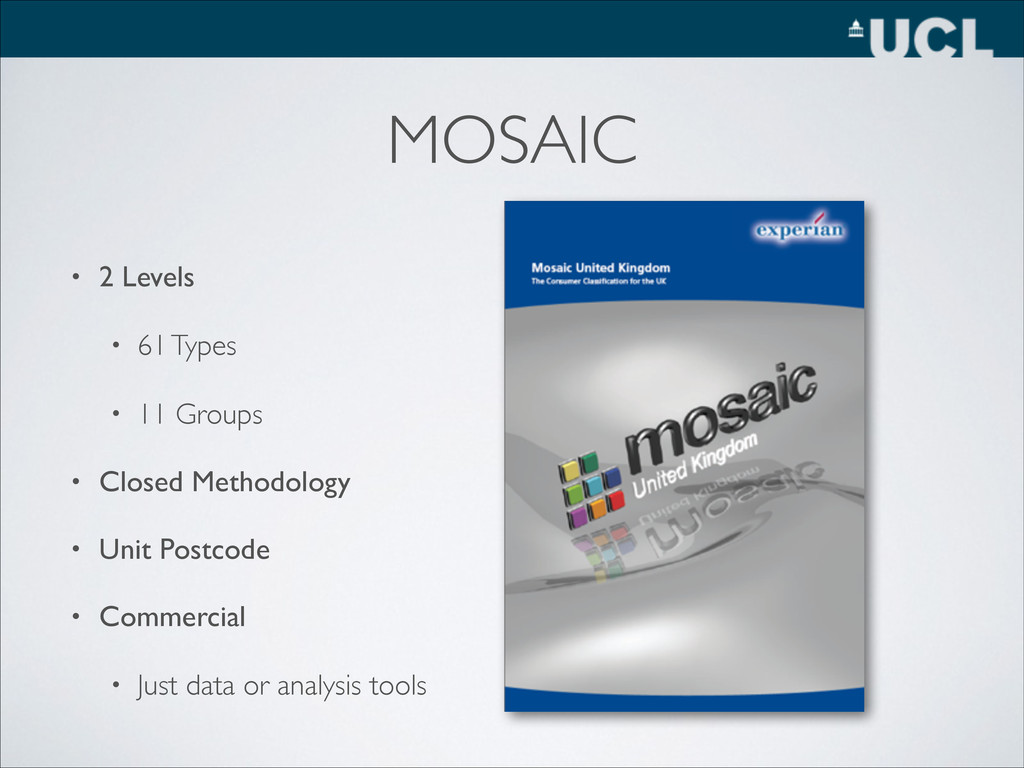
Webber • Target urban deprivation funding : Identify clusters of similar neighbourhoods • Moved to CACI: Linked ED to Postcode • ACORN (Private Sector) • Moved to Experian • MOSAIC (Private sector)
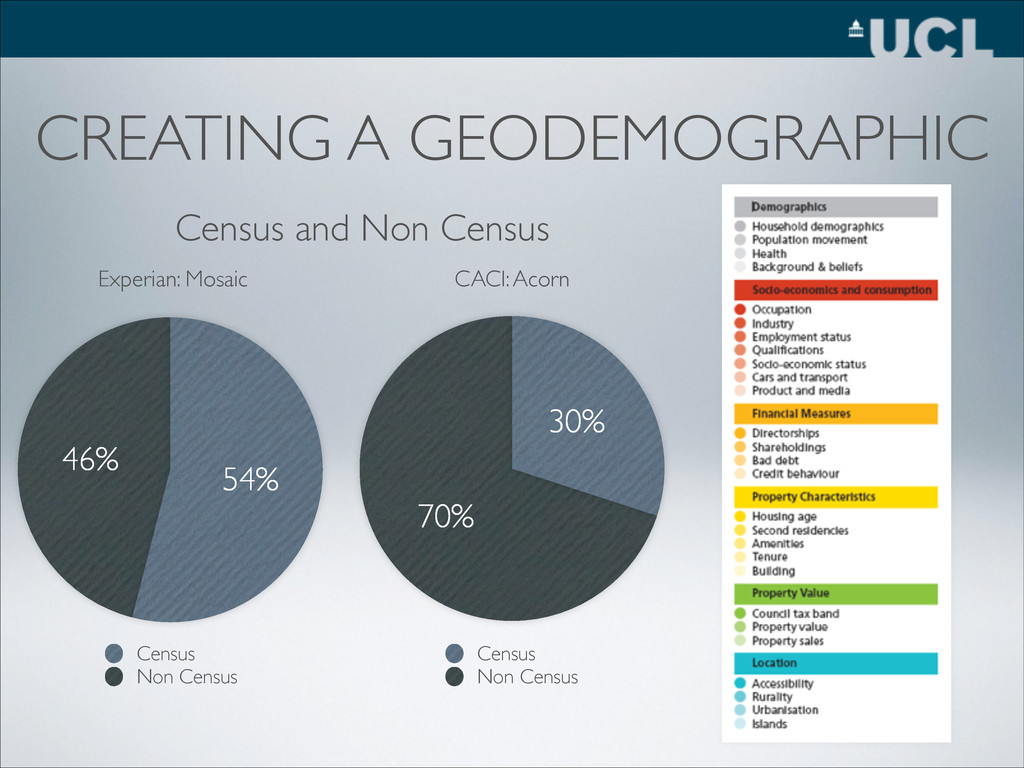
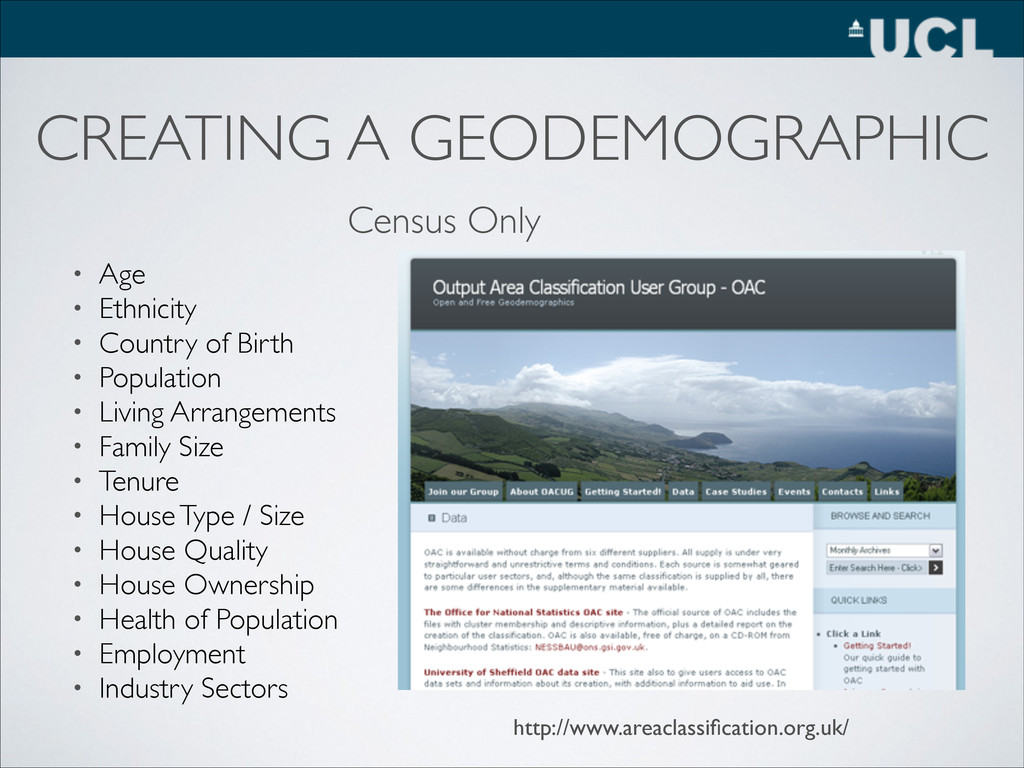
Birth • Population • Living Arrangements • Family Size • Tenure • House Type / Size • House Quality • House Ownership • Health of Population • Employment • Industry Sectors Census Only http://www.areaclassification.org.uk/
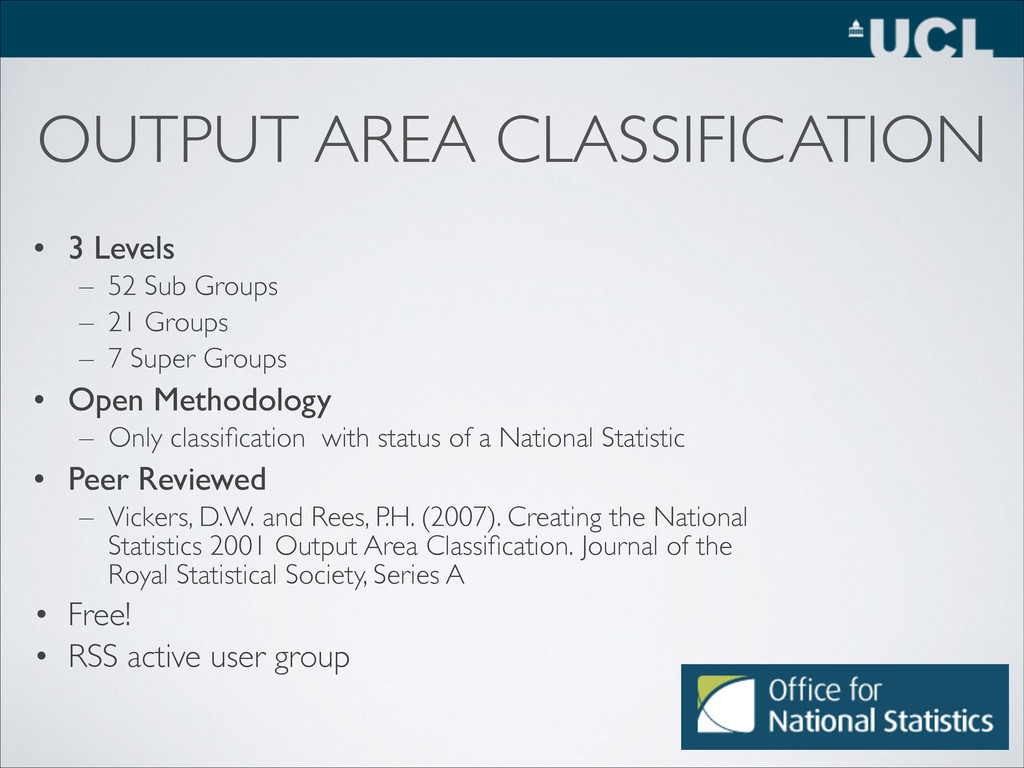
– 21 Groups – 7 Super Groups • Open Methodology – Only classification with status of a National Statistic • Peer Reviewed – Vickers, D.W. and Rees, P.H. (2007). Creating the National Statistics 2001 Output Area Classification. Journal of the Royal Statistical Society, Series A • Free! • RSS active user group
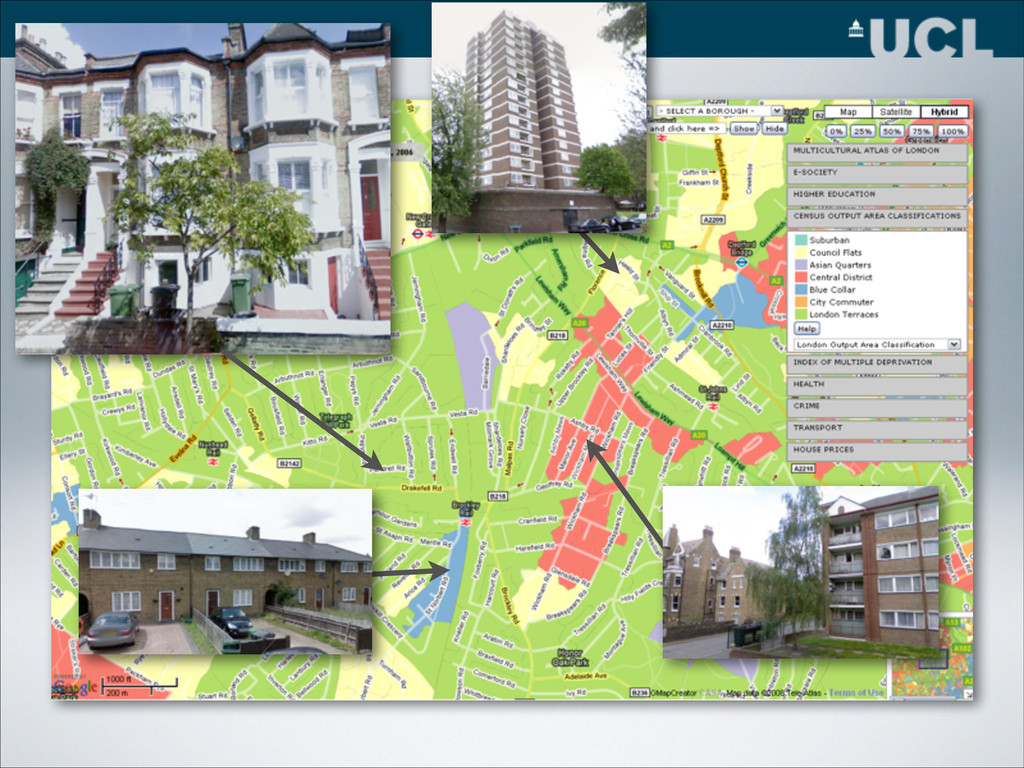
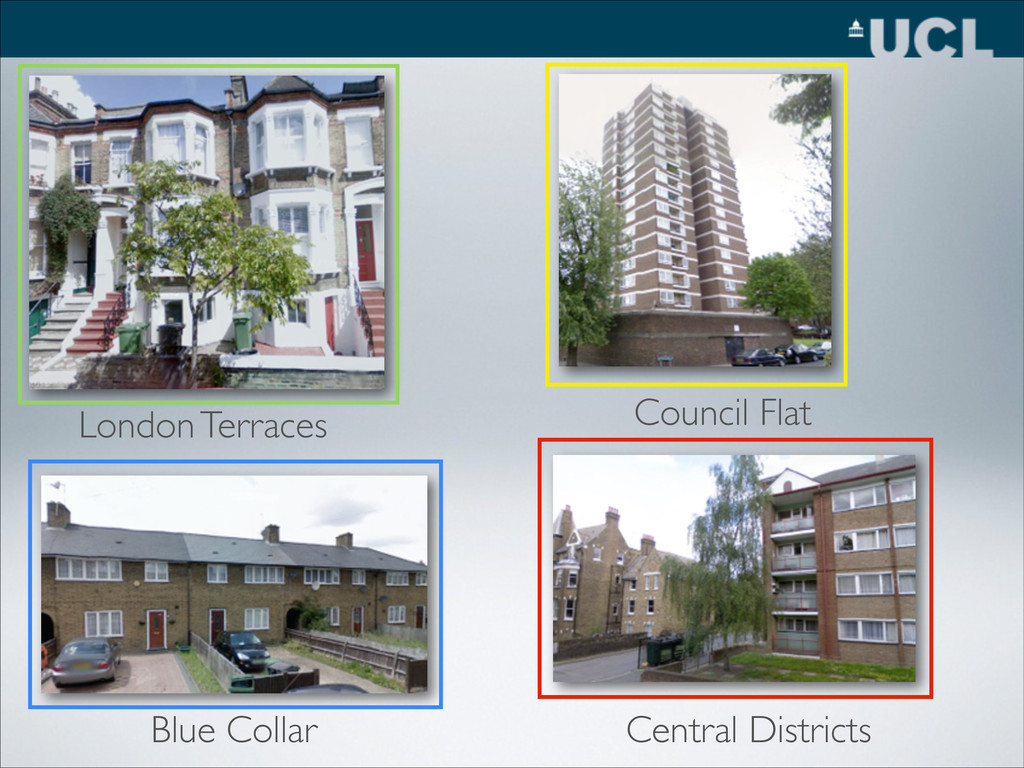
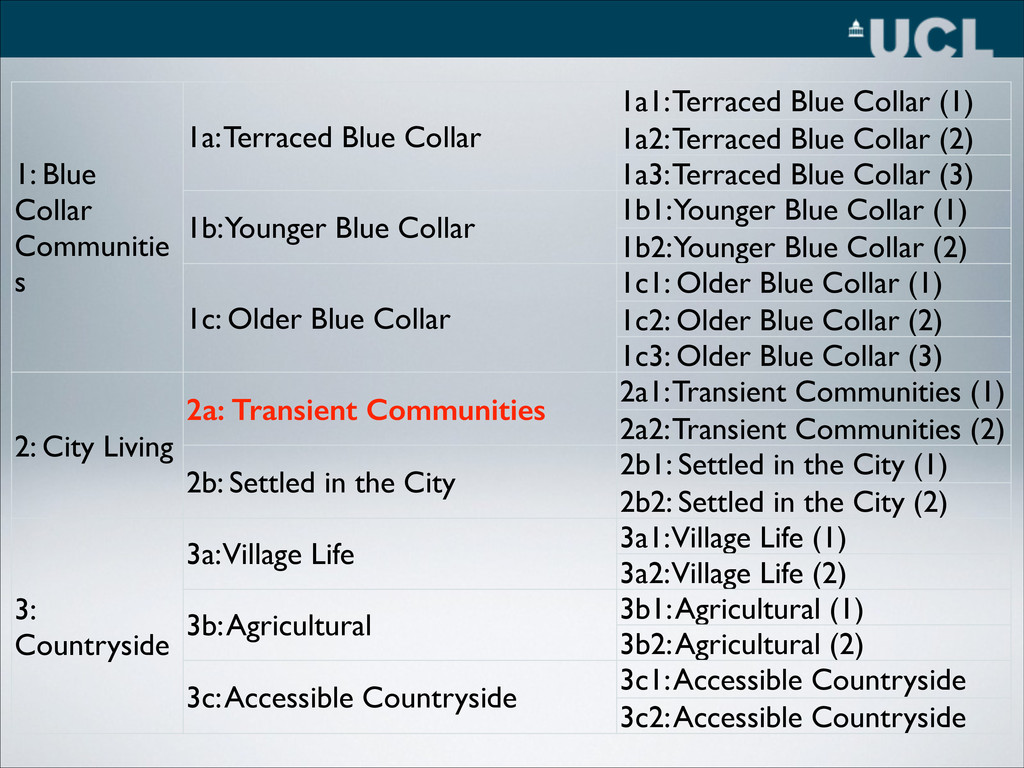
Terraced Blue Collar (1) 1a2: Terraced Blue Collar (2) 1a3: Terraced Blue Collar (3) 1b: Younger Blue Collar 1b1: Younger Blue Collar (1) 1b2: Younger Blue Collar (2) 1c: Older Blue Collar 1c1: Older Blue Collar (1) 1c2: Older Blue Collar (2) 1c3: Older Blue Collar (3) 2: City Living 2a: Transient Communities 2a1: Transient Communities (1) 2a2: Transient Communities (2) 2b: Settled in the City 2b1: Settled in the City (1) 2b2: Settled in the City (2) 3: Countryside 3a: Village Life 3a1: Village Life (1) 3a2: Village Life (2) 3b: Agricultural 3b1: Agricultural (1) 3b2: Agricultural (2) 3c: Accessible Countryside 3c1: Accessible Countryside 3c2: Accessible Countryside
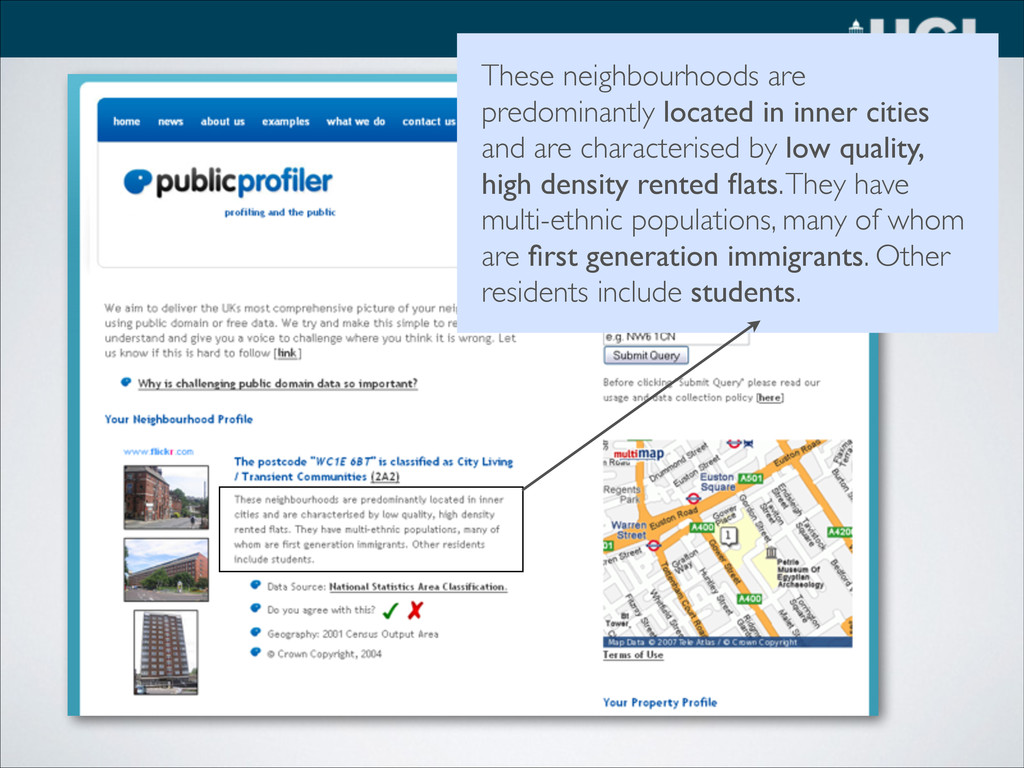
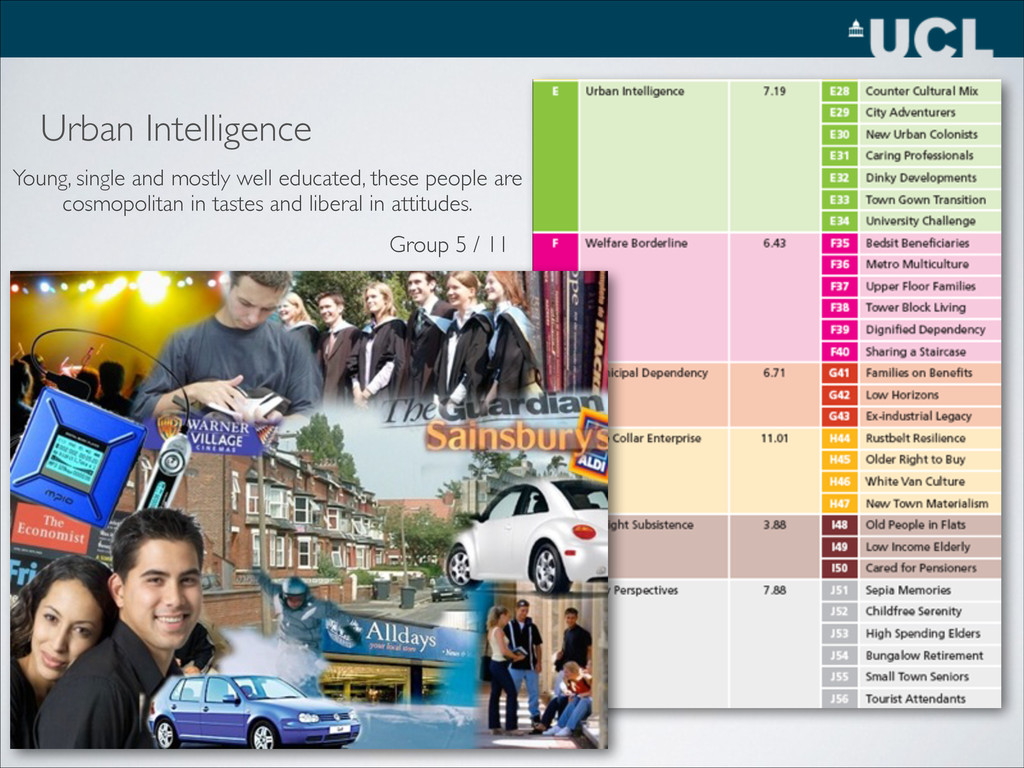
characterised by low quality, high density rented flats. They have multi-ethnic populations, many of whom are first generation immigrants. Other residents include students.
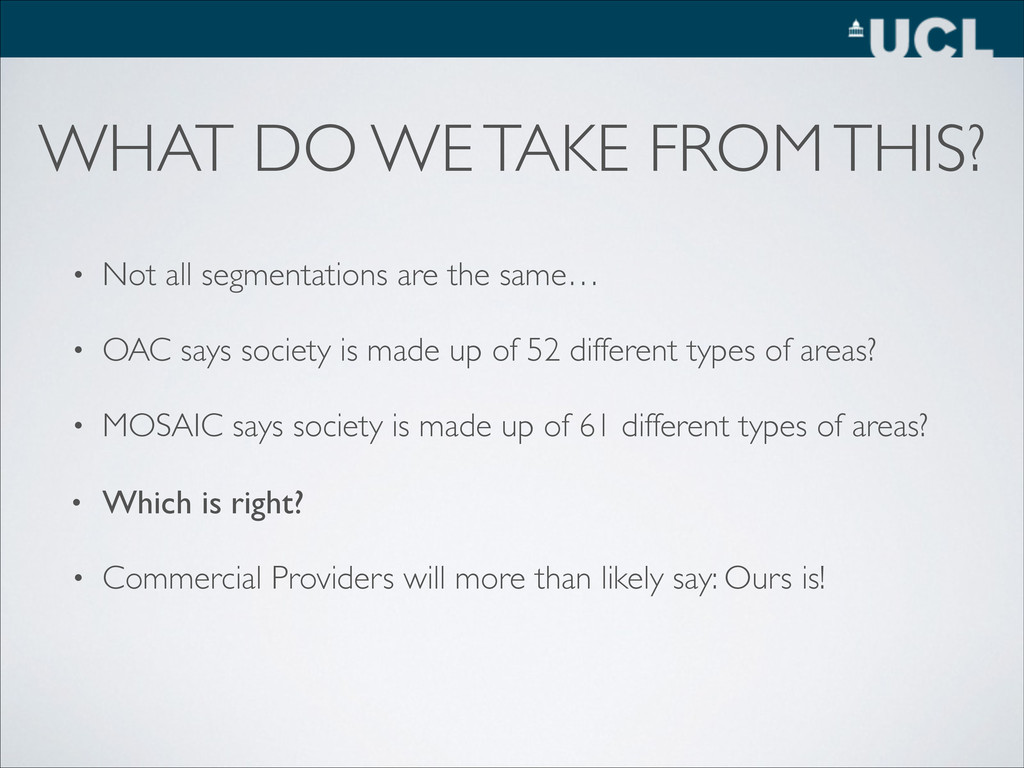
are the same… • OAC says society is made up of 52 different types of areas? • MOSAIC says society is made up of 61 different types of areas? • Which is right? • Commercial Providers will more than likely say: Ours is!
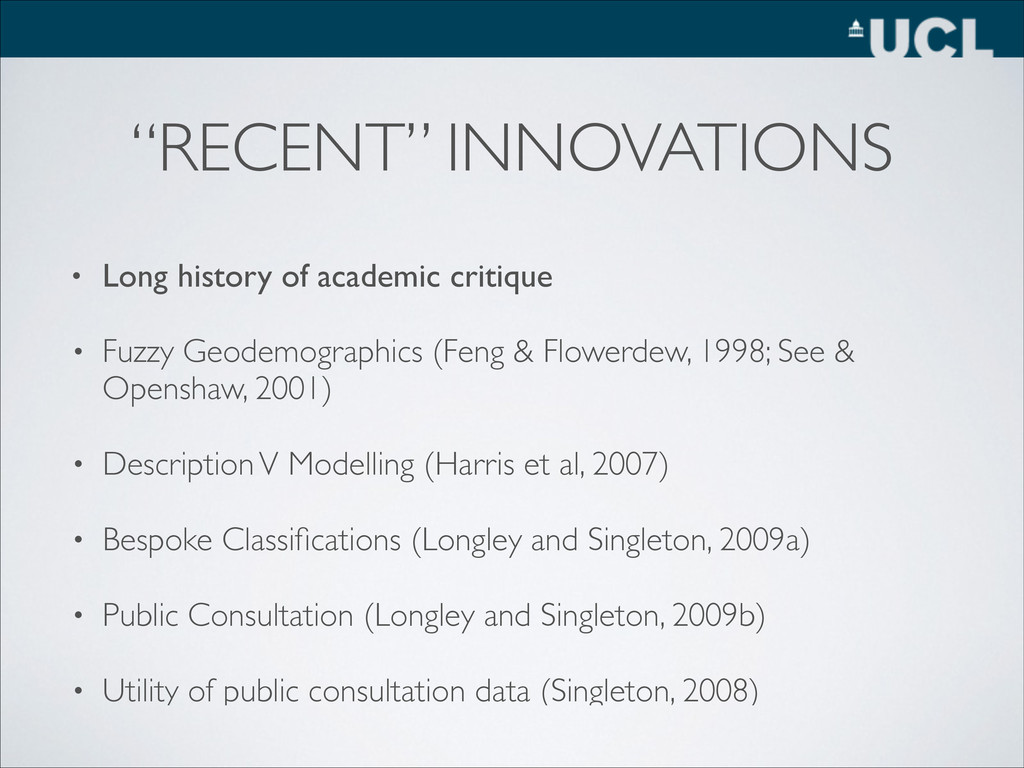
Geodemographics (Feng & Flowerdew, 1998; See & Openshaw, 2001) • Description V Modelling (Harris et al, 2007) • Bespoke Classifications (Longley and Singleton, 2009a) • Public Consultation (Longley and Singleton, 2009b) • Utility of public consultation data (Singleton, 2008)
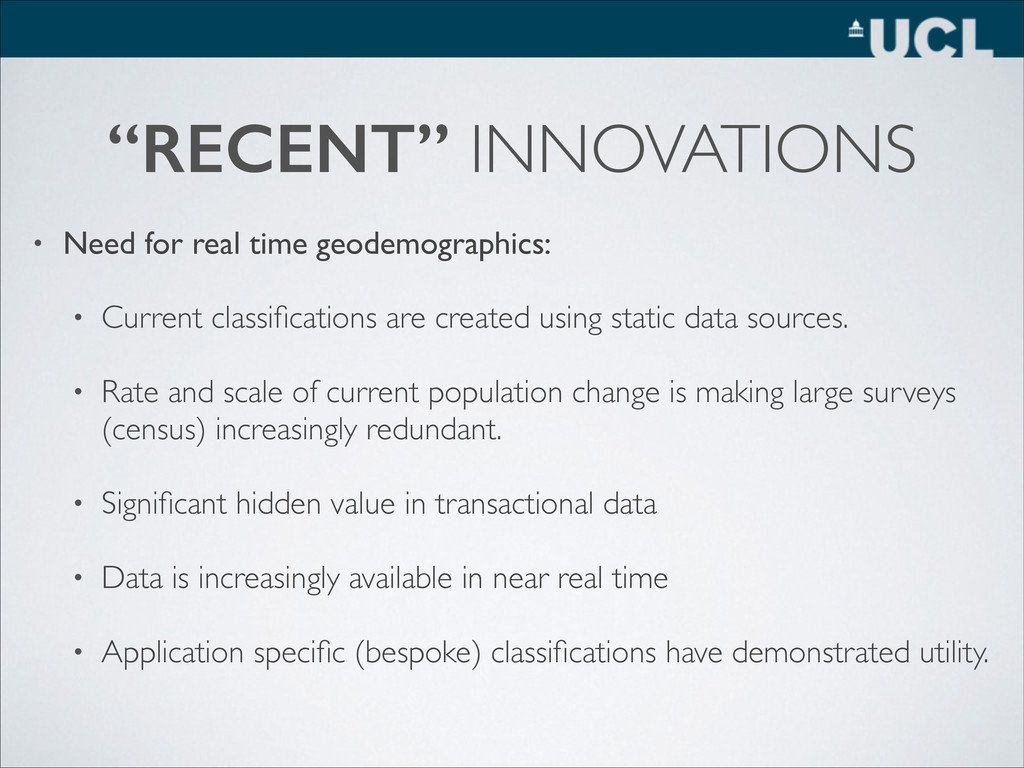
classifications are created using static data sources. • Rate and scale of current population change is making large surveys (census) increasingly redundant. • Significant hidden value in transactional data • Data is increasingly available in near real time • Application specific (bespoke) classifications have demonstrated utility.
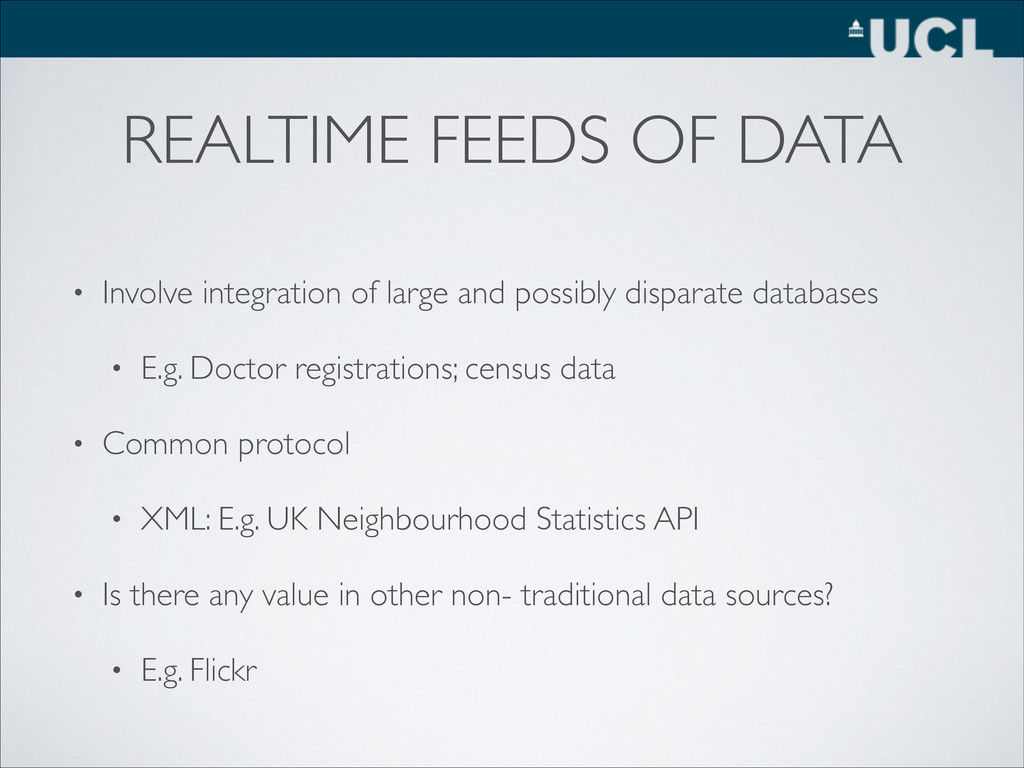
possibly disparate databases • E.g. Doctor registrations; census data • Common protocol • XML: E.g. UK Neighbourhood Statistics API • Is there any value in other non- traditional data sources? • E.g. Flickr
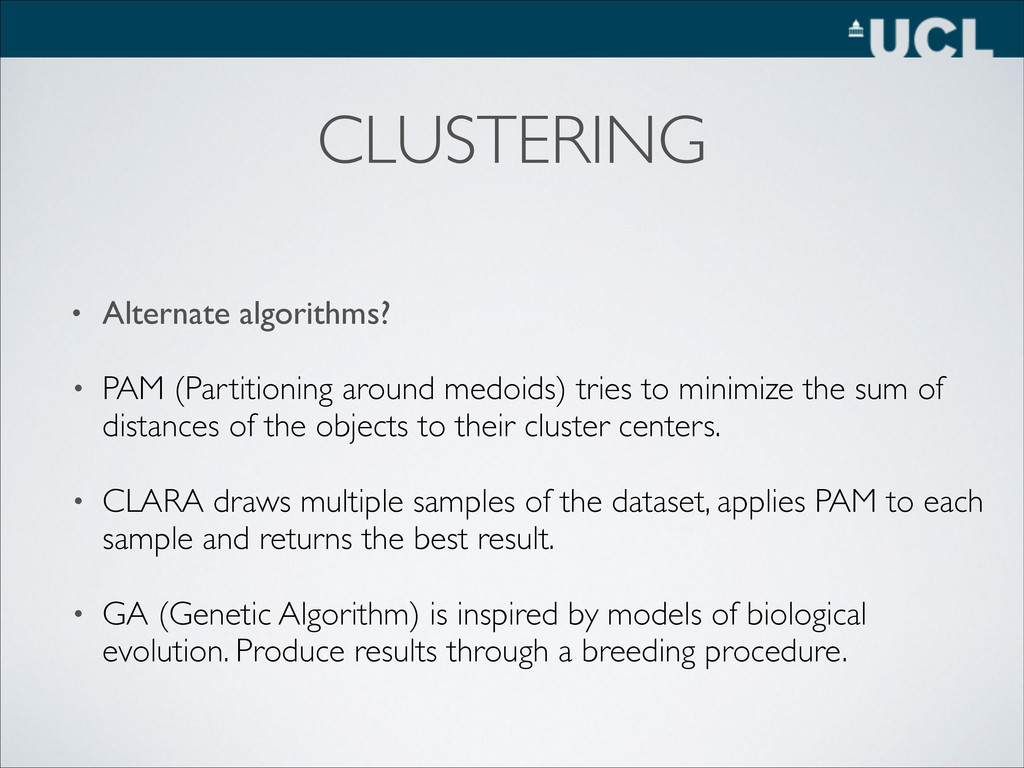
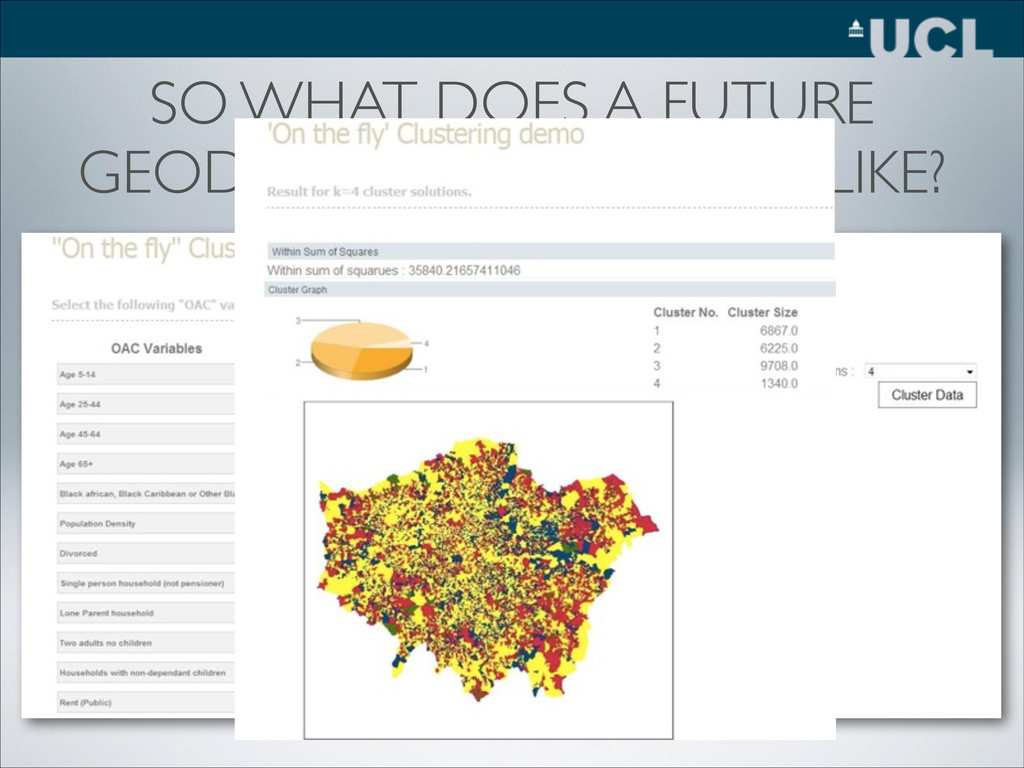
to minimize the sum of distances of the objects to their cluster centers. • CLARA draws multiple samples of the dataset, applies PAM to each sample and returns the best result. • GA (Genetic Algorithm) is inspired by models of biological evolution. Produce results through a breeding procedure.
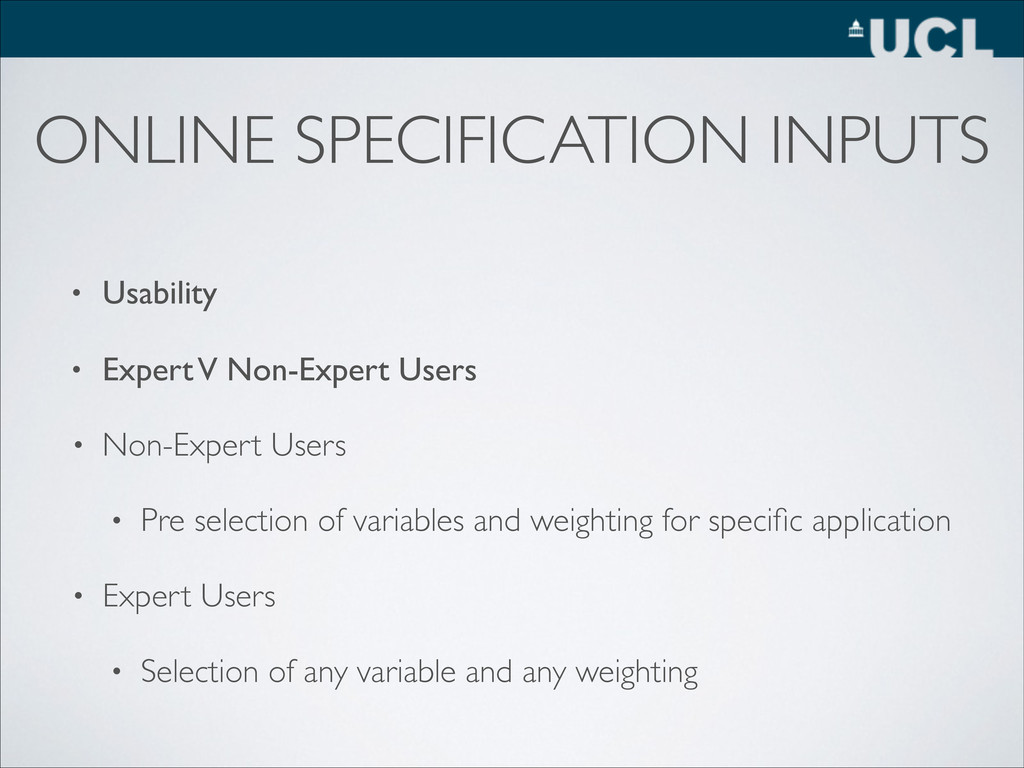
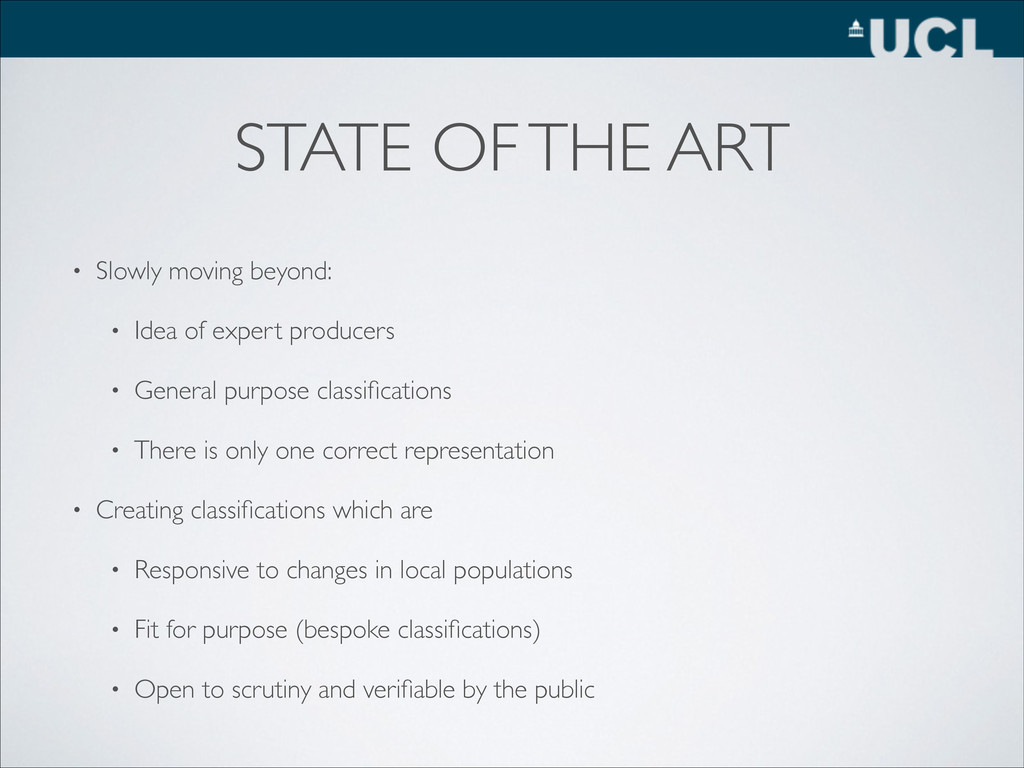
of expert producers • General purpose classifications • There is only one correct representation • Creating classifications which are • Responsive to changes in local populations • Fit for purpose (bespoke classifications) • Open to scrutiny and verifiable by the public