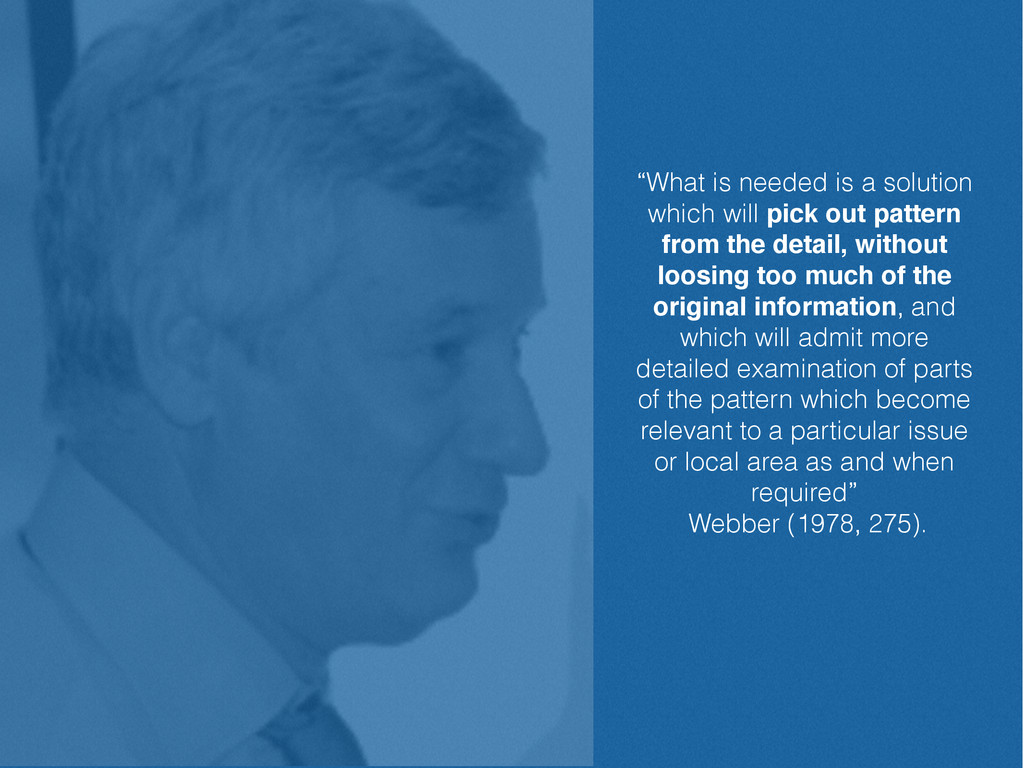
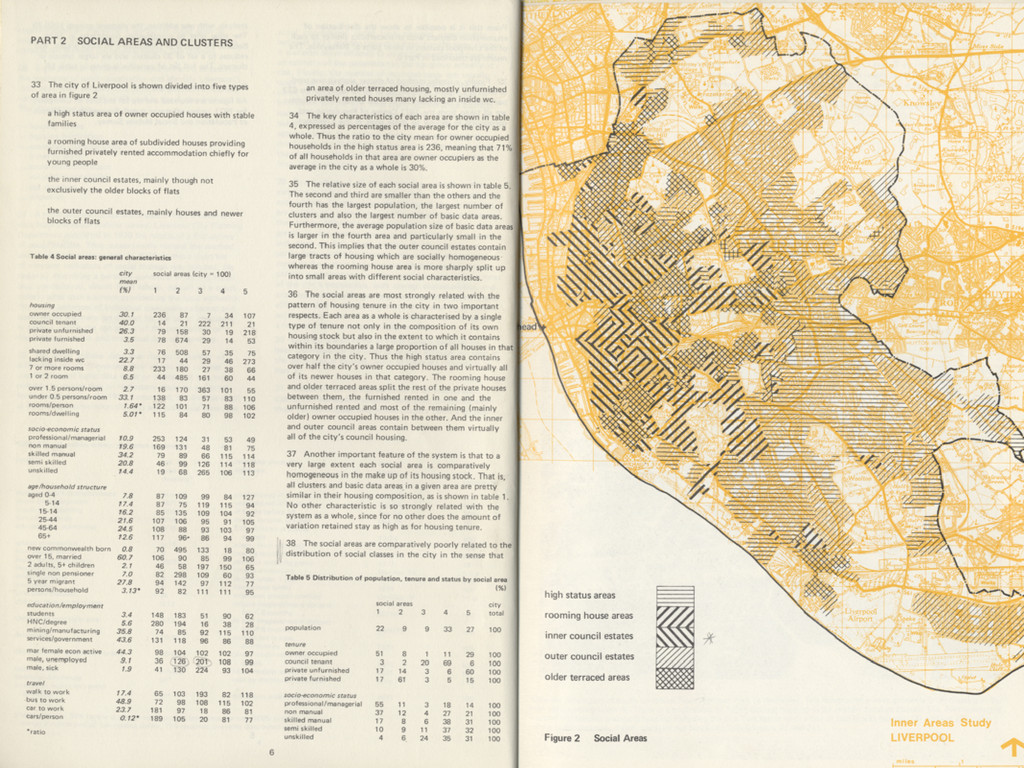
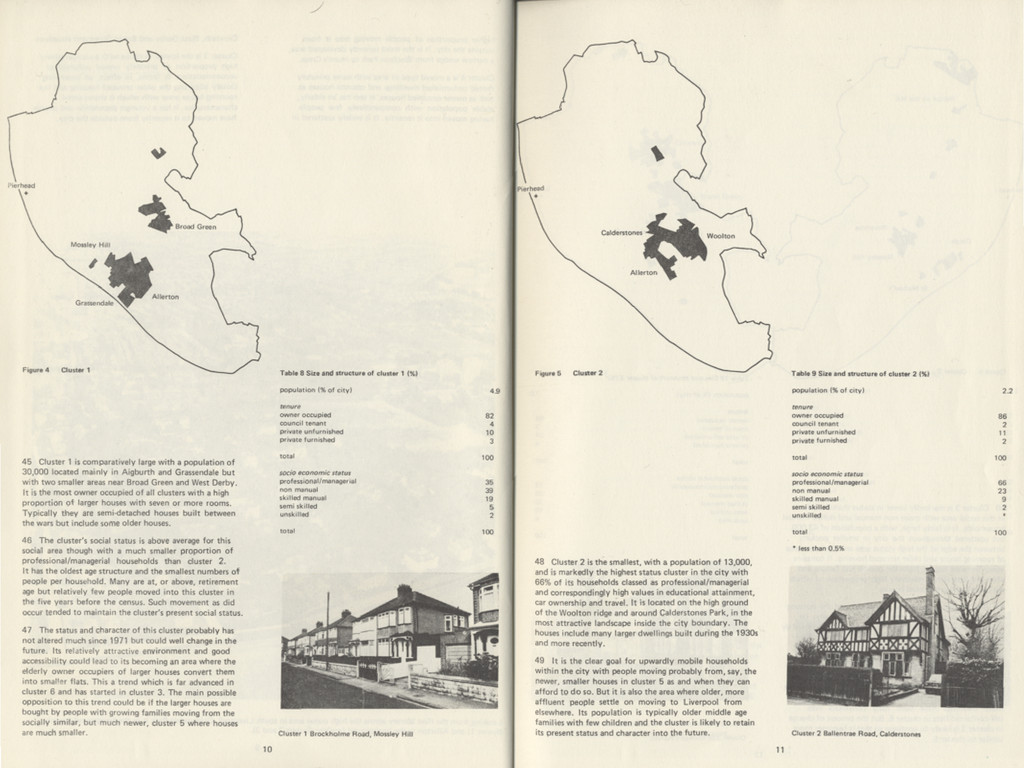
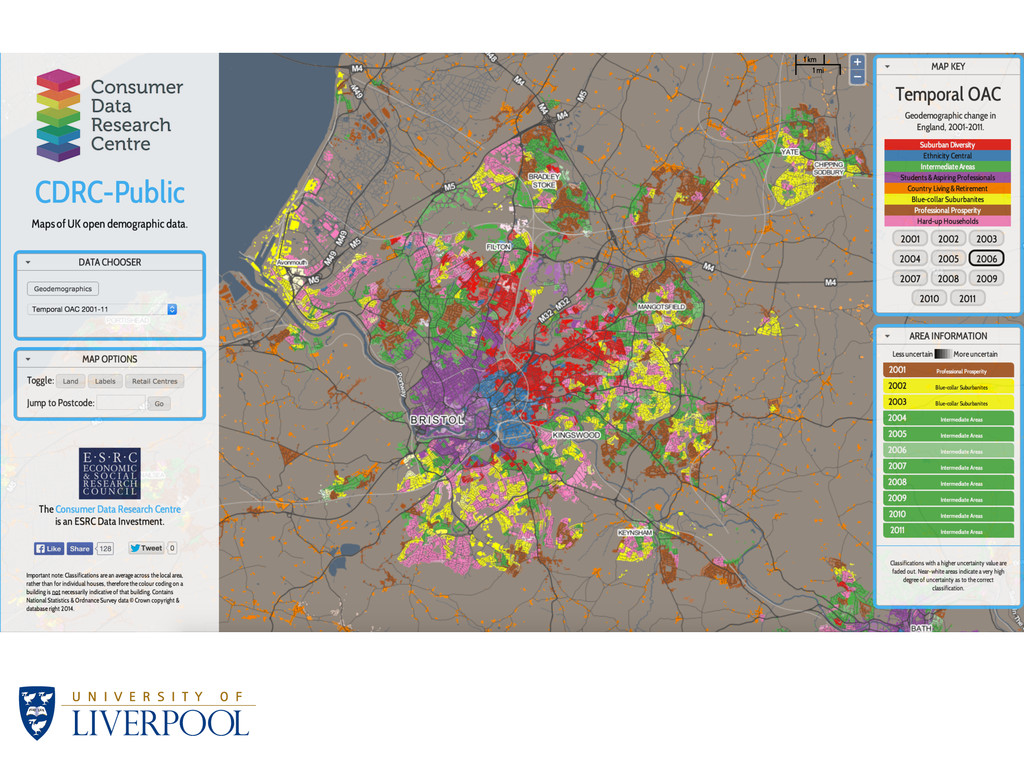
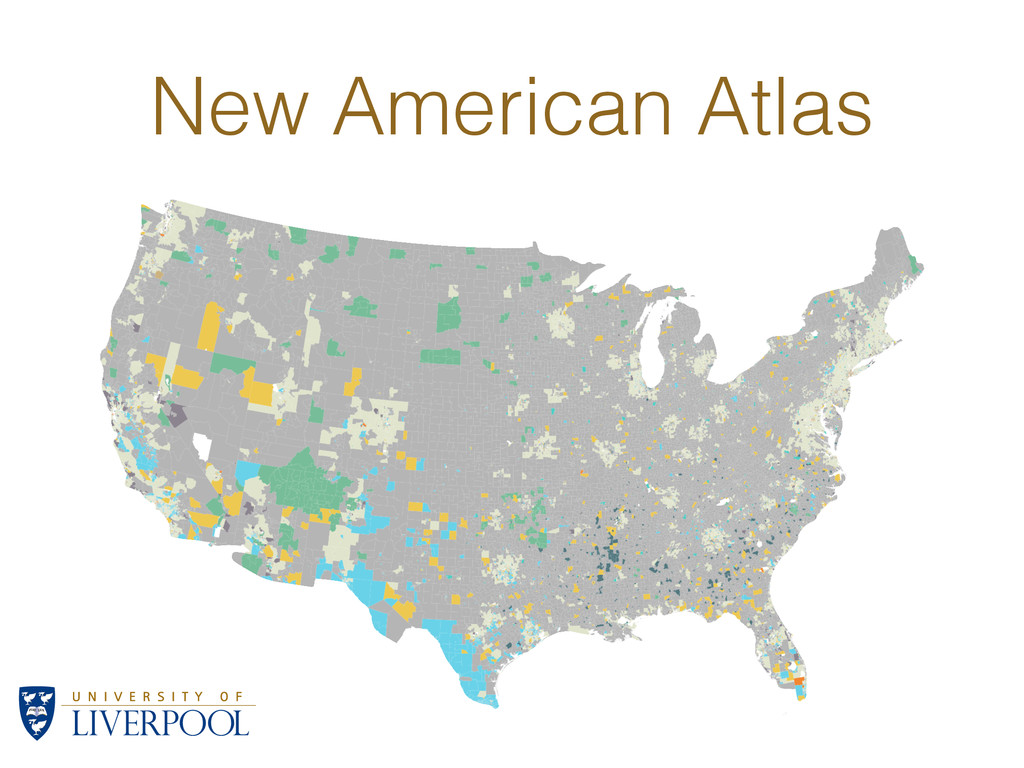
pattern from the detail, without loosing too much of the original information, and which will admit more detailed examination of parts of the pattern which become relevant to a particular issue or local area as and when required” Webber (1978, 275).
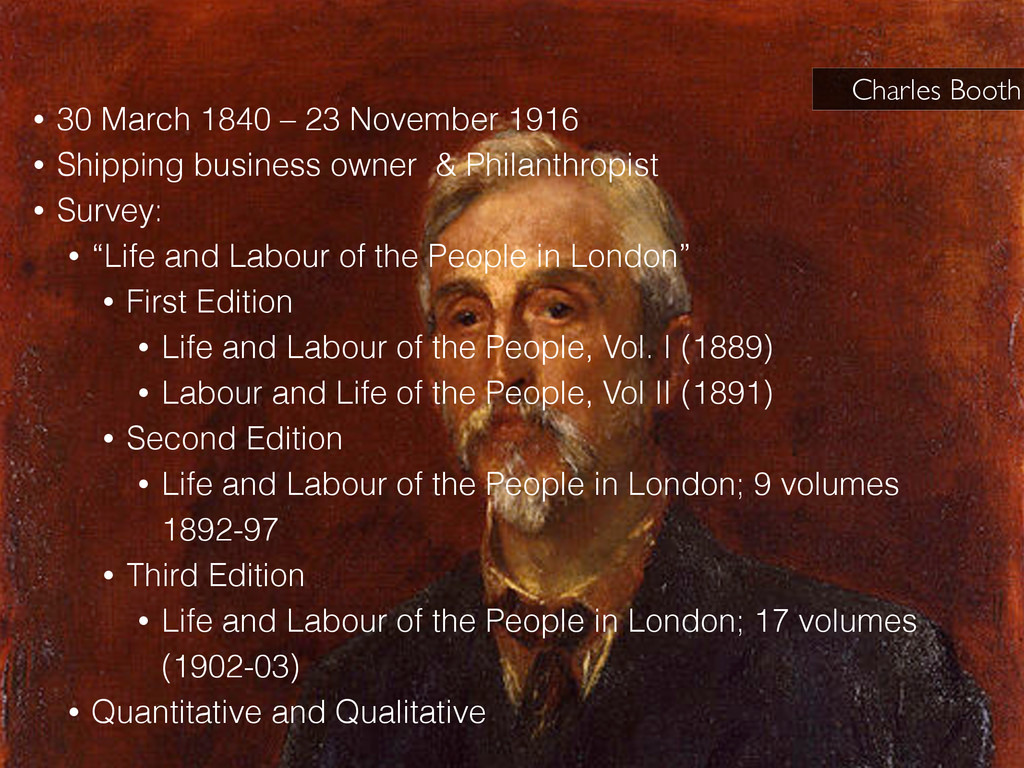
• Shipping business owner & Philanthropist • Survey: • “Life and Labour of the People in London” • First Edition • Life and Labour of the People, Vol. I (1889) • Labour and Life of the People, Vol II (1891) • Second Edition • Life and Labour of the People in London; 9 volumes 1892-97 • Third Edition • Life and Labour of the People in London; 17 volumes (1902-03) • Quantitative and Qualitative
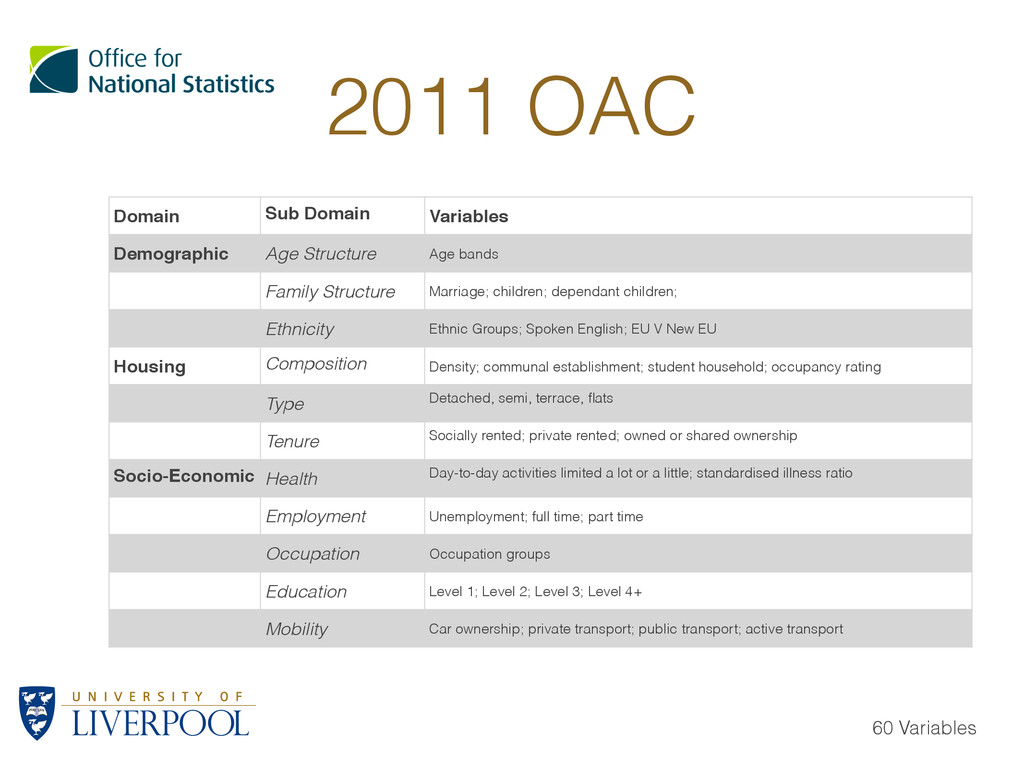
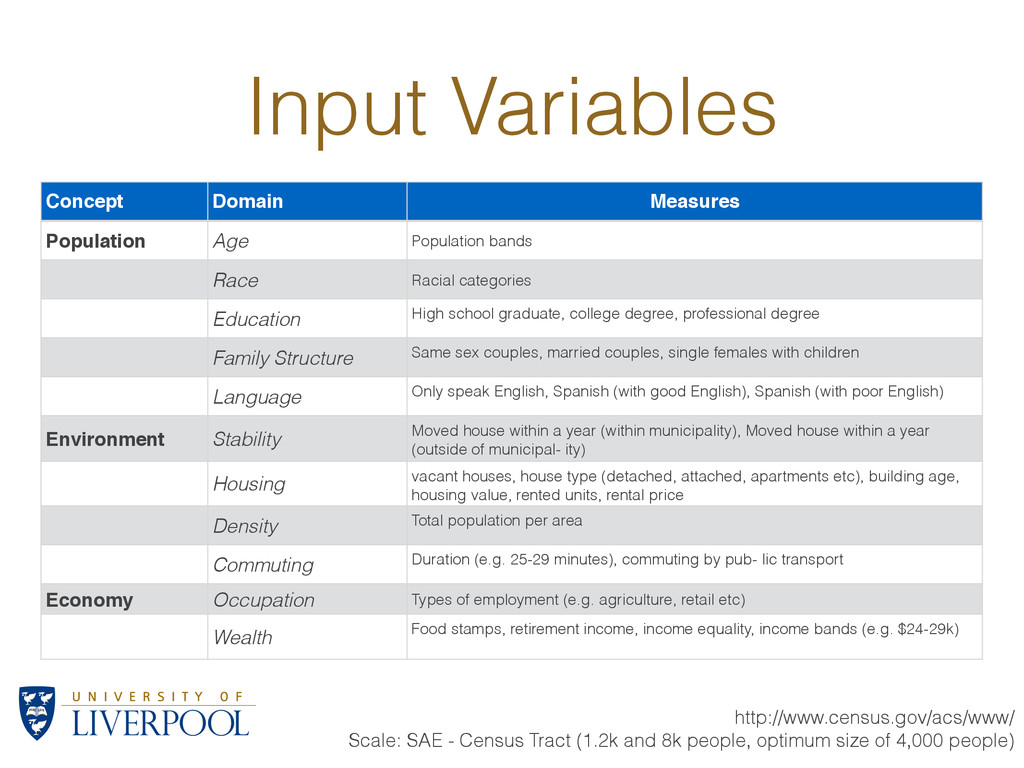
bands Family Structure Marriage; children; dependant children; Ethnicity Ethnic Groups; Spoken English; EU V New EU Housing Composition Density; communal establishment; student household; occupancy rating Type Detached, semi, terrace, flats Tenure Socially rented; private rented; owned or shared ownership Socio-Economic Health Day-to-day activities limited a lot or a little; standardised illness ratio Employment Unemployment; full time; part time Occupation Occupation groups Education Level 1; Level 2; Level 3; Level 4+ Mobility Car ownership; private transport; public transport; active transport 60 Variables
% Employed persons aged between 16 and 74 who work in the agriculture, forestry or fishing industries % Households who live in a flat % Households who are private renting Persons / Hectare
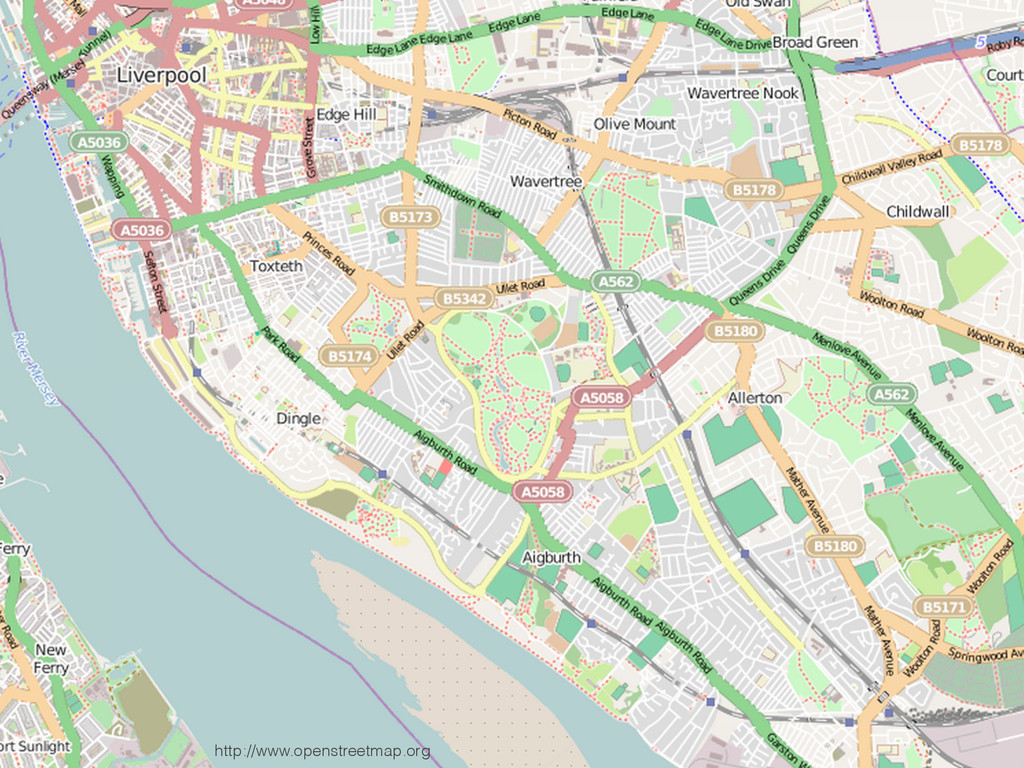
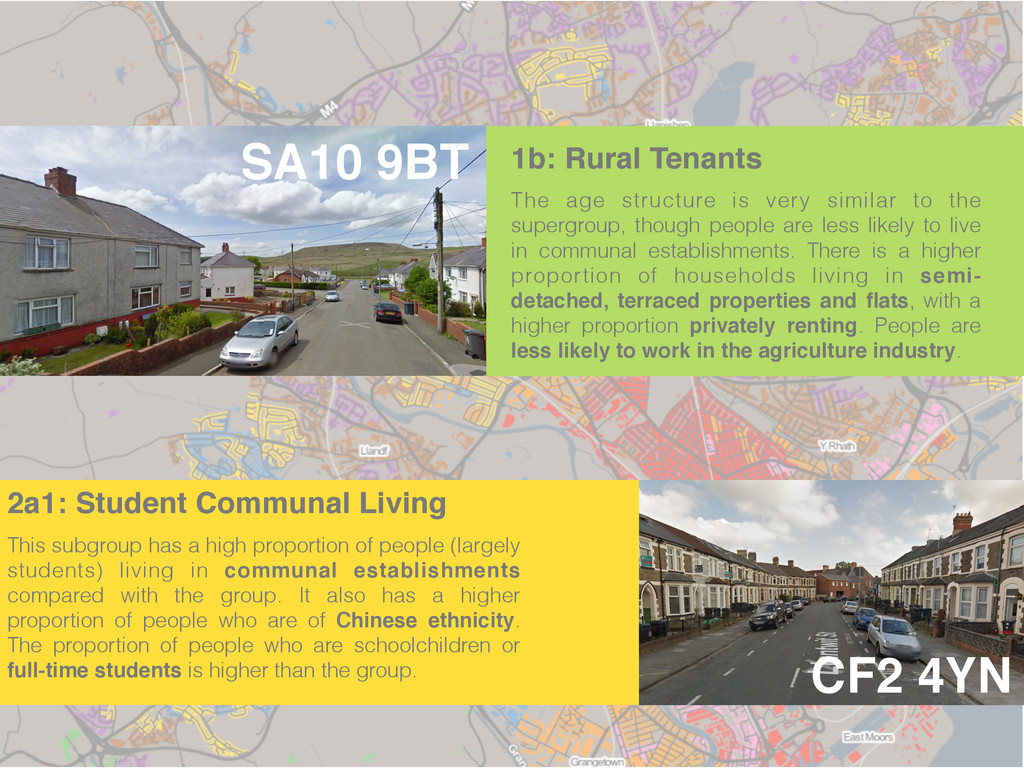
the supergroup, though people are less likely to live in communal establishments. There is a higher proportion of households living in semi- detached, terraced properties and flats, with a higher proportion privately renting. People are less likely to work in the agriculture industry. 2a1: Student Communal Living This subgroup has a high proportion of people (largely students) living in communal establishments compared with the group. It also has a higher proportion of people who are of Chinese ethnicity. The proportion of people who are schoolchildren or full-time students is higher than the group. SA10 9BT CF2 4YN
Students and minority mix C1: Asian owner occupiers C2: Transport service workers C4: Elderly Asians D1: Educational advantage D2: City central E2: Graduation occupation F1: City enclaves F2: Affluent suburbs G2: Public sector and service employees H1: Detached retirement H2: Not quite Home−Counties LOAC 2011
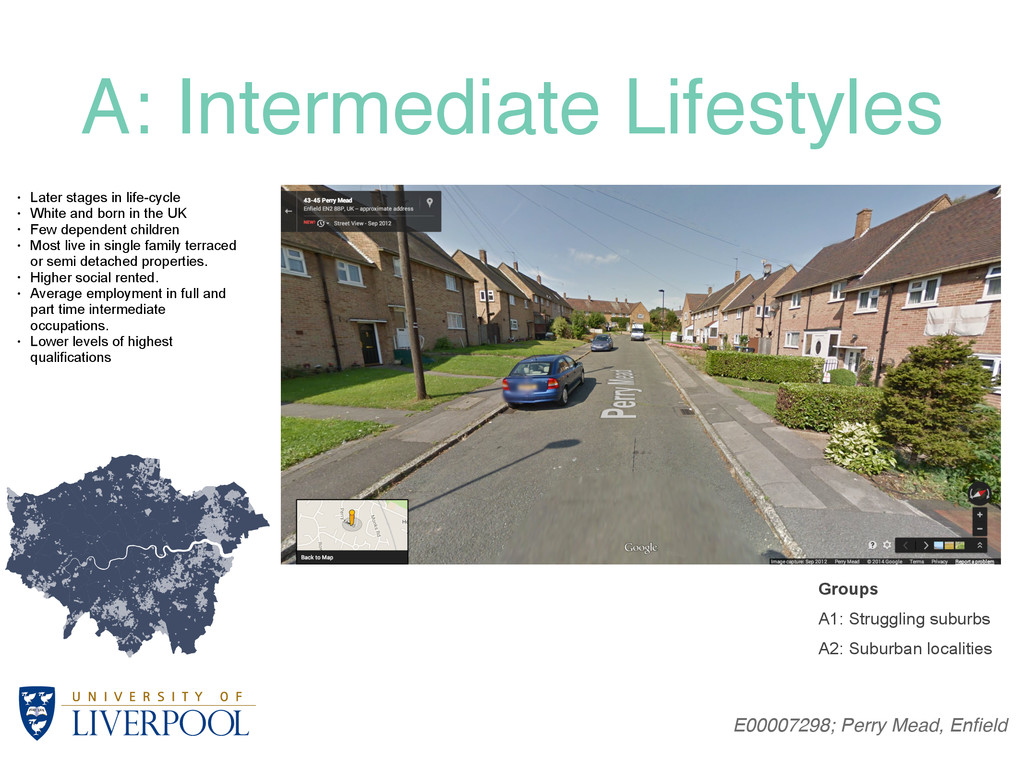
suburbs A2: Suburban localities • Later stages in life-cycle • White and born in the UK • Few dependent children • Most live in single family terraced or semi detached properties. • Higher social rented. • Average employment in full and part time intermediate occupations. • Lower levels of highest qualifications
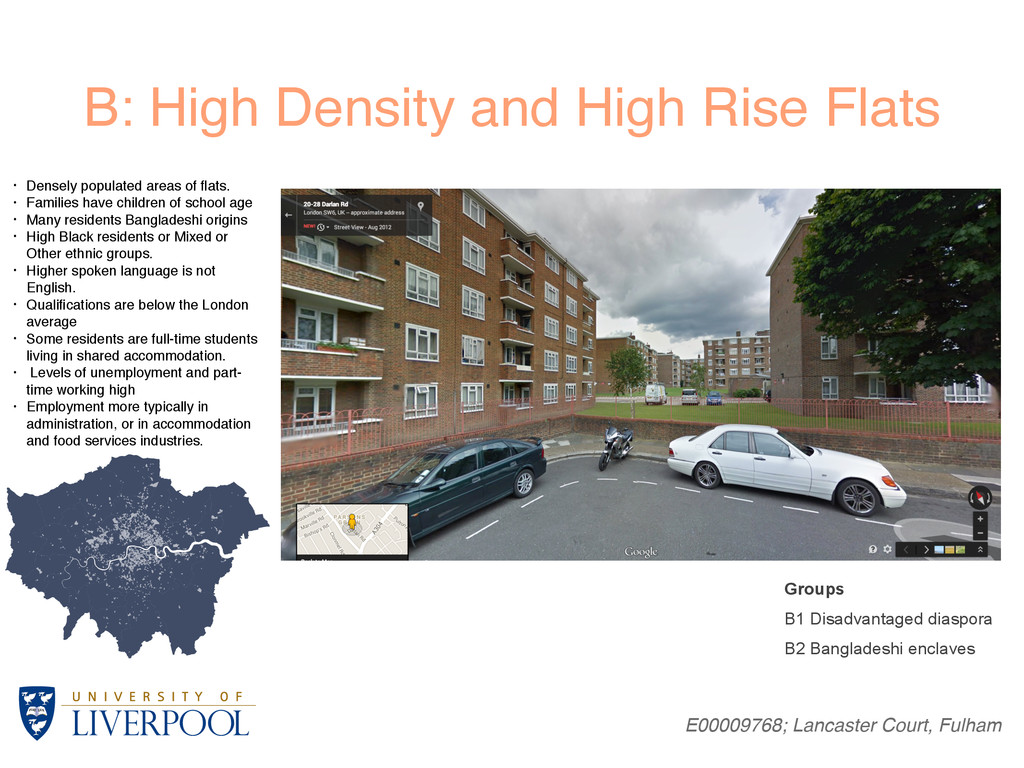
Fulham Groups B1 Disadvantaged diaspora B2 Bangladeshi enclaves • Densely populated areas of flats. • Families have children of school age • Many residents Bangladeshi origins • High Black residents or Mixed or Other ethnic groups. • Higher spoken language is not English. • Qualifications are below the London average • Some residents are full-time students living in shared accommodation. • Levels of unemployment and part- time working high • Employment more typically in administration, or in accommodation and food services industries.
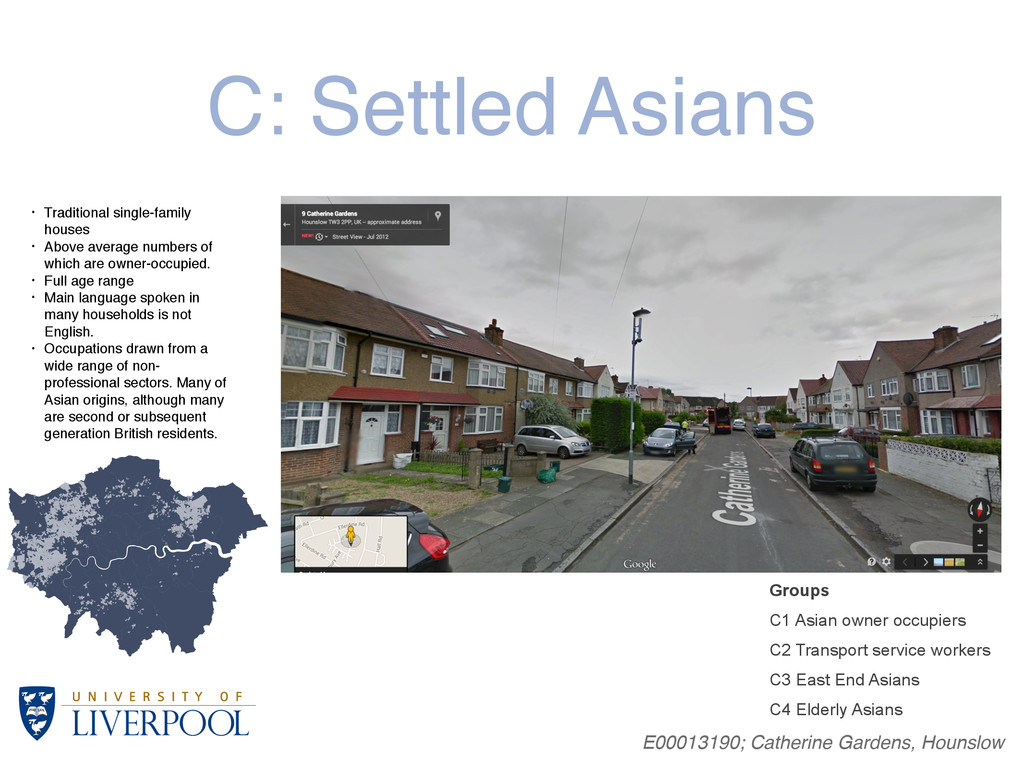
owner occupiers C2 Transport service workers C3 East End Asians C4 Elderly Asians • Traditional single-family houses • Above average numbers of which are owner-occupied. • Full age range • Main language spoken in many households is not English. • Occupations drawn from a wide range of non- professional sectors. Many of Asian origins, although many are second or subsequent generation British residents.
Educational advantage D2 City central • Young professionals • Working in the science, technology, finance and insurance sectors. Large numbers of students • Many privately owned flats • Residents are disproportionately drawn from pre 2001 EU countries, • High of Chinese, Arab and other minority backgrounds.
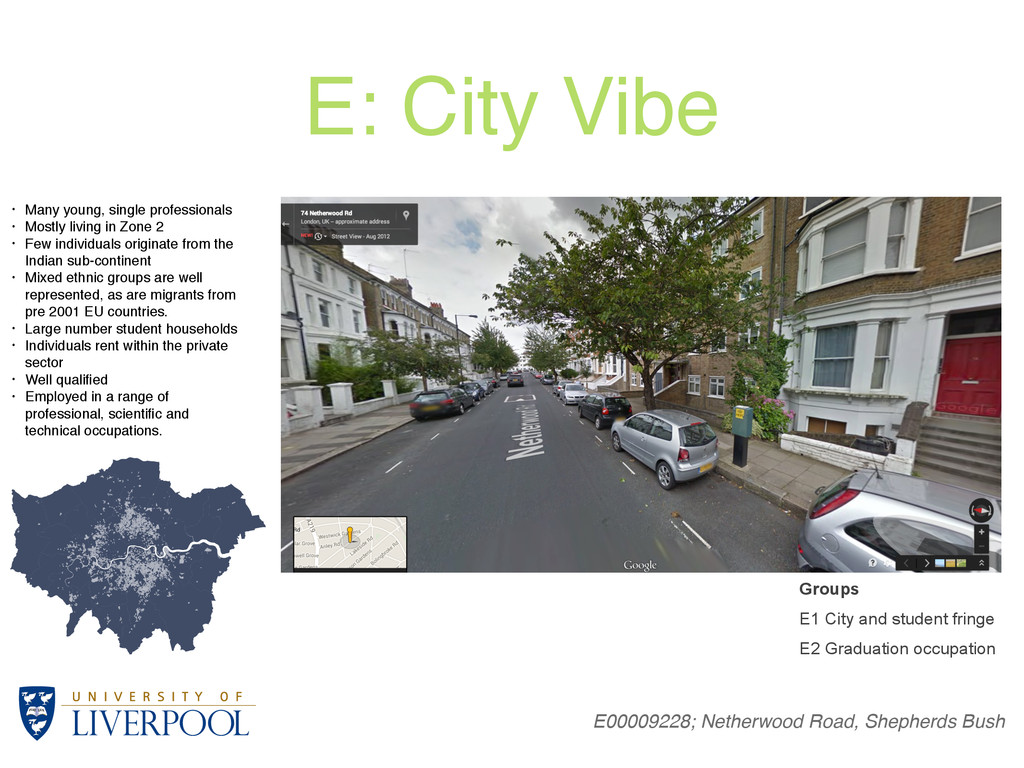
City and student fringe E2 Graduation occupation • Many young, single professionals • Mostly living in Zone 2 • Few individuals originate from the Indian sub-continent • Mixed ethnic groups are well represented, as are migrants from pre 2001 EU countries. • Large number student households • Individuals rent within the private sector • Well qualified • Employed in a range of professional, scientific and technical occupations.
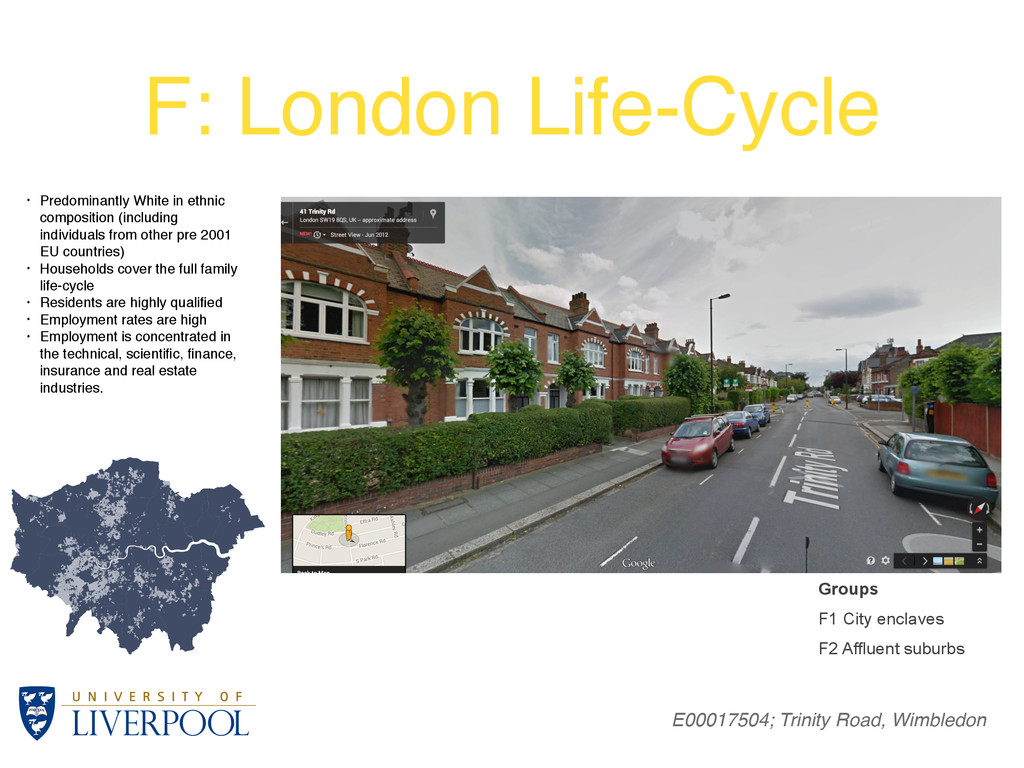
enclaves F2 Affluent suburbs • Predominantly White in ethnic composition (including individuals from other pre 2001 EU countries) • Households cover the full family life-cycle • Residents are highly qualified • Employment rates are high • Employment is concentrated in the technical, scientific, finance, insurance and real estate industries.
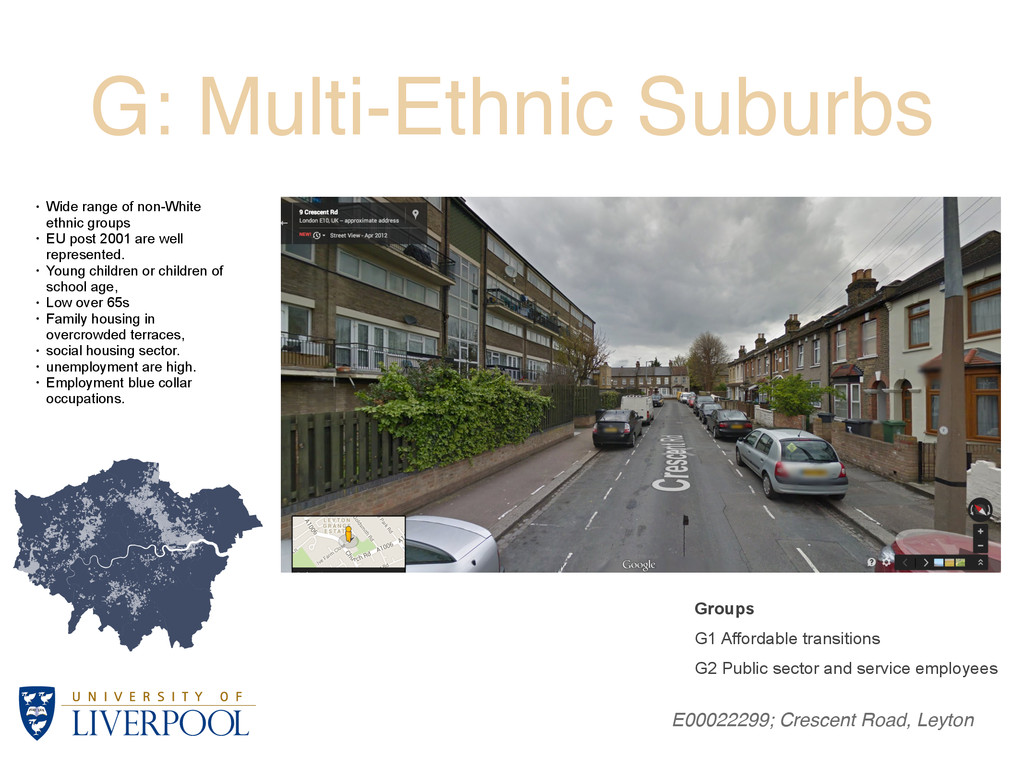
transitions G2 Public sector and service employees • Wide range of non-White ethnic groups • EU post 2001 are well represented. • Young children or children of school age, • Low over 65s • Family housing in overcrowded terraces, • social housing sector. • unemployment are high. • Employment blue collar occupations.
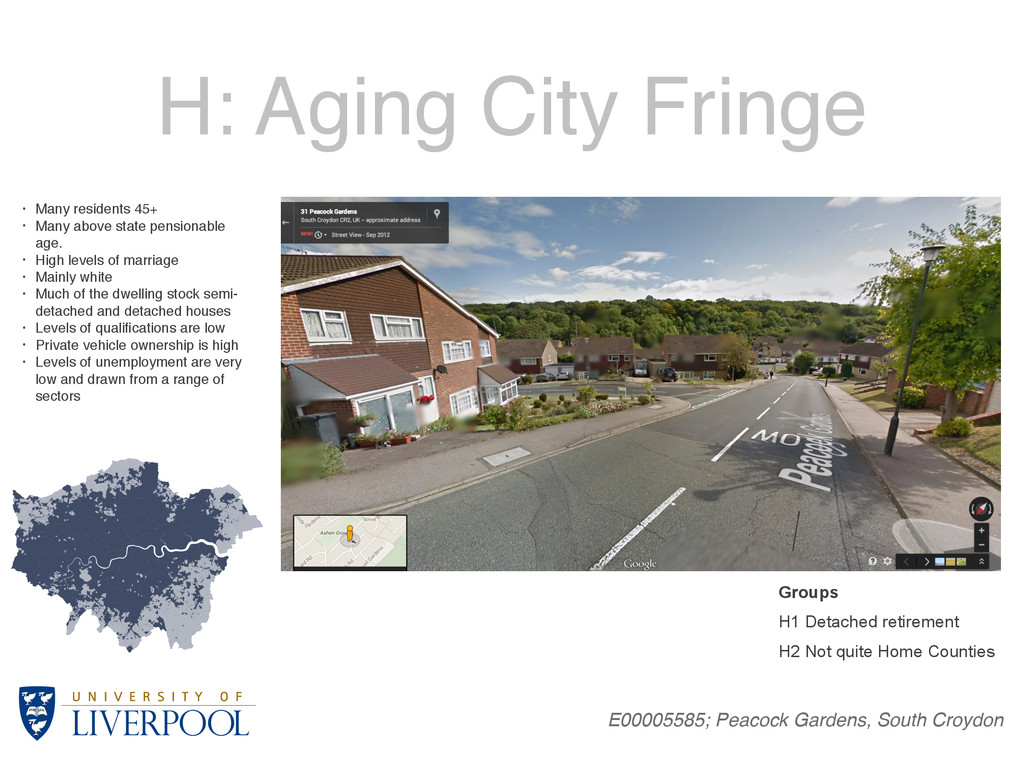
H1 Detached retirement H2 Not quite Home Counties • Many residents 45+ • Many above state pensionable age. • High levels of marriage • Mainly white • Much of the dwelling stock semi- detached and detached houses • Levels of qualifications are low • Private vehicle ownership is high • Levels of unemployment are very low and drawn from a range of sectors
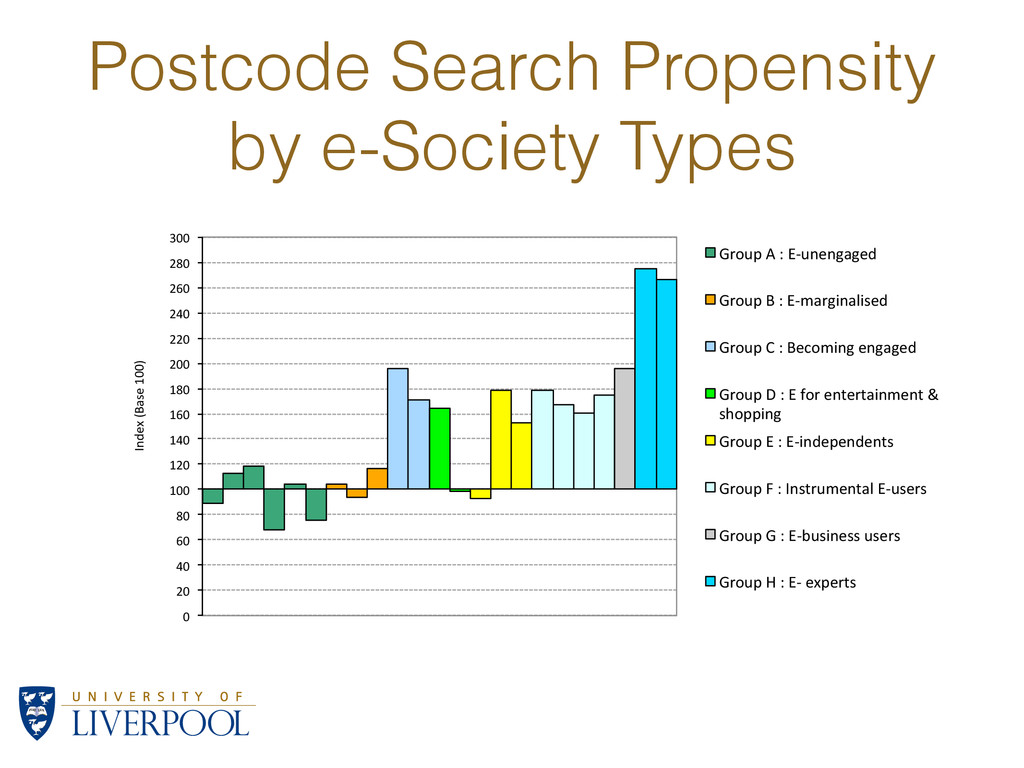
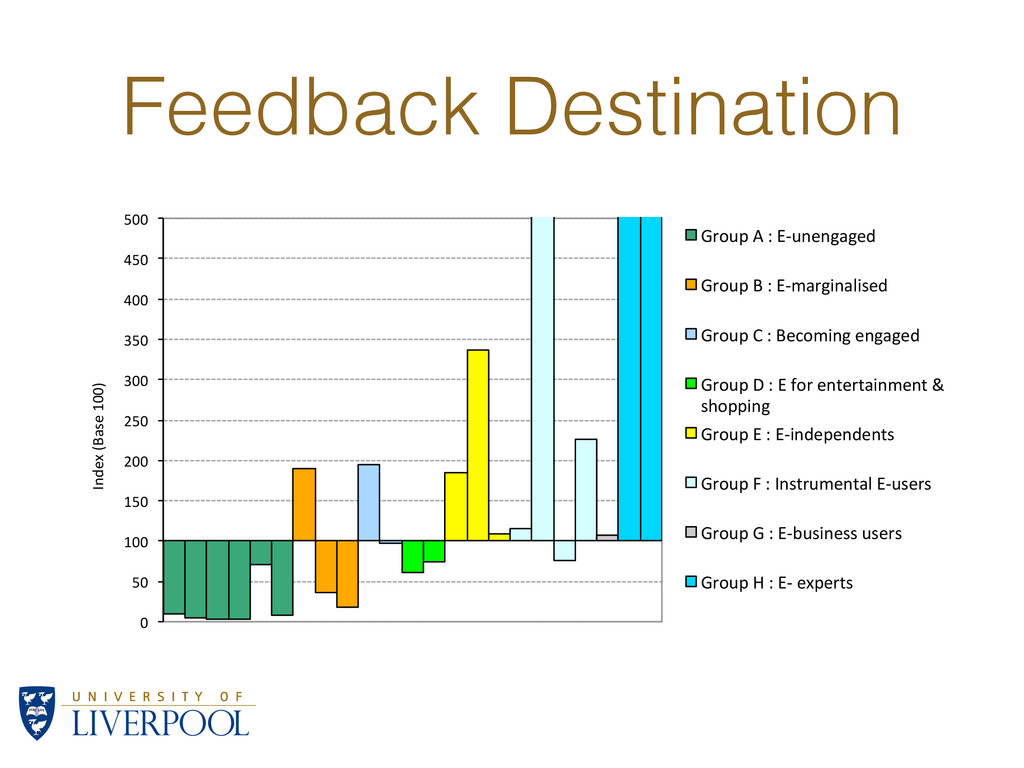
– “Haves” & “Have-nots” • Digital Divide • By 2007 things were radically different • Usage & Engagement increasingly more complex • Created a classification which consisted of 8 Groups & 23 Types. – Links to Postcode.
Racial categories Education High school graduate, college degree, professional degree Family Structure Same sex couples, married couples, single females with children Language Only speak English, Spanish (with good English), Spanish (with poor English) Environment Stability Moved house within a year (within municipality), Moved house within a year (outside of municipal- ity) Housing vacant houses, house type (detached, attached, apartments etc), building age, housing value, rented units, rental price Density Total population per area Commuting Duration (e.g. 25-29 minutes), commuting by pub- lic transport Economy Occupation Types of employment (e.g. agriculture, retail etc) Wealth Food stamps, retirement income, income equality, income bands (e.g. $24-29k) http://www.census.gov/acs/www/ Scale: SAE - Census Tract (1.2k and 8k people, optimum size of 4,000 people)
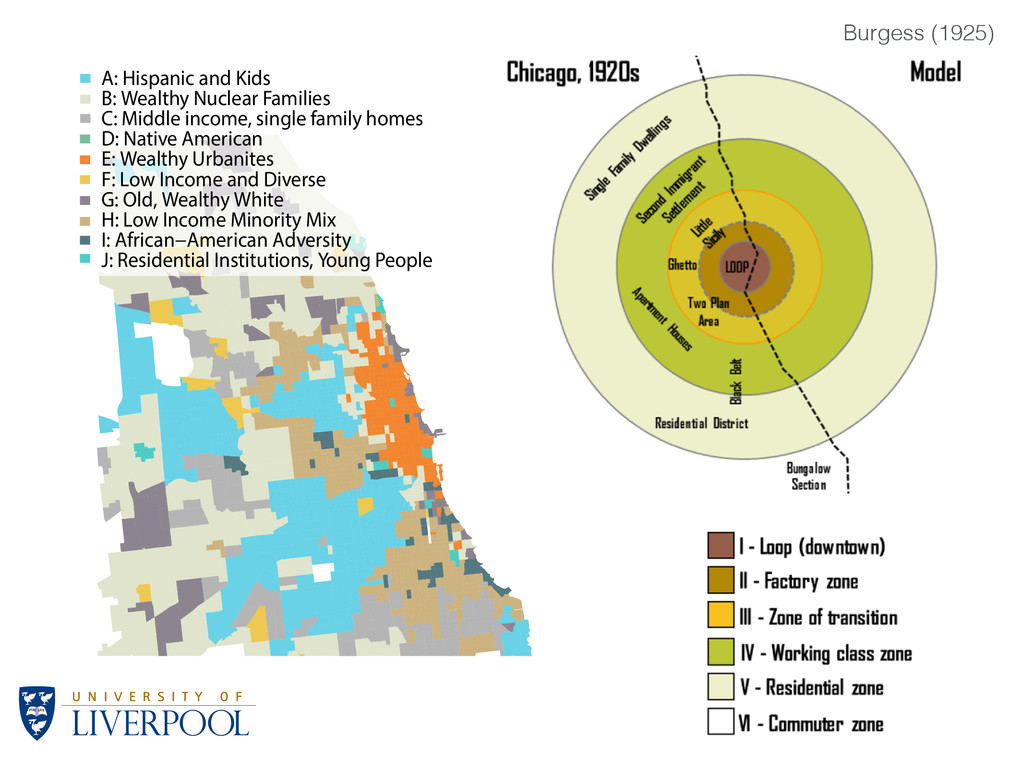
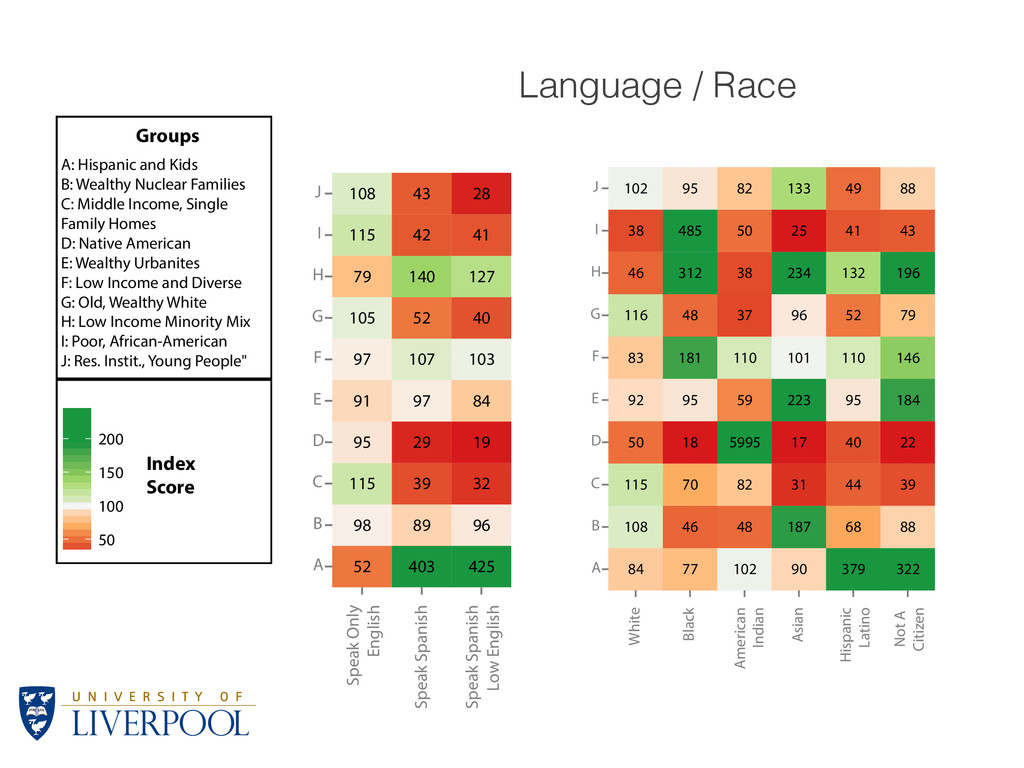
income, single family homes D: Native American E: Wealthy Urbanites F: Low Income and Diverse G: Old, Wealthy White H: Low Income Minority Mix I: African−American Adversity J: Residential Institutions, Young People Burgess (1925)
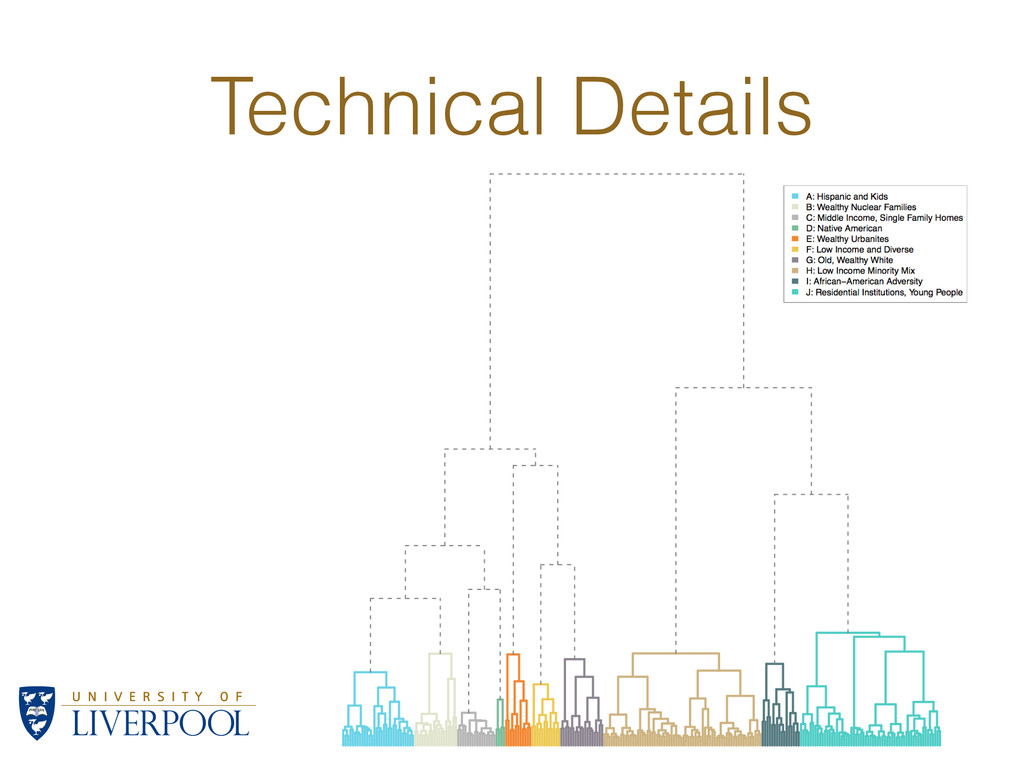
income, single family homes D: Native American E: Wealthy Urbanites F: Low Income and Diverse G: Old, Wealthy White H: Low Income Minority Mix I: African−American Adversity J: Residential Institutions, Young People
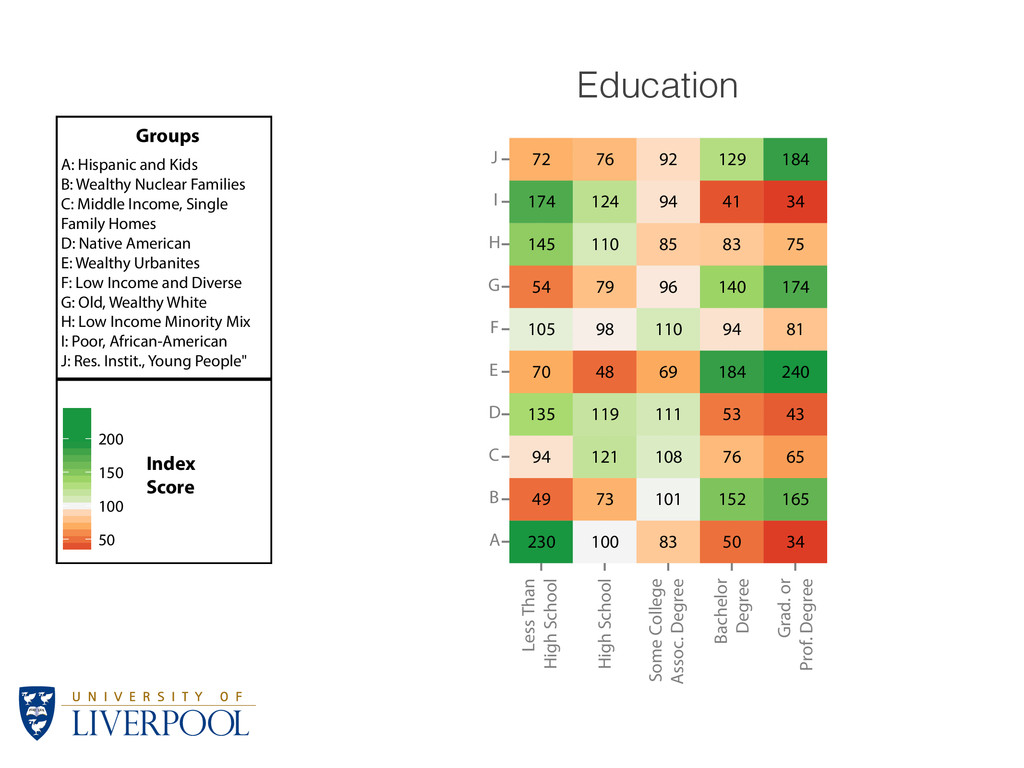
100 73 121 119 48 98 79 110 124 76 83 101 108 111 69 110 96 85 94 92 50 152 76 53 184 94 140 83 41 129 34 165 65 43 240 81 174 75 34 184 A B C D E F G H I J Less Than High School High School Some College Assoc. Degree Bachelor Degree Grad. or Prof. Degree 50 100 150 200 A: Hispanic and Kids B: Wealthy Nuclear Families C: Middle Income, Single Family Homes D: Native American E: Wealthy Urbanites F: Low Income and Diverse G: Old, Wealthy White H: Low Income Minority Mix I: Poor, African-American J: Res. Instit., Young People" Groups Index Score Education
Nuclear Families C: Middle Income, Single Family Homes D: Native American E: Wealthy Urbanites F: Low Income and Diverse G: Old, Wealthy White H: Low Income Minority Mix I: Poor, African-American J: Res. Instit., Young People" Groups Index Score Language / Race 52 98 115 95 91 97 105 79 115 108 403 89 39 29 97 107 52 140 42 43 425 96 32 19 84 103 40 127 41 28 A B C D E F G H I J Speak Only English Speak Spanish Speak Spanish Low English 84 108 115 50 92 83 116 46 38 102 77 46 70 18 95 181 48 312 485 95 102 48 82 5995 59 110 37 38 50 82 90 187 31 17 223 101 96 234 25 133 379 68 44 40 95 110 52 132 41 49 322 88 39 22 184 146 79 196 43 88 A B C D E F G H I J White Black American Indian Asian Hispanic Latino Not A Citizen
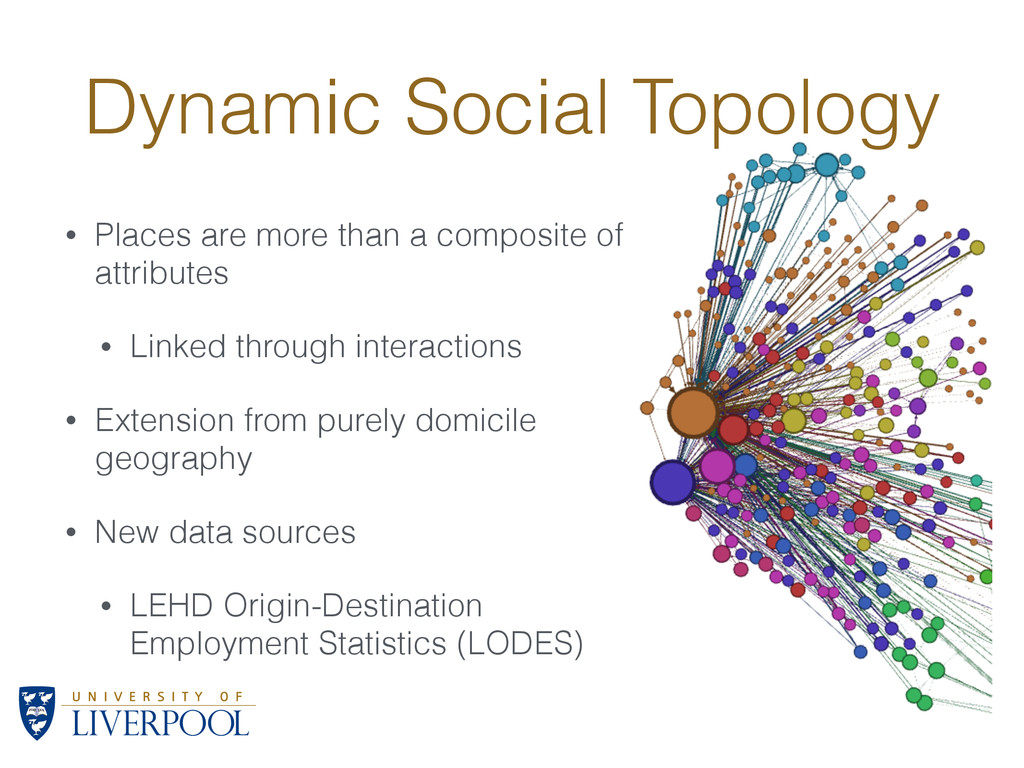
of attributes • Linked through interactions • Extension from purely domicile geography • New data sources • LEHD Origin-Destination Employment Statistics (LODES)