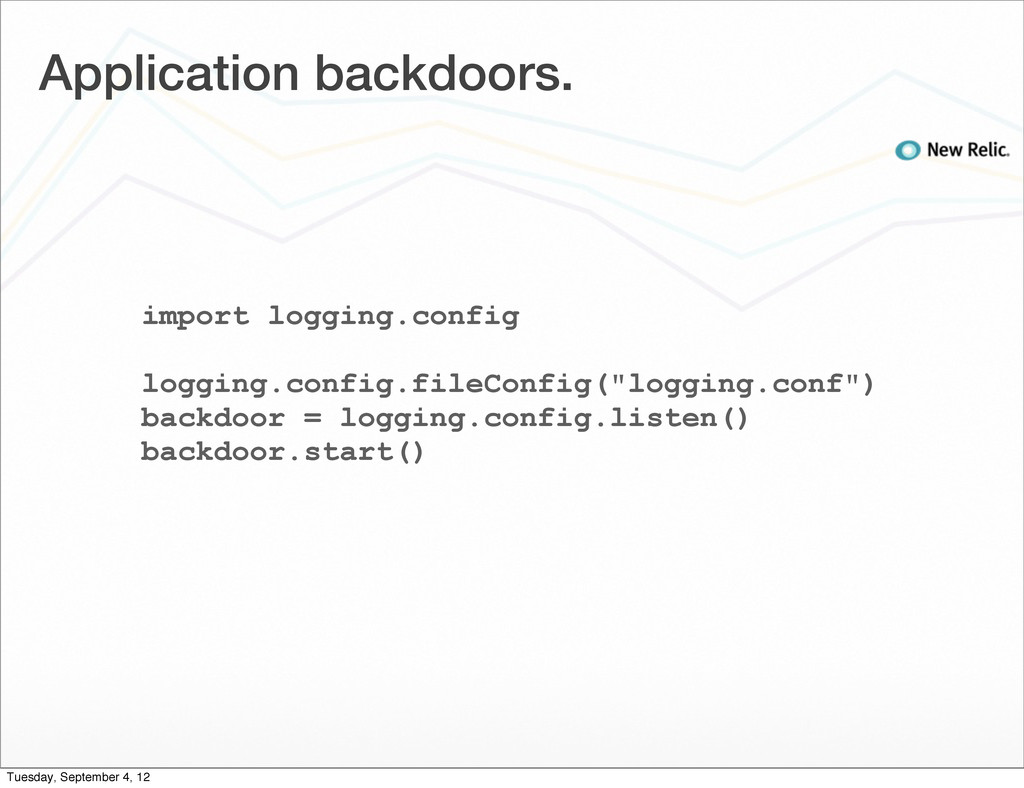
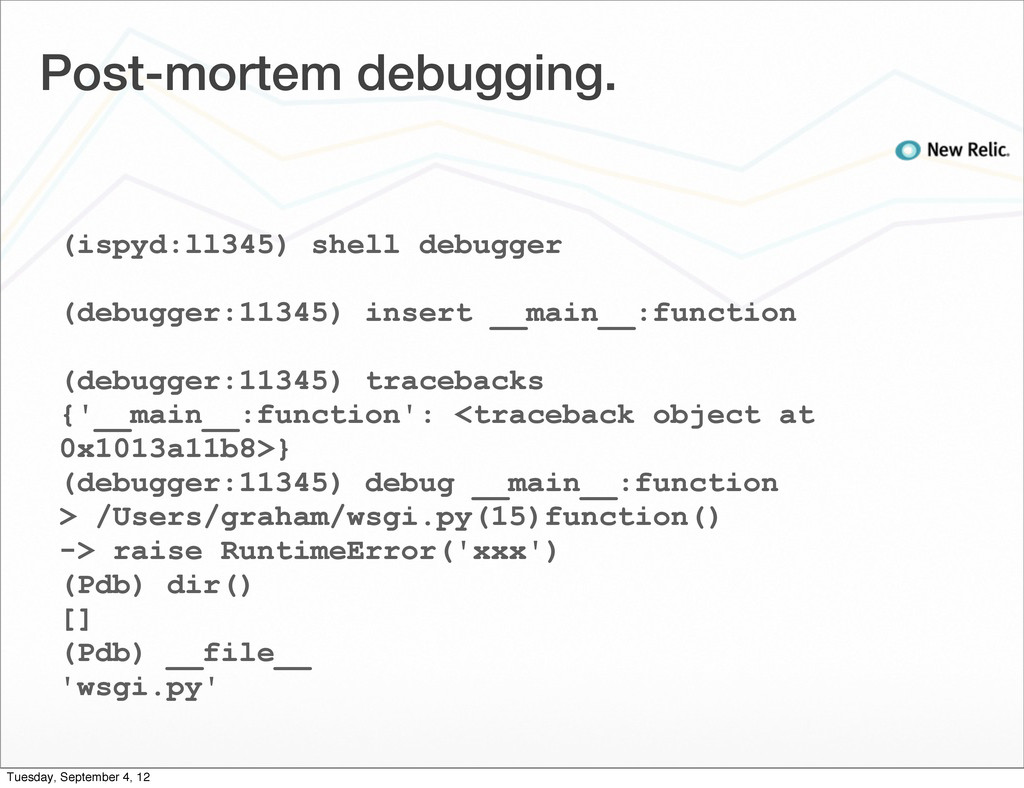
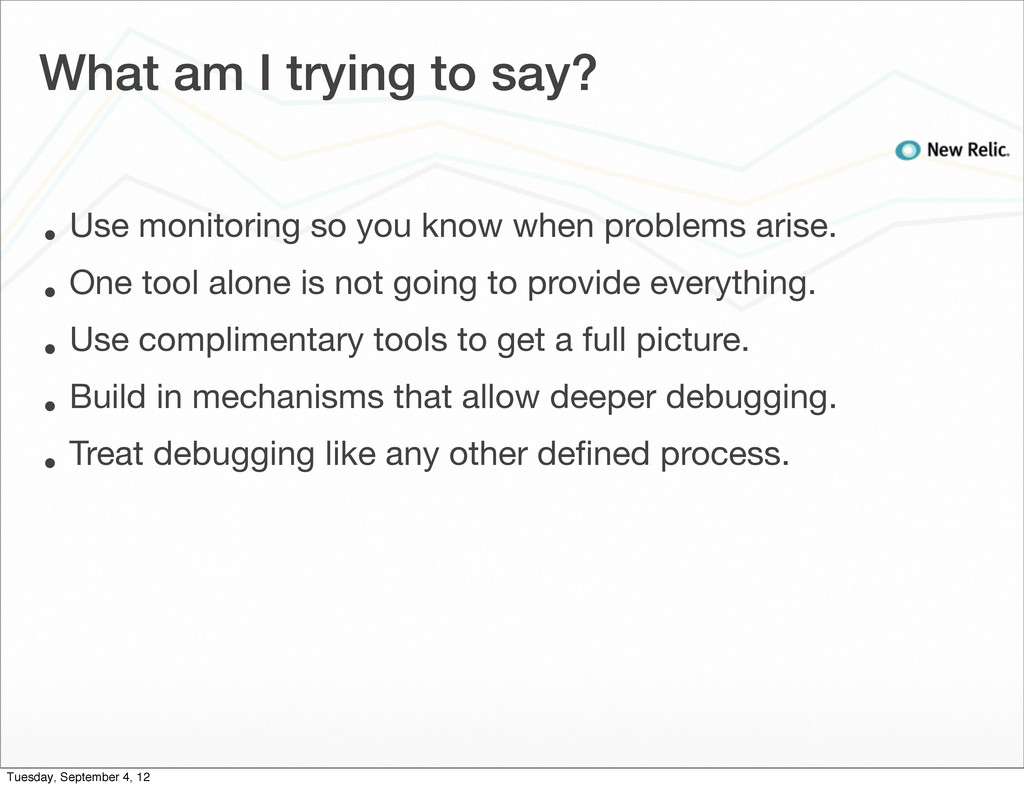
Monitoring tools record the result of what happened to your web application when a problem arises, but for some classes of problems, monitoring systems are only a starting point. Sometimes it is necessary to take more intrusive steps to plan for the unexpected by embedding mechanisms that will allow you to interact with a live deployed web application and extract even more detailed information.
![Instrumentation via configuration. [newrelic] transaction_tracer.function_trace = awesome_dbm:open awesome_dbm:_Database._commit Tuesday, September](https://files.speakerdeck.com/presentations/50460384e76a640002007a6b/slide_25.jpg)
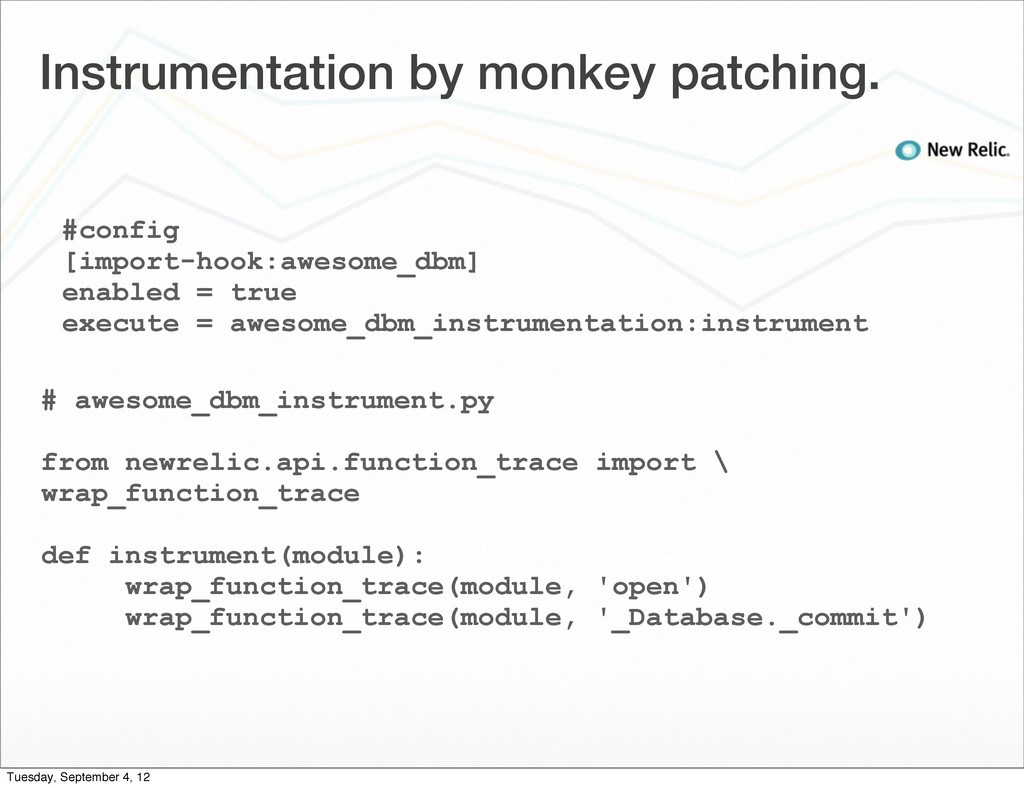
![Instrumentation by monkey patching. #config [import-hook:awesome_dbm] enabled = true execute](https://files.speakerdeck.com/presentations/50460384e76a640002007a6b/slide_26.jpg)
![New Relic 30 Day Free Pro Trail http://newrelic.com/30 [email protected] @GrahamDumpleton](https://files.speakerdeck.com/presentations/50460384e76a640002007a6b/slide_46.jpg)