Upgrade to Pro — share decks privately, control downloads, hide ads and more …

Detection and Quantification of Flow Consistency in Business Process Models

Detection and Quantification of Flow Consistency in Business Process Models

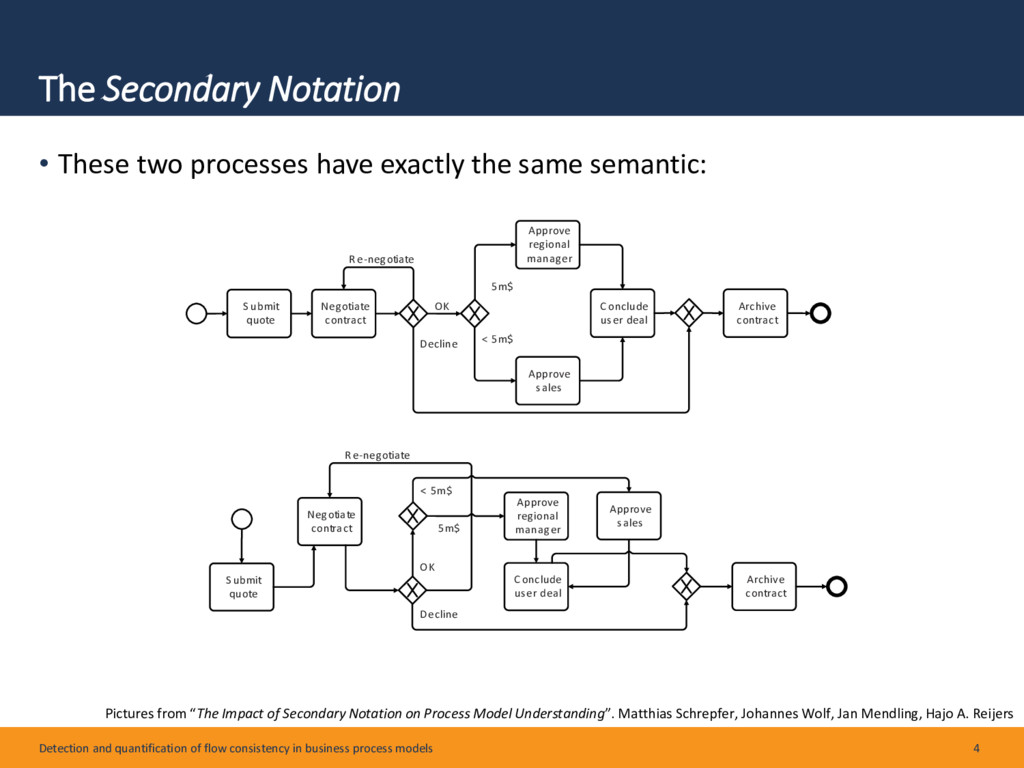
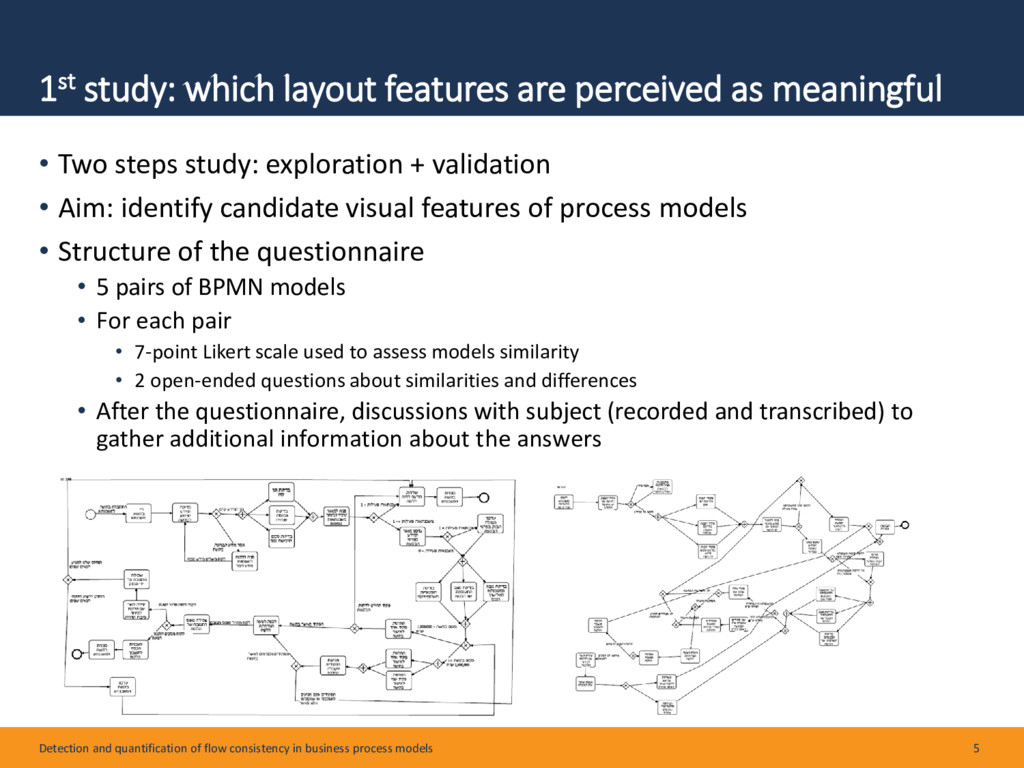
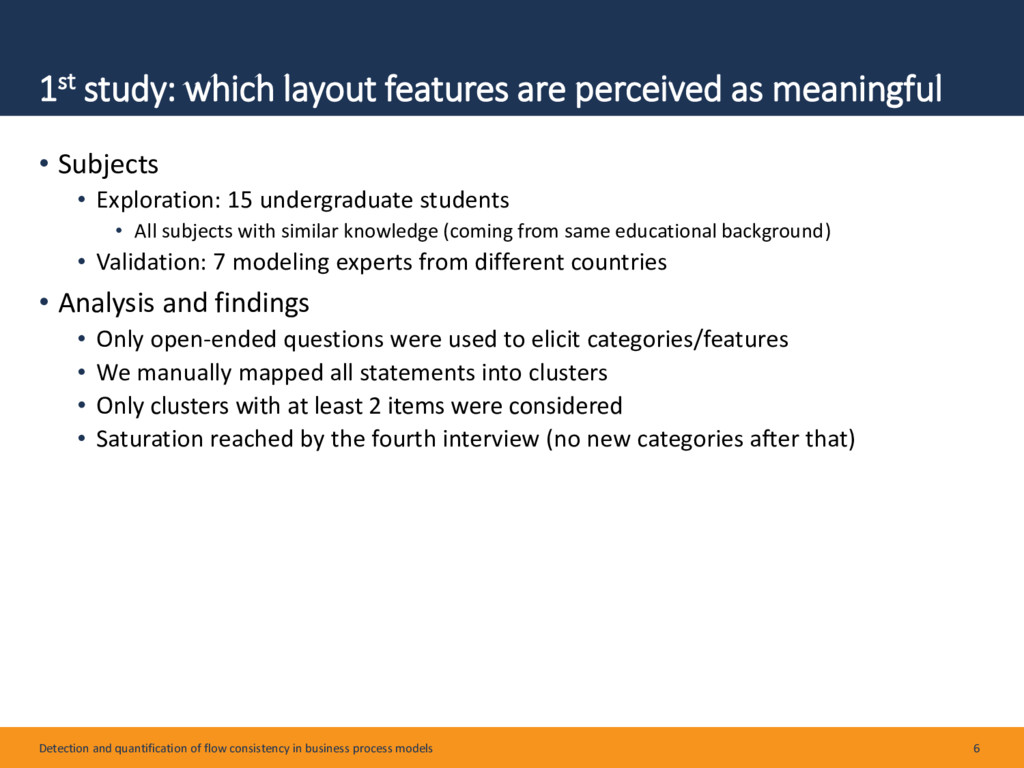
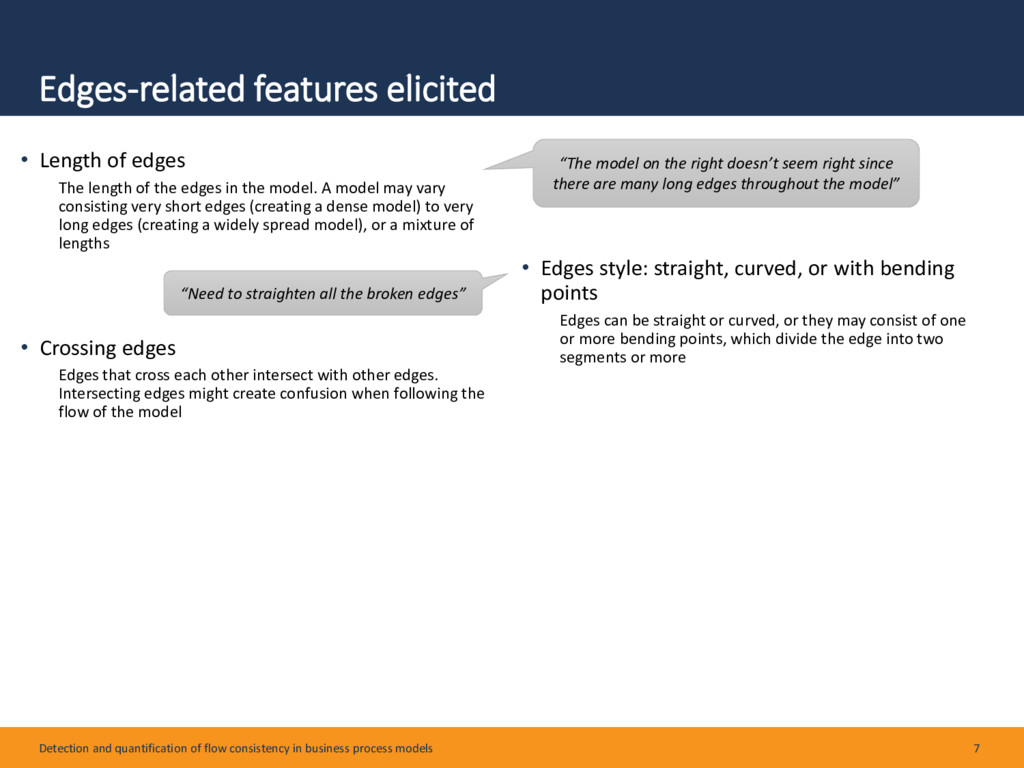
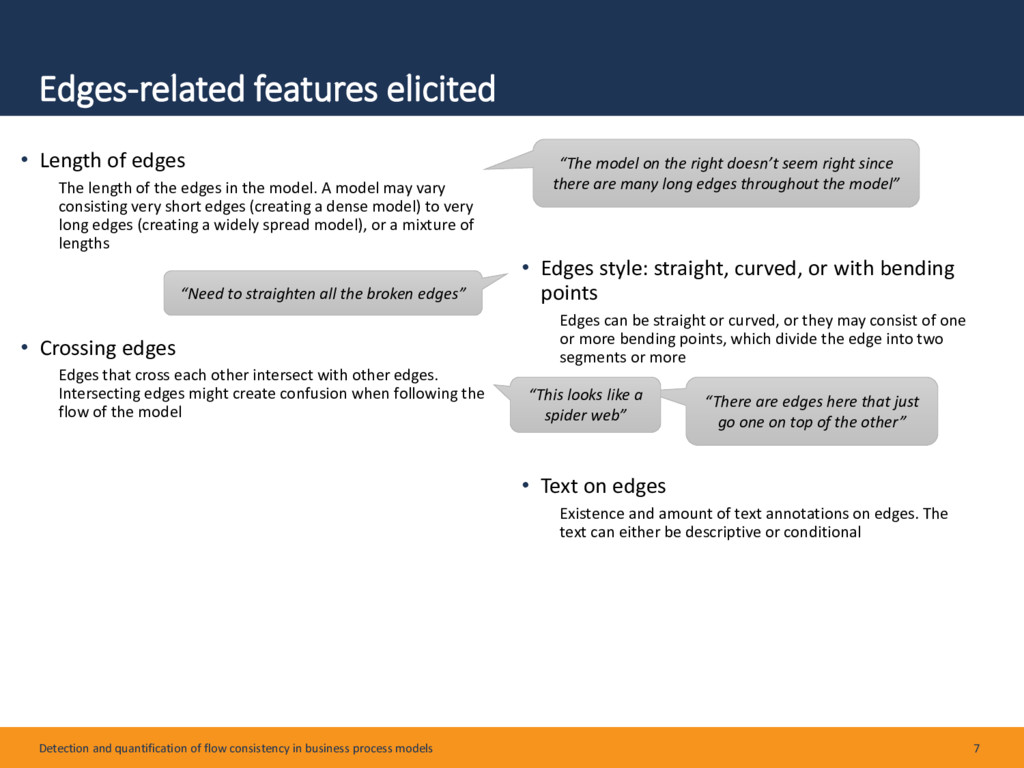
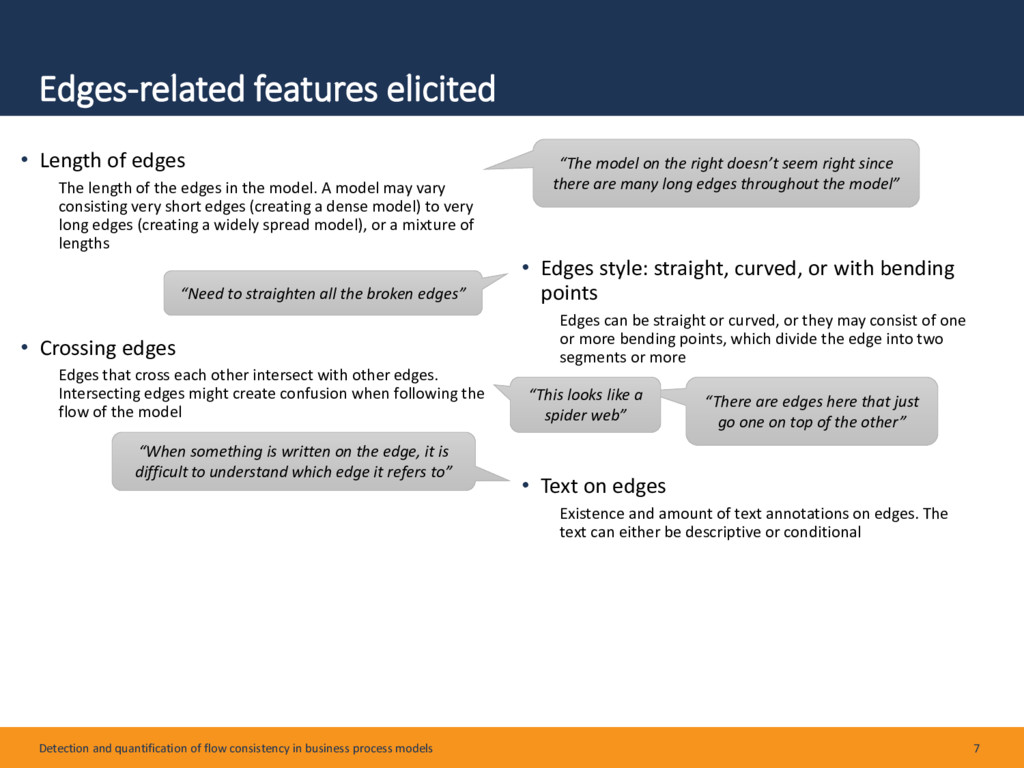
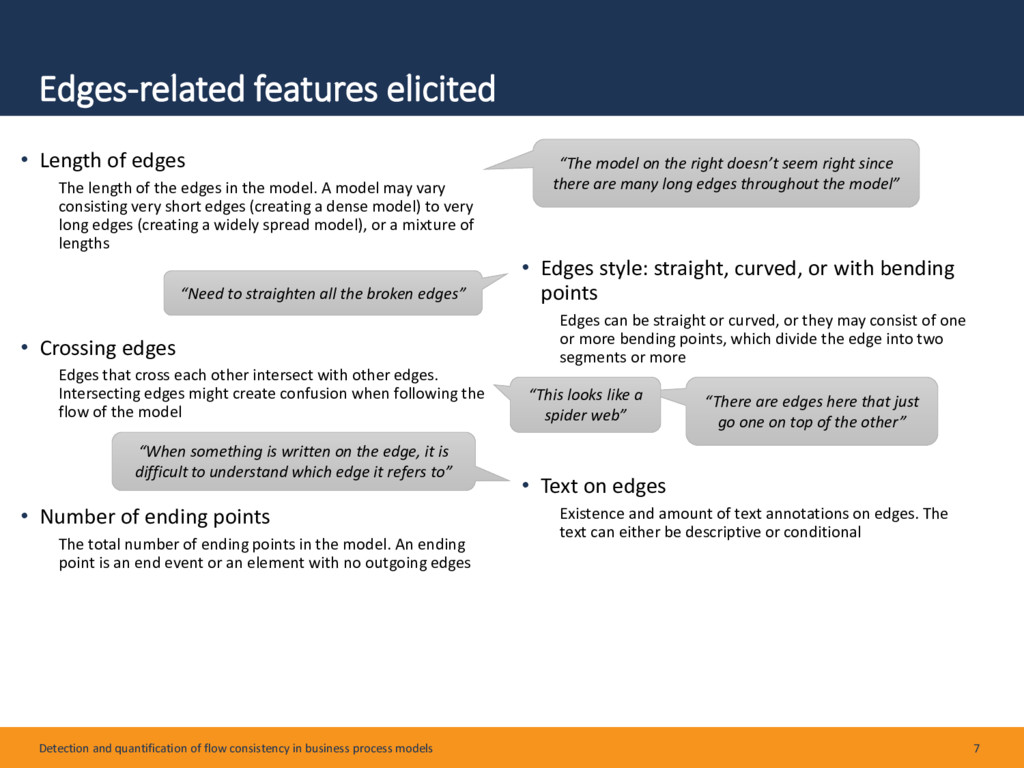
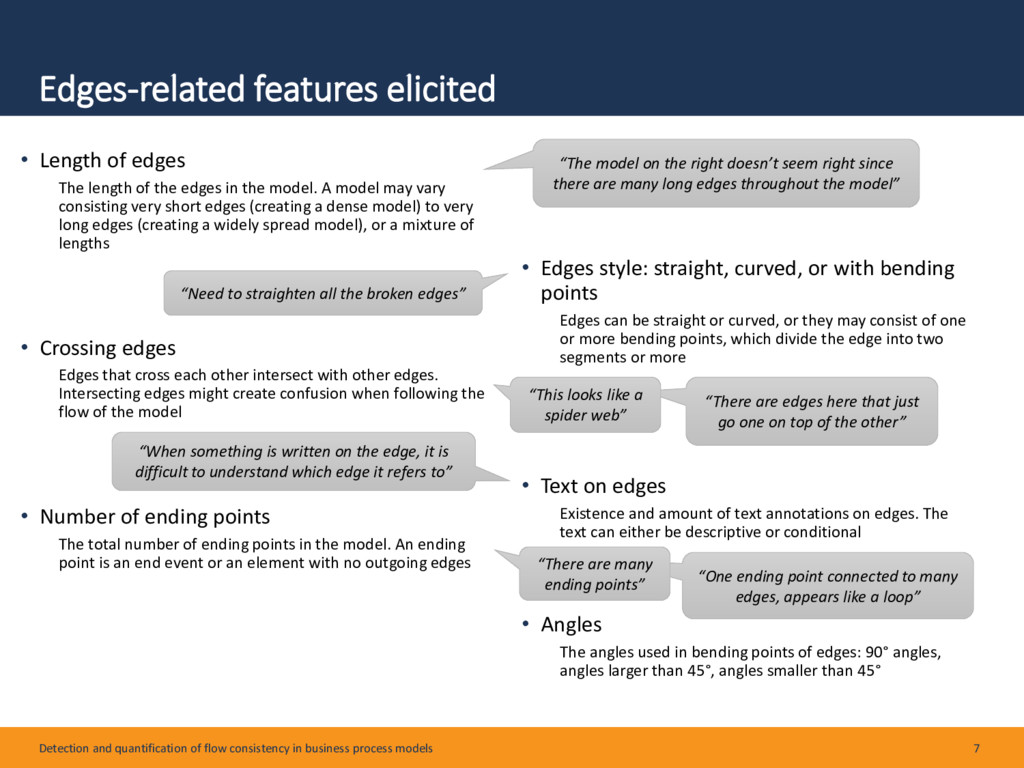
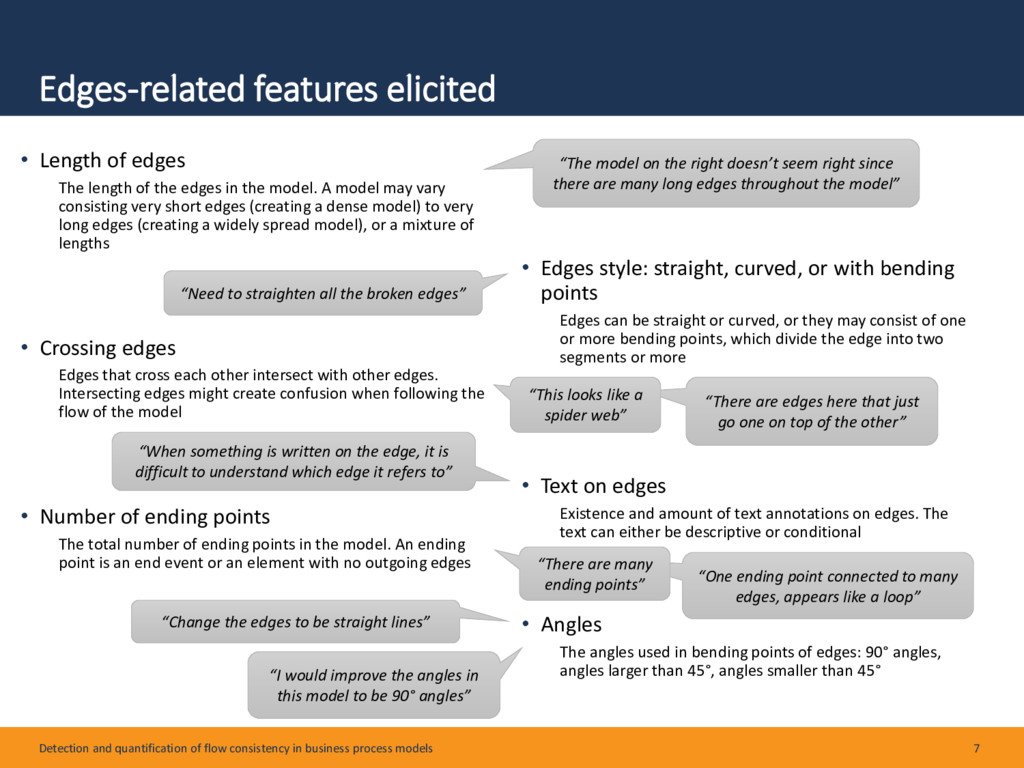
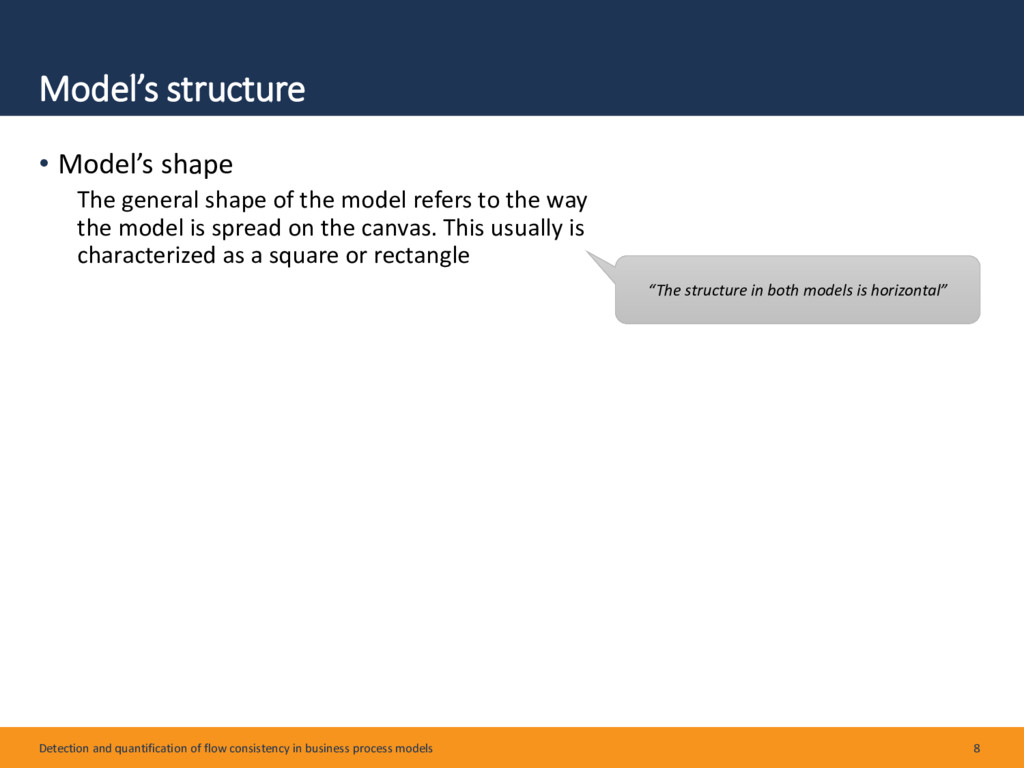
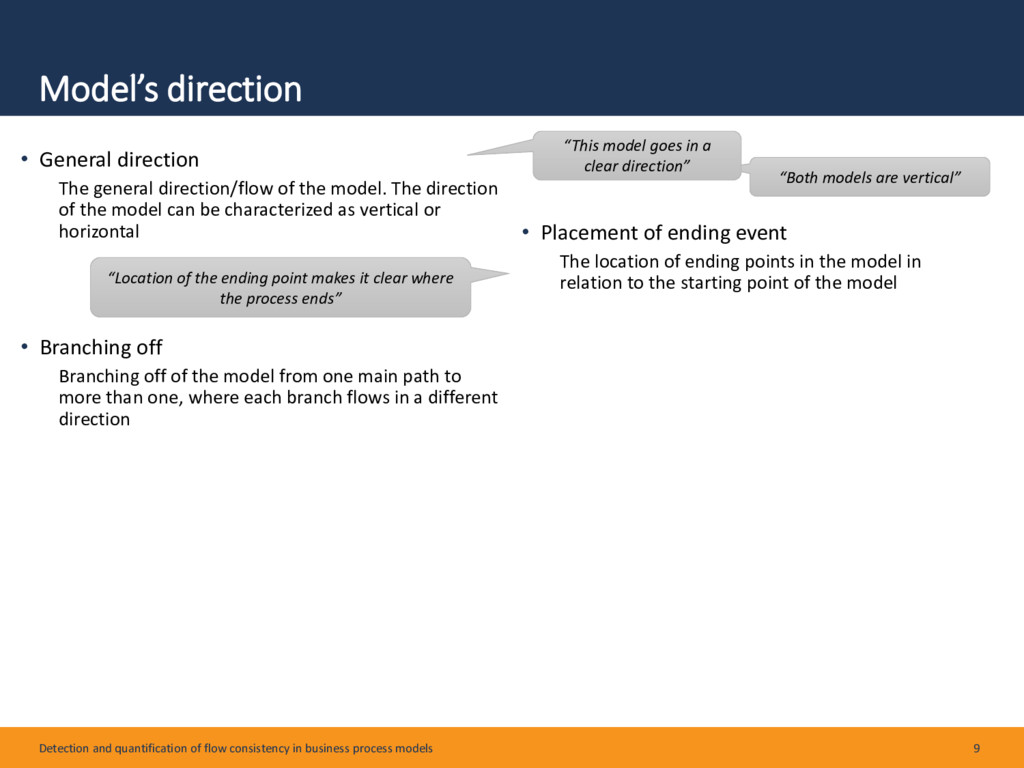
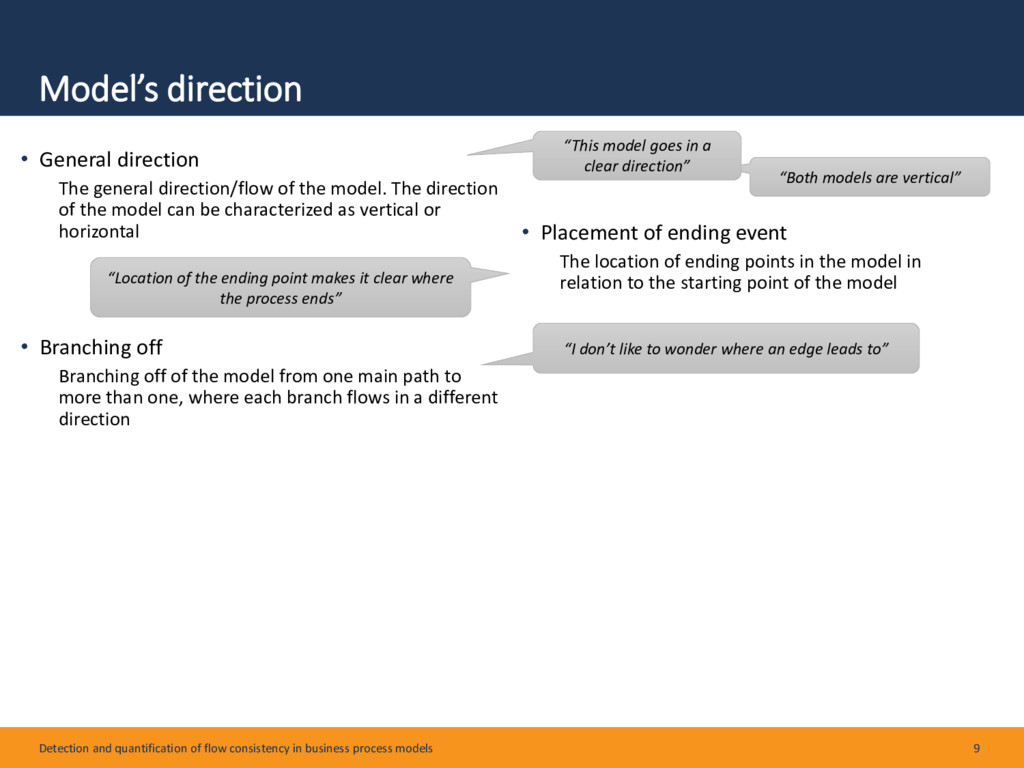
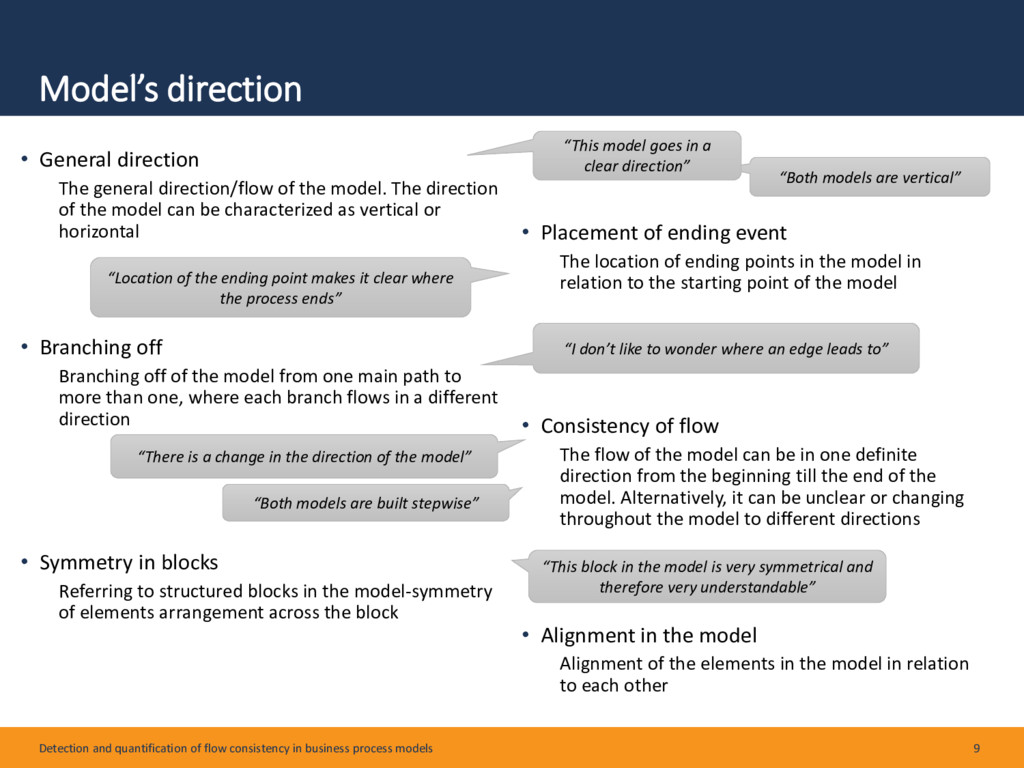
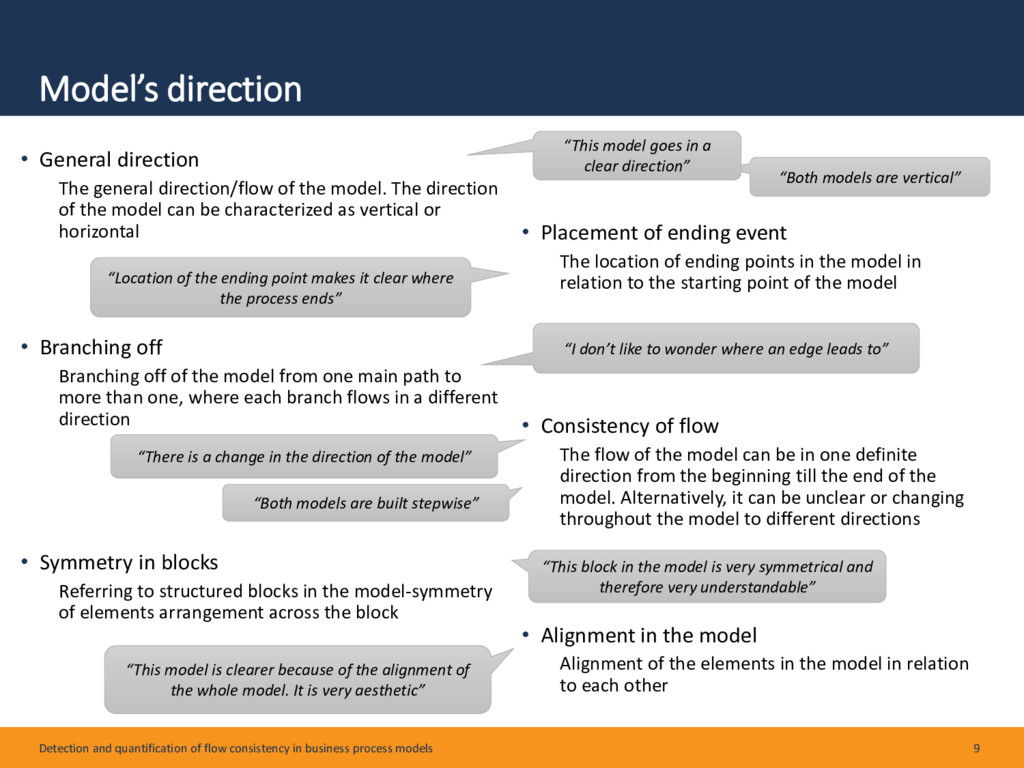
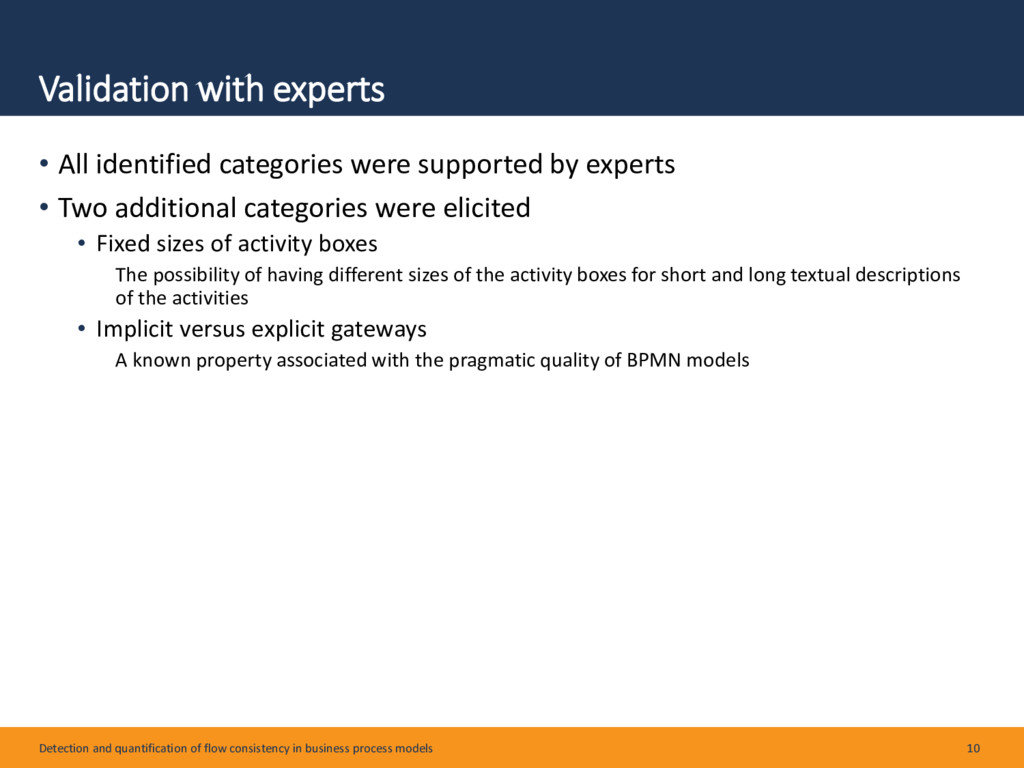
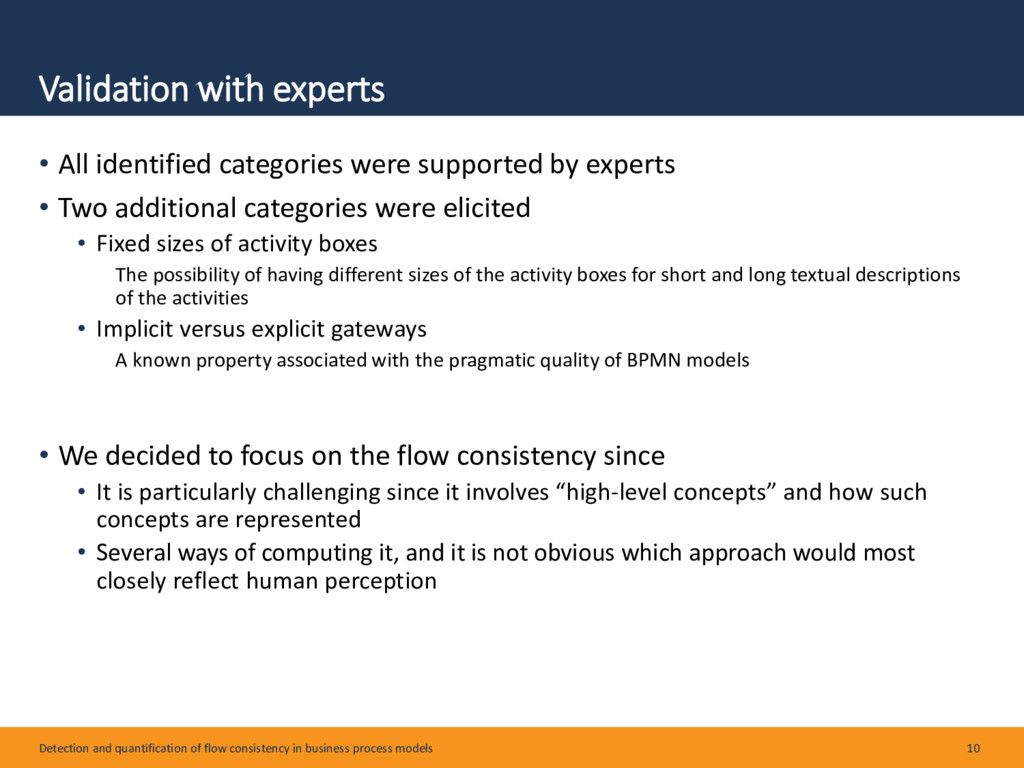
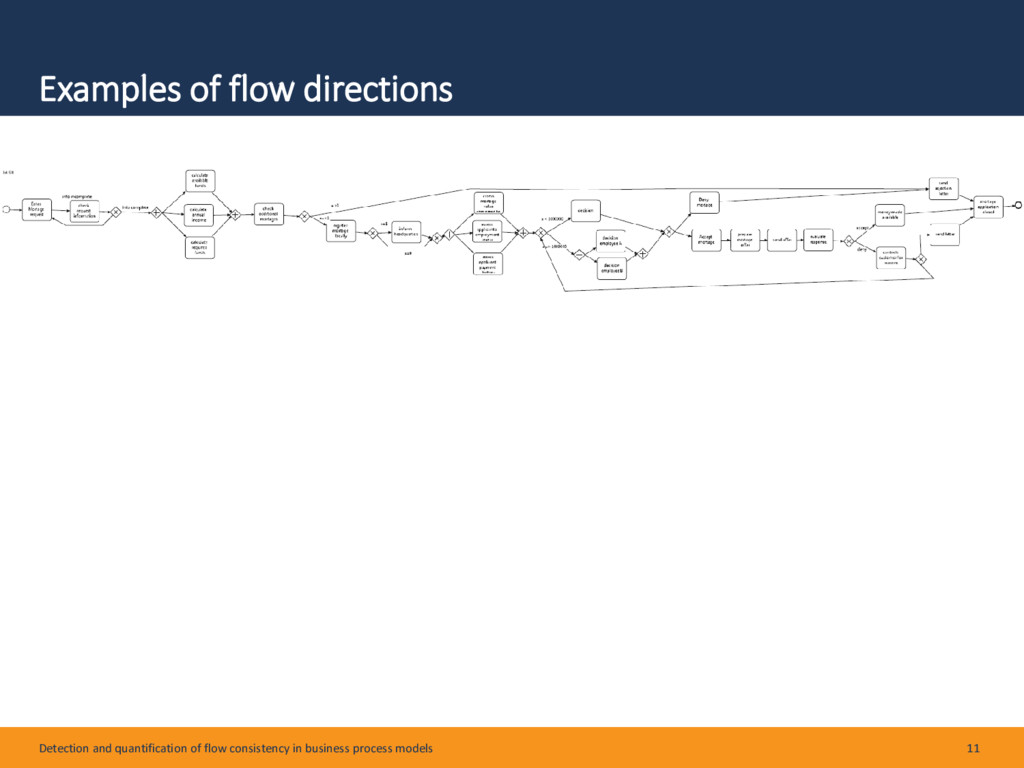
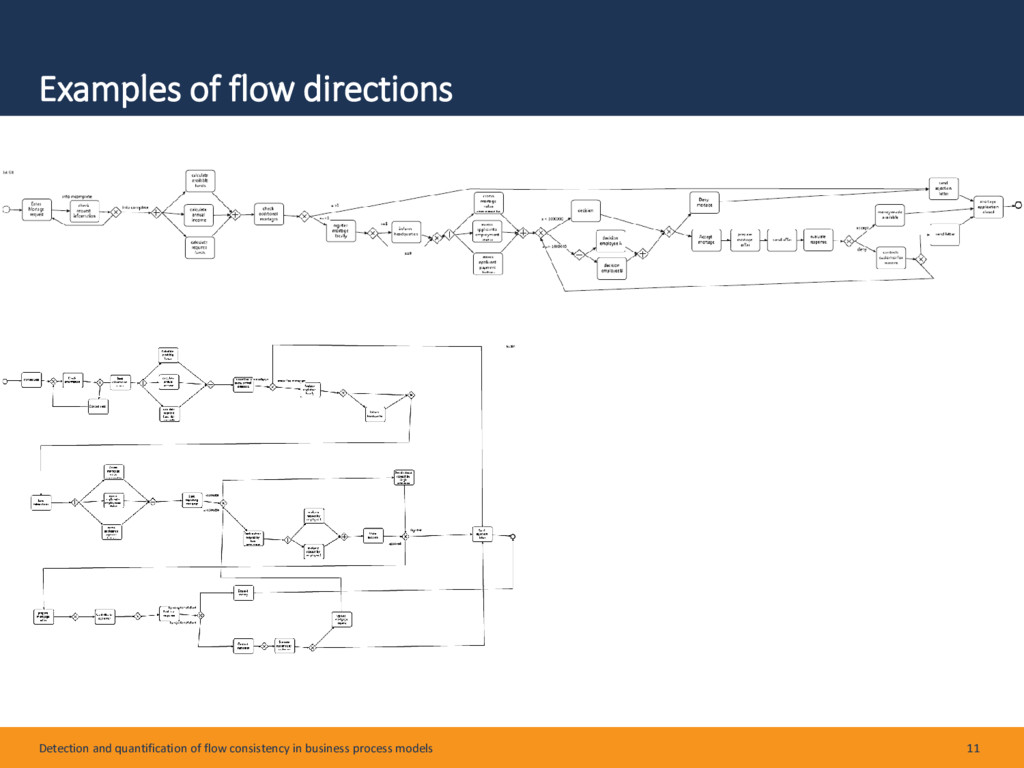
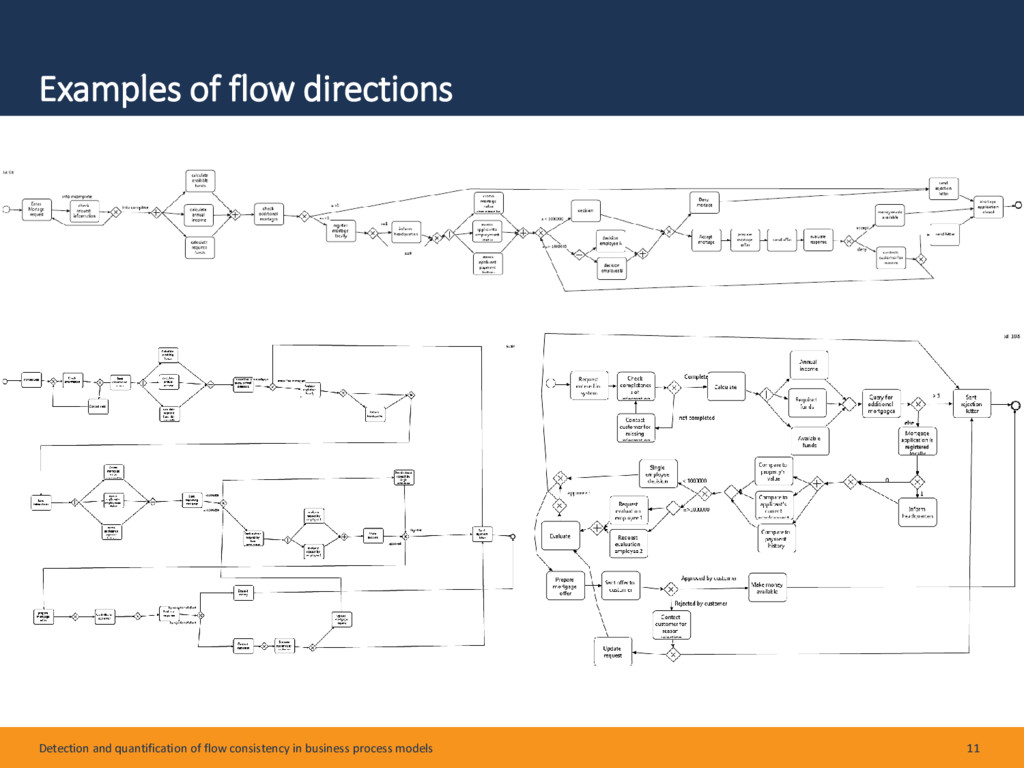
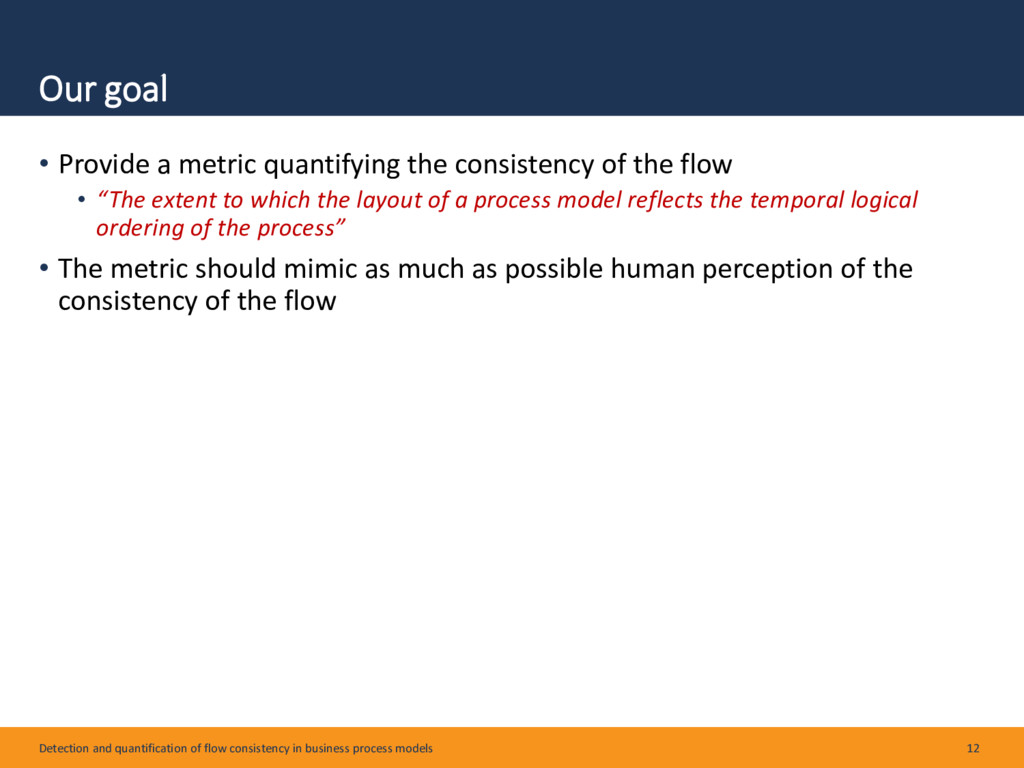
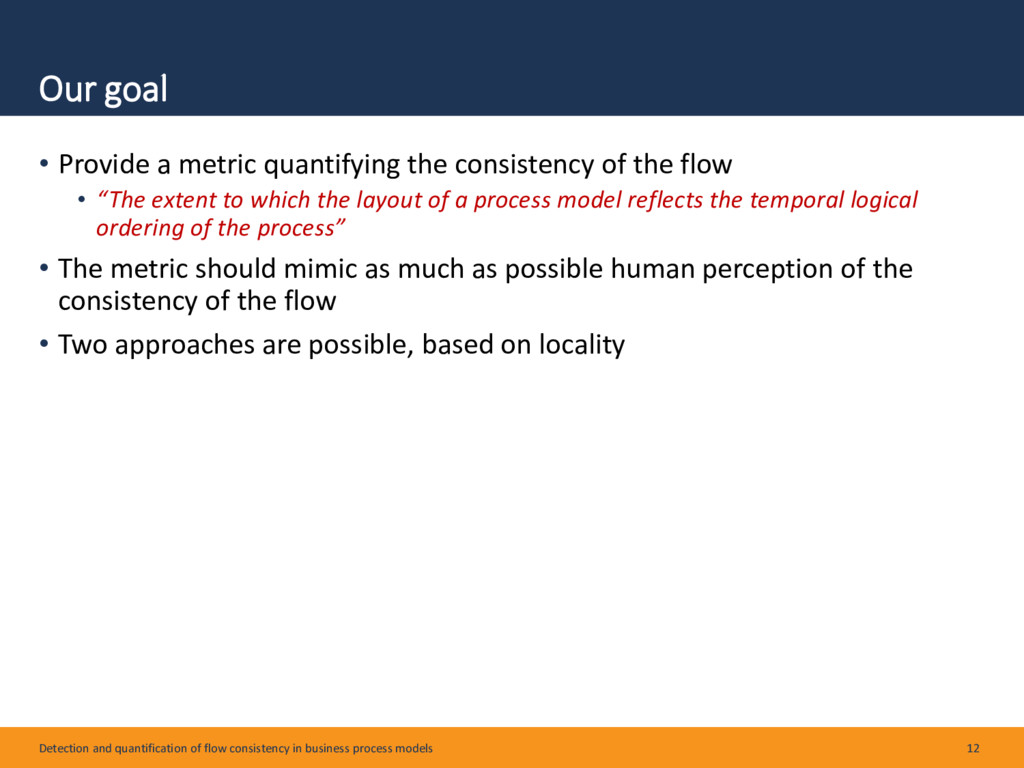
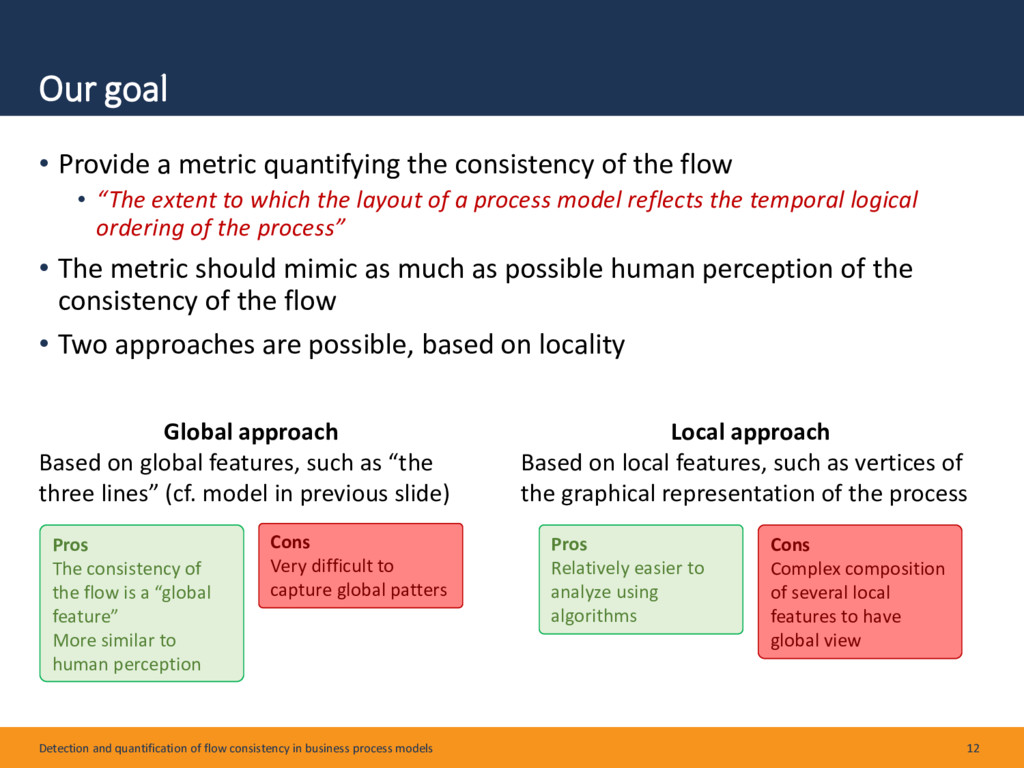
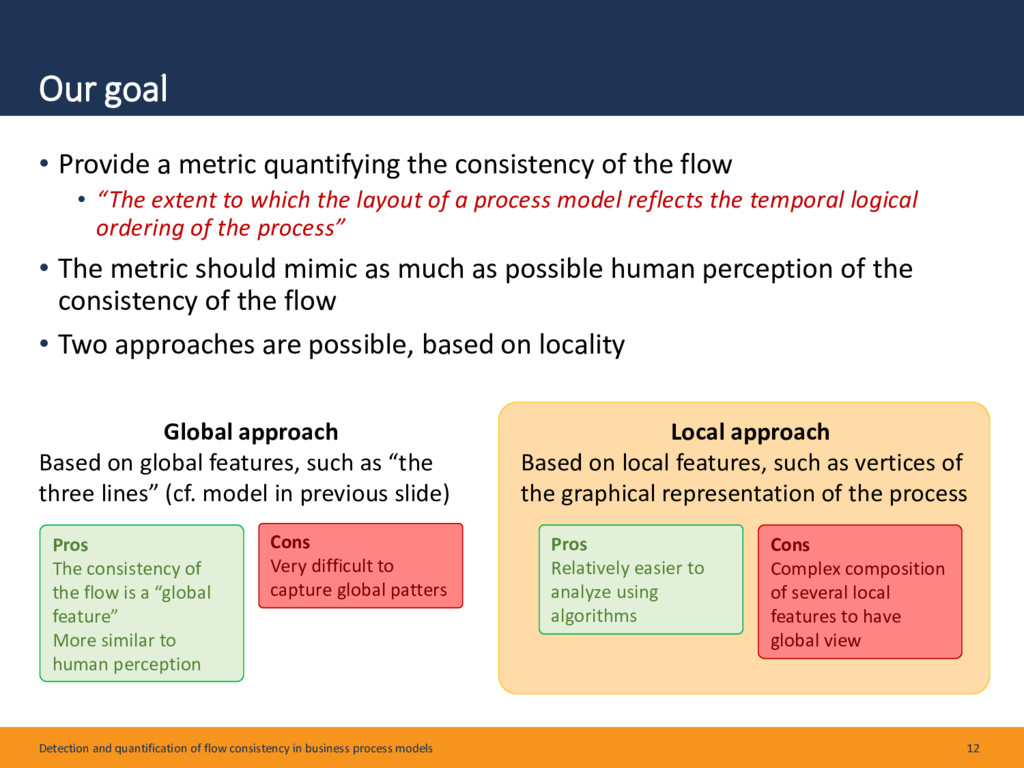
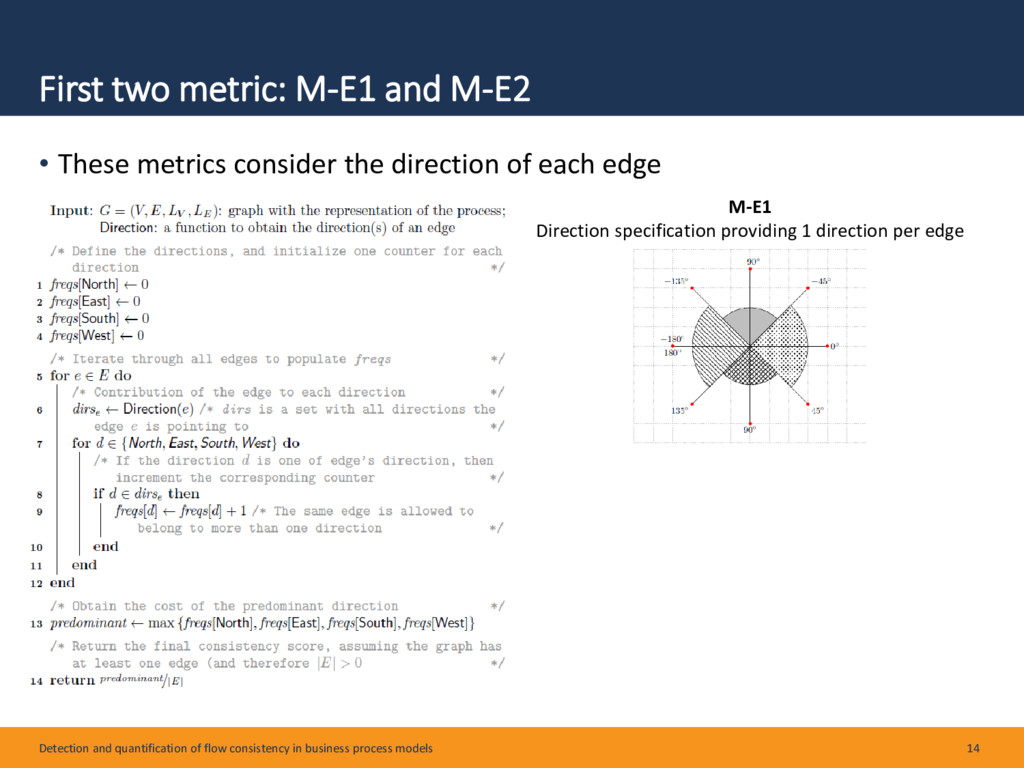
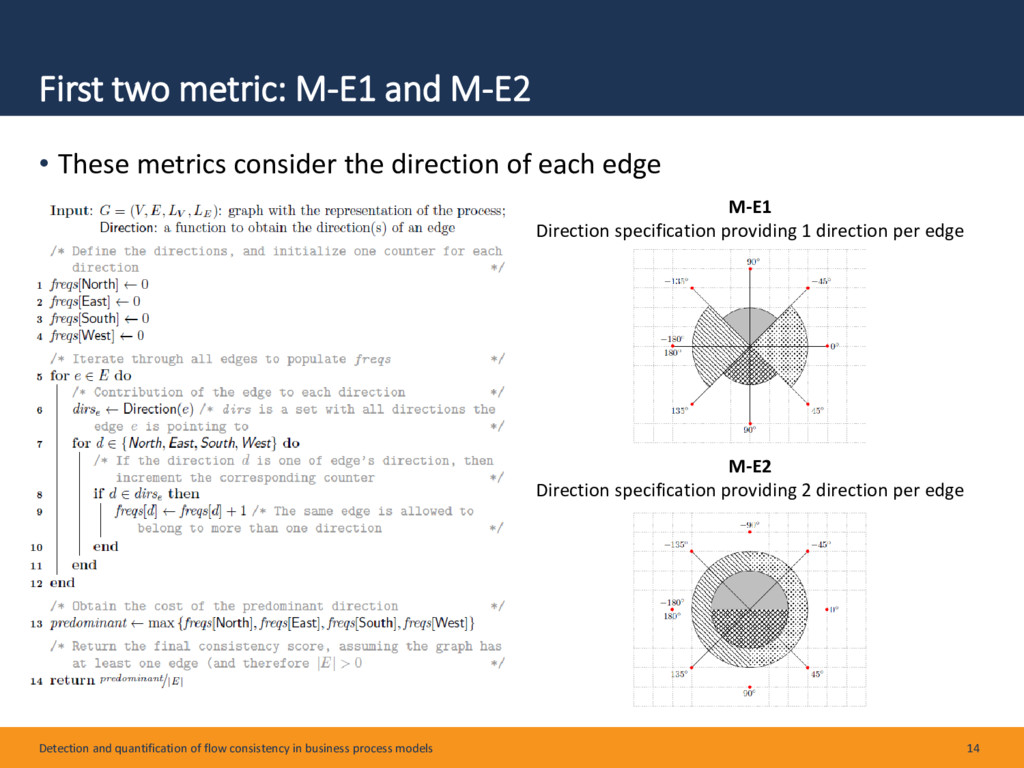
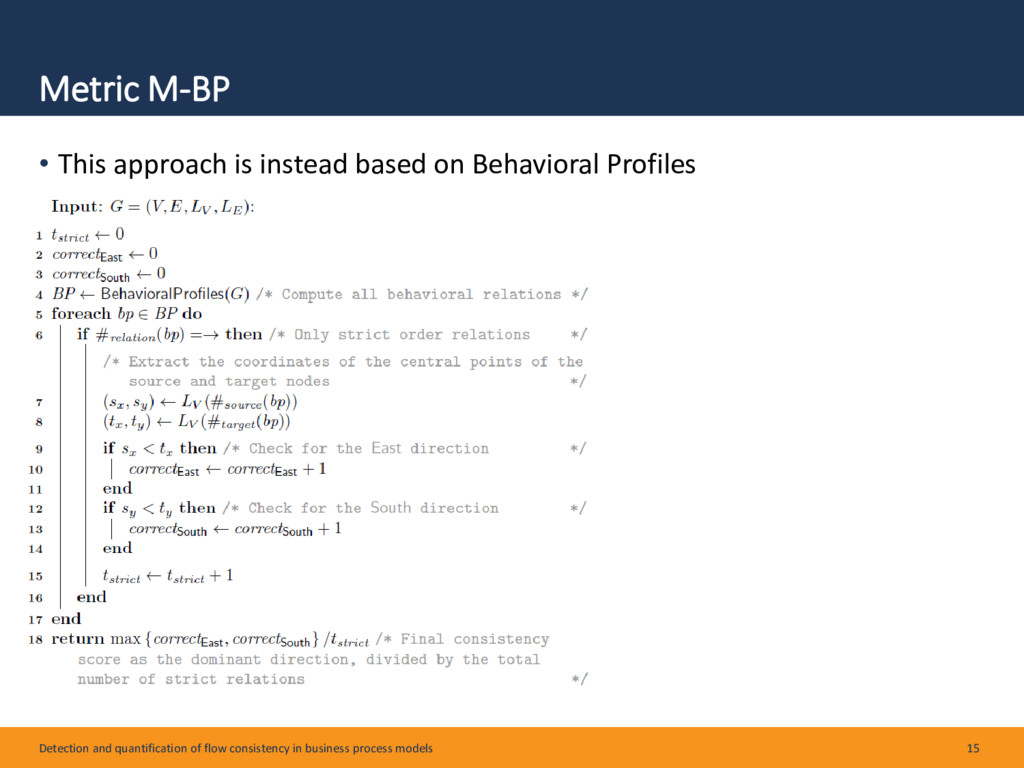
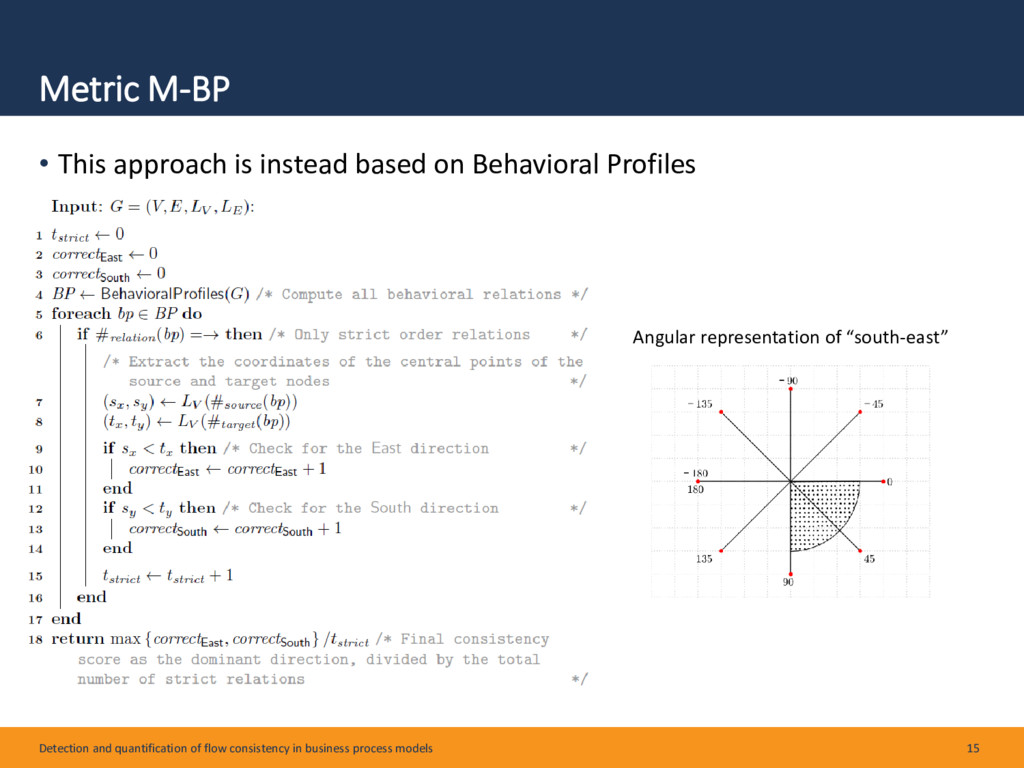
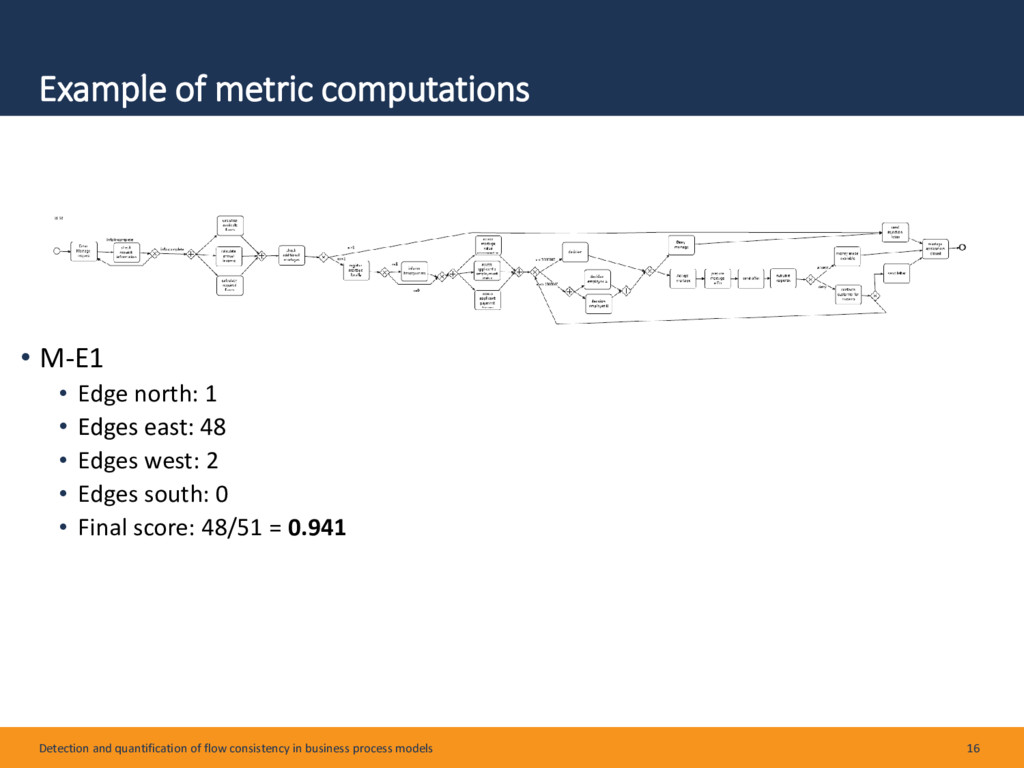
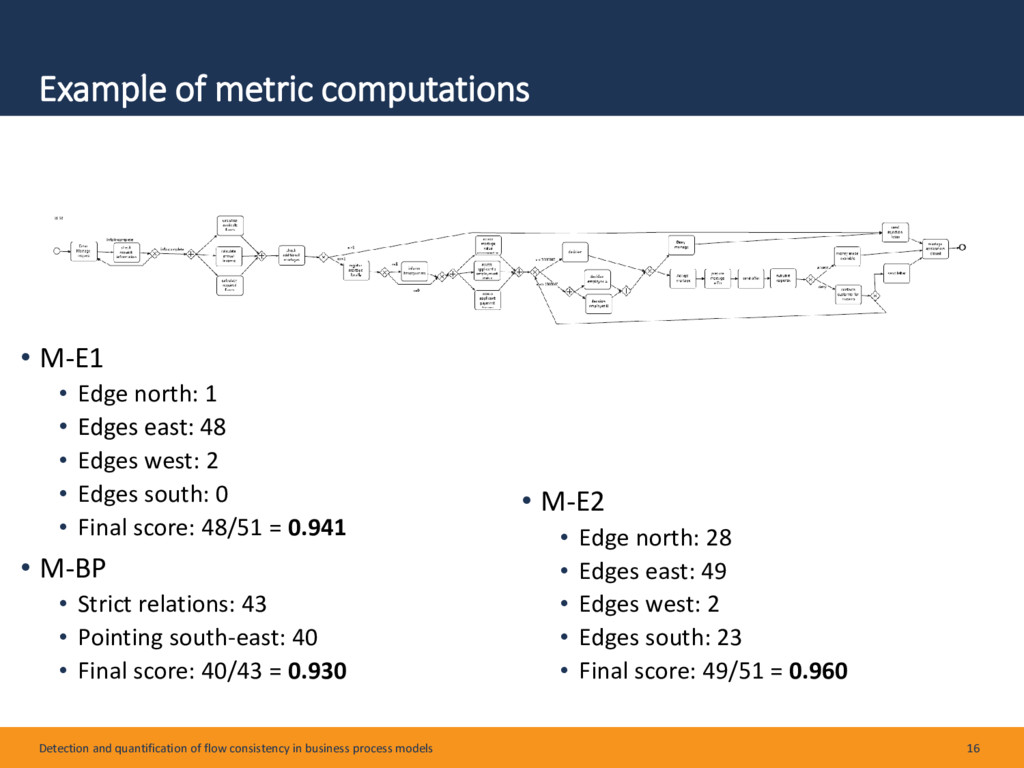
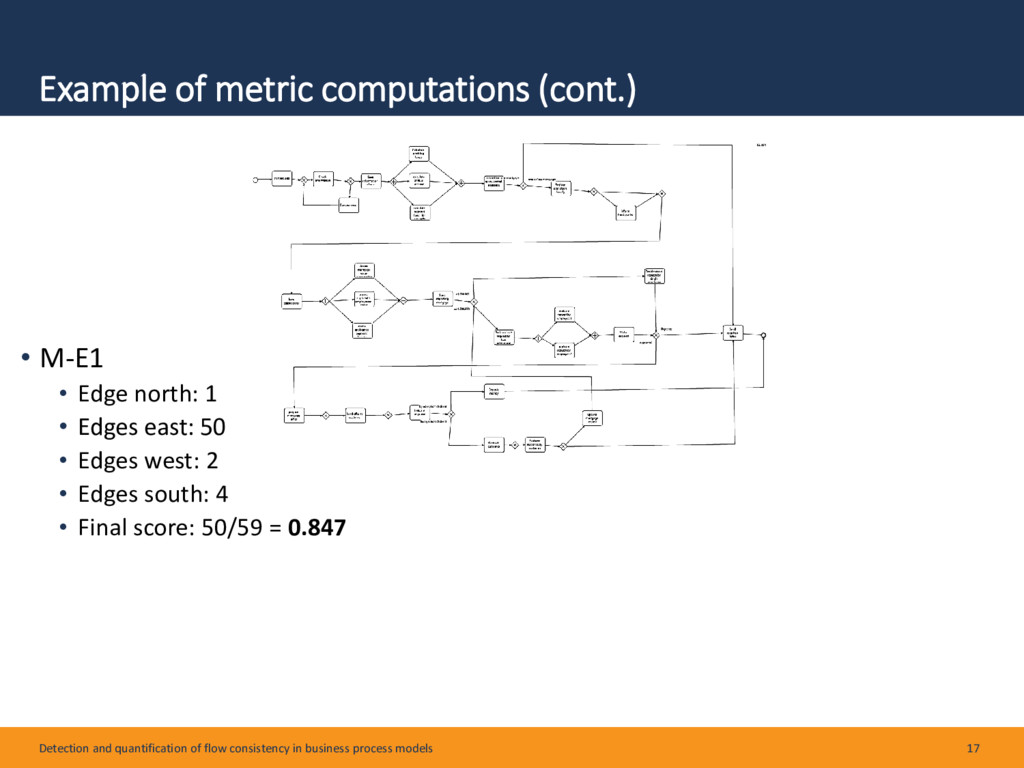
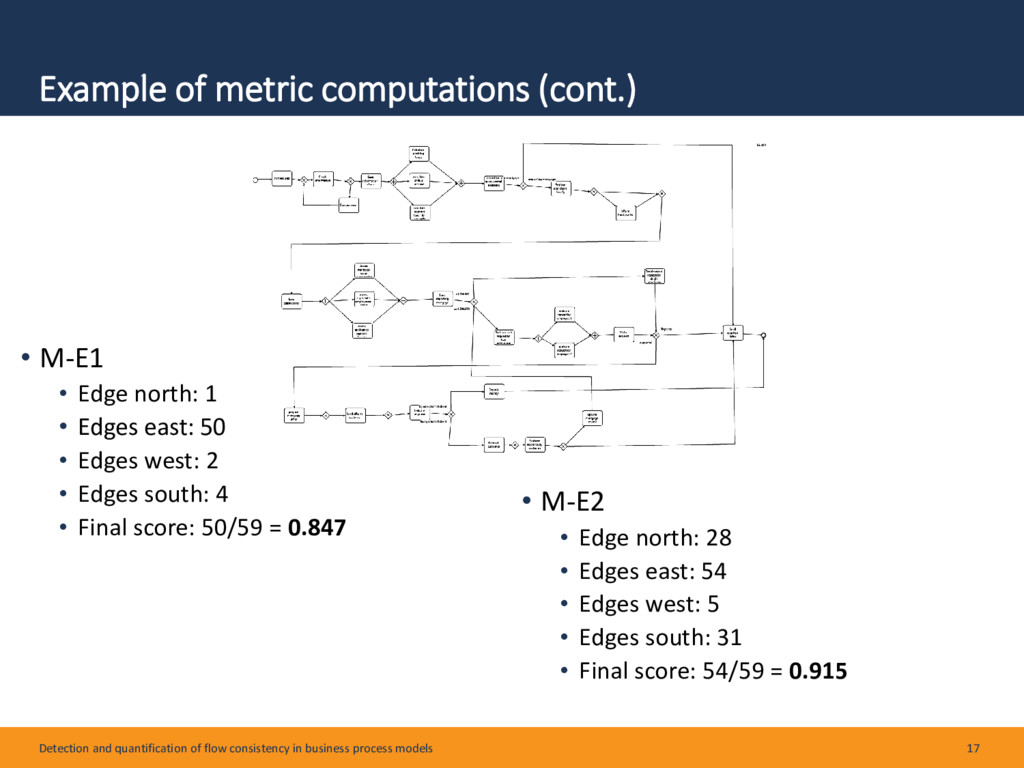
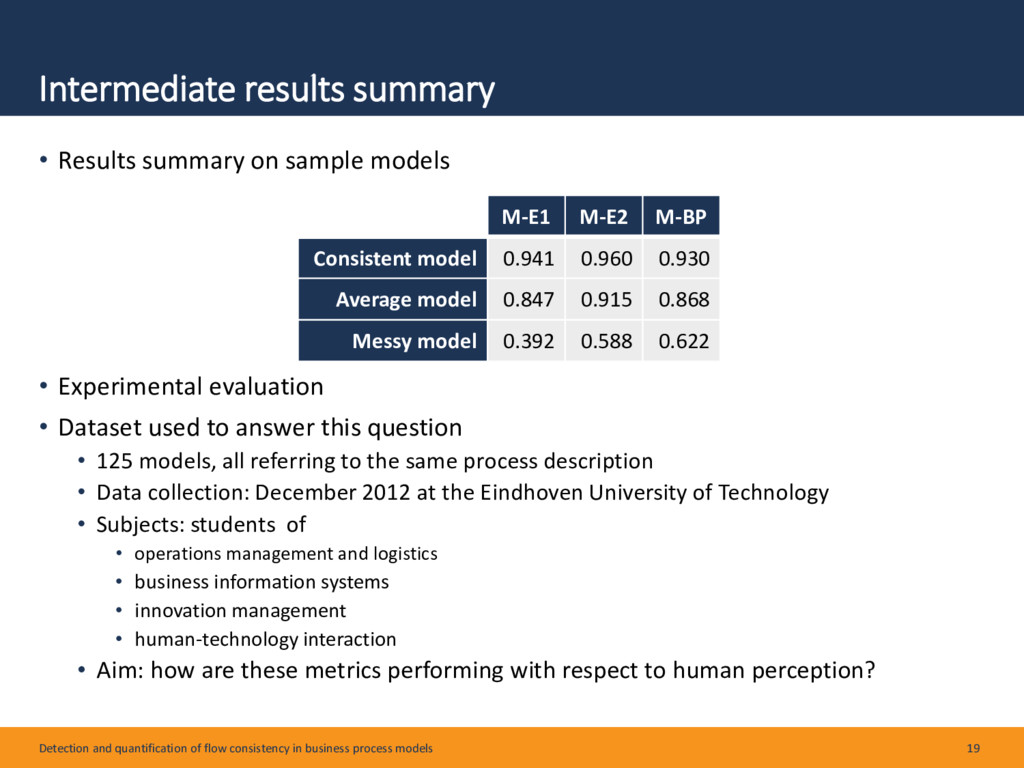
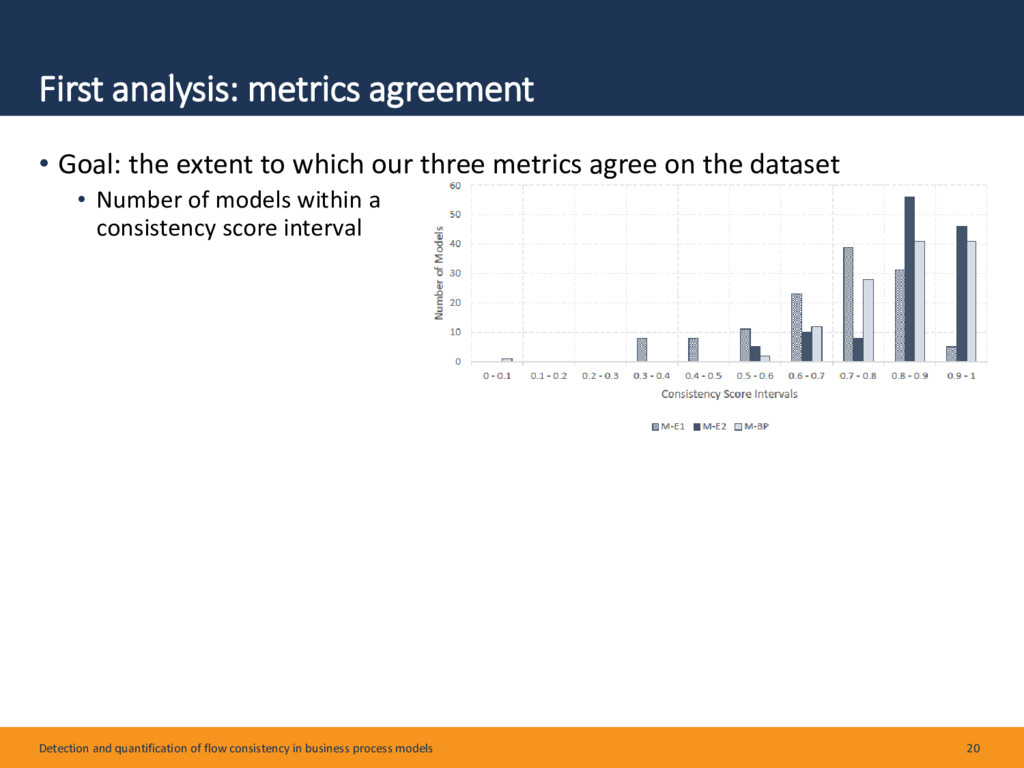
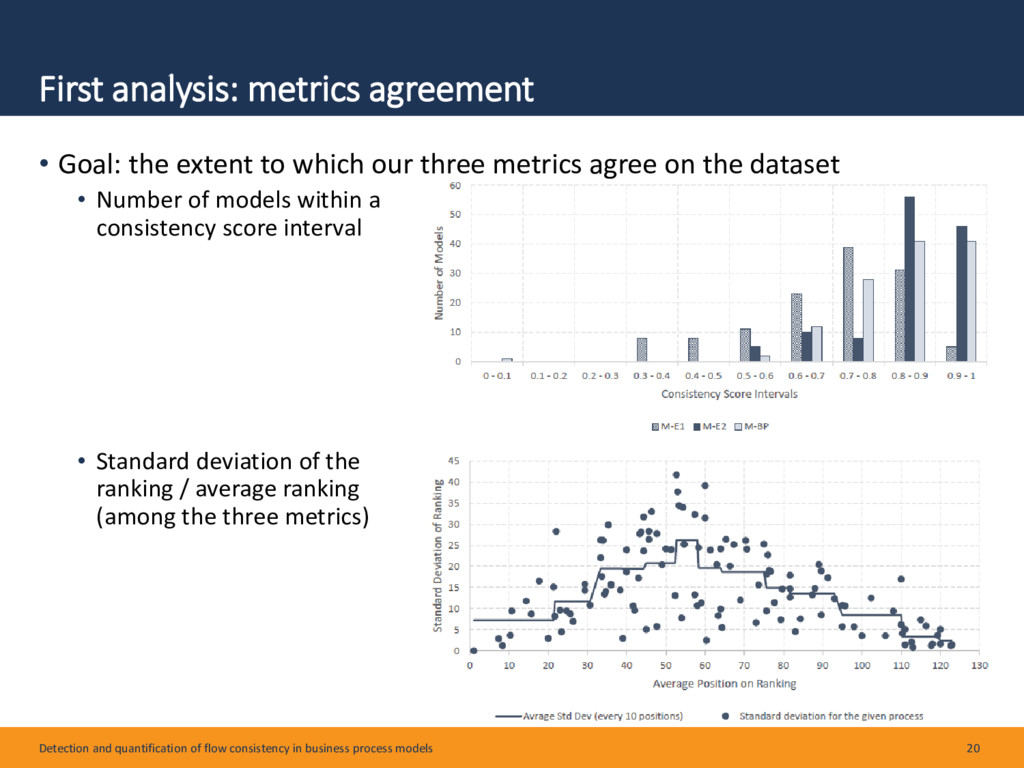
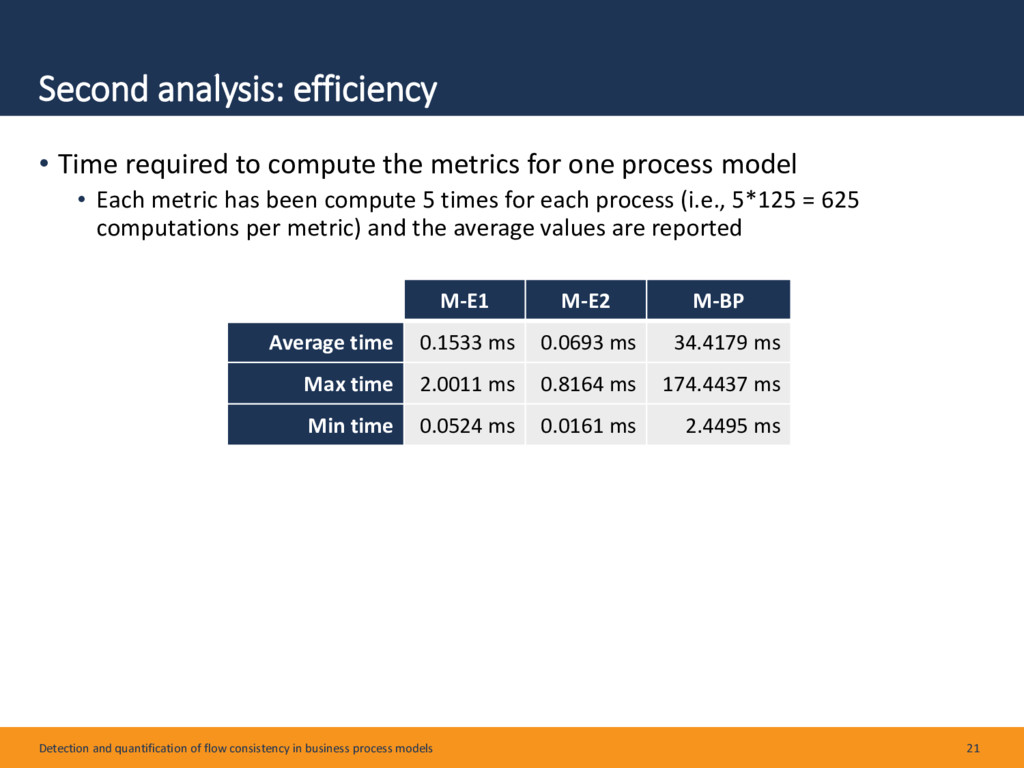
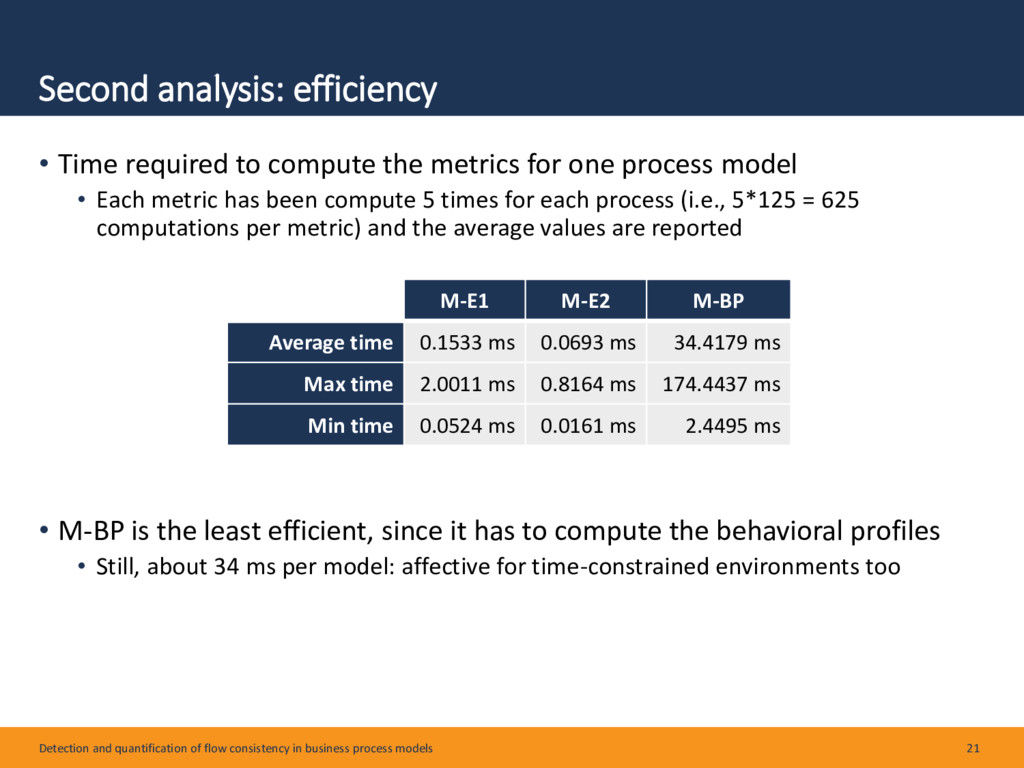
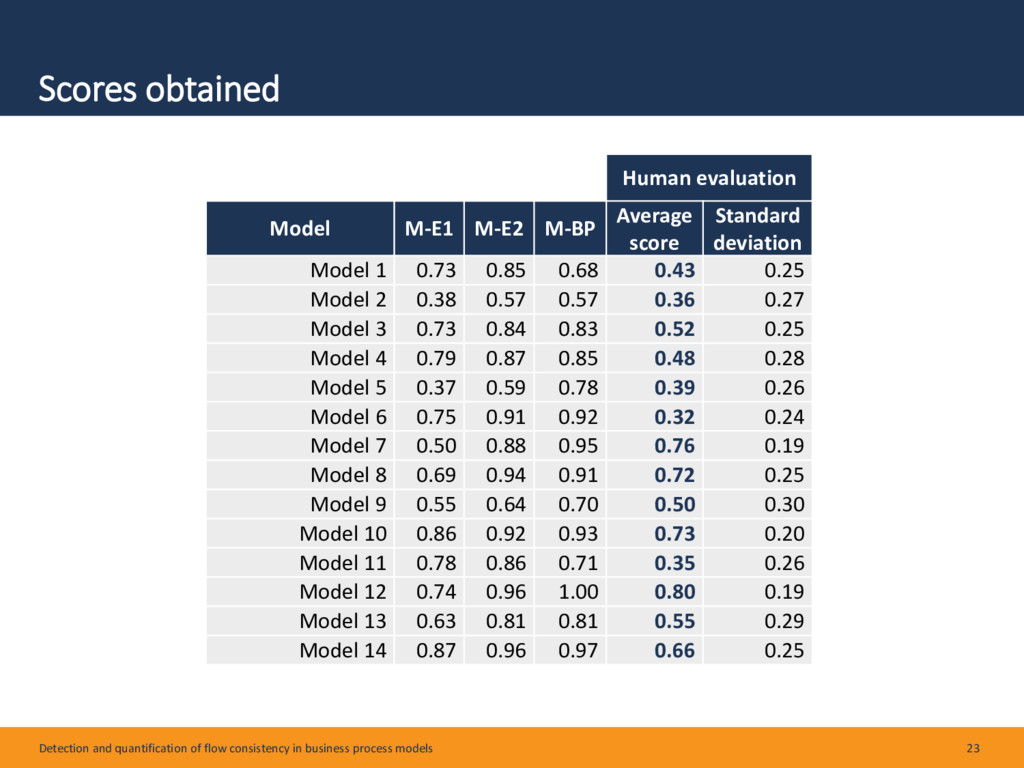
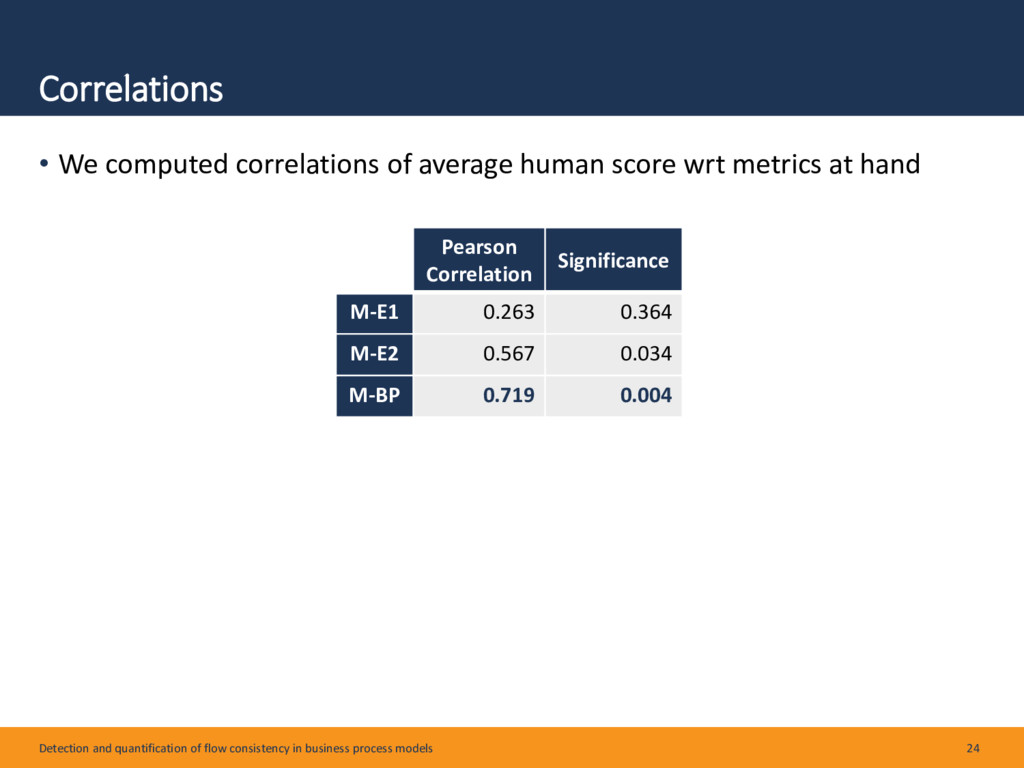
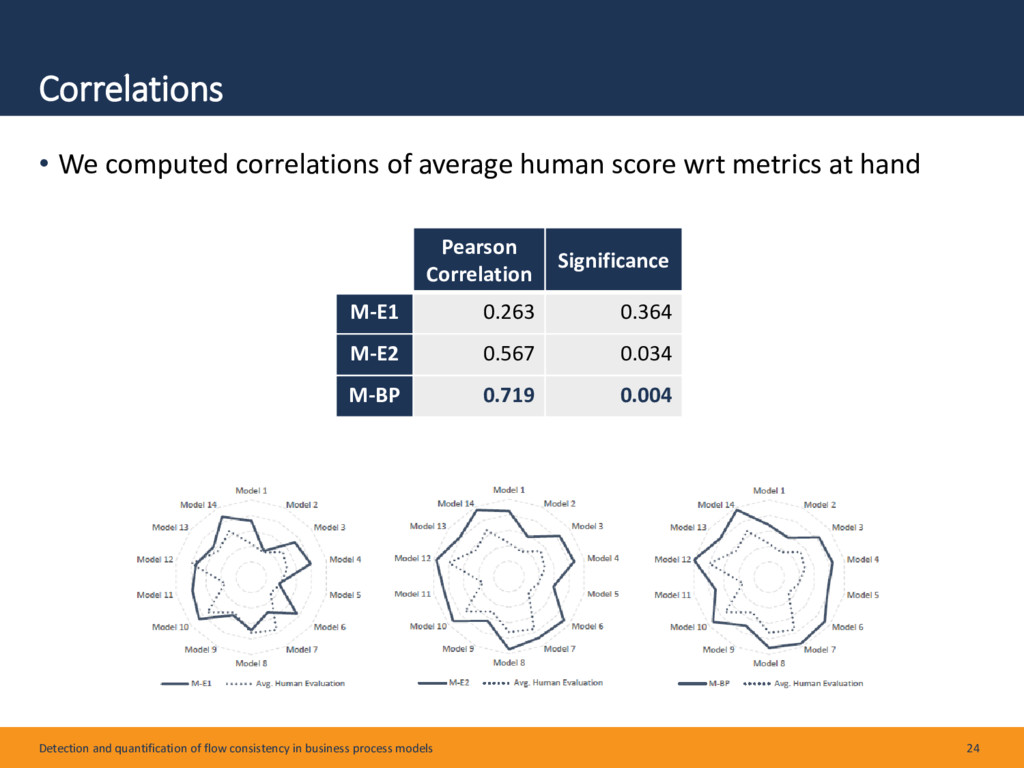
Business process models abstract complex business processes by representing them as graphical models. Their layout, as determined by the modeler, may have an effect when these models are used. However, this effect is currently not fully understood. In order to systematically study this effect, a basic set of measurable key visual features is proposed, depicting the layout properties that are meaningful to the human user. The aim of this research is thus twofold: first, to empirically identify key visual features of business process models which are perceived as meaningful to the user and second, to show how such features can be quantified into computational metrics, which are applicable to business process models. We focus on one particular feature, consistency of flow direction, and show the challenges that arise when transforming it into a precise metric. We propose three different metrics addressing these challenges, each following a different view of flow consistency. We then report the results of an empirical evaluation, which indicates which metric is more effective in predicting the human perception of this feature. Moreover, two other automatic evaluations describing the performance and the computational capabilities of our metrics are reported as well.

More info: https://andrea.burattin.net/publications/2017-sosym

Andrea Burattin

June 13, 2017
Tweet

More Decks by Andrea Burattin

Other Decks in Science

Transcript

  1. Detection and quantification of flow consistency in business process models

    A. Burattin1, V. Bernstein2, M. Neurauter1, P. Soffer2, B. Weber1,3 1 University of Innsbruck, Austria 2 University of Haifa, Haifa, Israel 3 Technical University of Denmark, Denmark This research is supported by Austrian Science Fund: P26609 and P26140. Burattin, A., Bernstein, V., Neurauter, M. et al. Detection and quantification of flow consistency in business process models Softw Syst Model (2017). doi:10.1007/s10270-017-0576-y
  2. Table of contents • Importance of layout feature features •

    Which features are perceived as most relevant • Flow consistency quantification • Different ways of computing the flow consistency • Experimental evaluation • Performance evaluation • Conclusion and future work Detection and quantification of flow consistency in business process models 2
  3. Process Models and their Representation • Business process models are

    useful to • Obtain a common understanding of a company business by • Facilitating documentation • Facilitating communication • Enable the discovery of improvement opportunities Detection and quantification of flow consistency in business process models 3
  4. Process Models and their Representation • Business process models are

    useful to • Obtain a common understanding of a company business by • Facilitating documentation • Facilitating communication • Enable the discovery of improvement opportunities • To serve their purposes, models need to be understood properly Detection and quantification of flow consistency in business process models 3
  5. The Secondary Notation • These two processes have exactly the

    same semantic: Detection and quantification of flow consistency in business process models 4 Pictures from “The Impact of Secondary Notation on Process Model Understanding”. Matthias Schrepfer, Johannes Wolf, Jan Mendling, Hajo A. Reijers S ubmit quote Negotiate contract Approve regional manager Approve sales C onclude user deal Archive contract R e-negotiate OK < 5m$ 5m$ Decline S ubmit quote Negotiate contract Approve regional manager Approve sales C onclude user deal Archive contract R e-negotiate OK < 5m$ 5m$ Decline
  6. 1st study: which layout features are perceived as meaningful •

    Two steps study: exploration + validation • Aim: identify candidate visual features of process models • Structure of the questionnaire • 5 pairs of BPMN models • For each pair • 7-point Likert scale used to assess models similarity • 2 open-ended questions about similarities and differences • After the questionnaire, discussions with subject (recorded and transcribed) to gather additional information about the answers Detection and quantification of flow consistency in business process models 5
  7. 1st study: which layout features are perceived as meaningful •

    Subjects • Exploration: 15 undergraduate students • All subjects with similar knowledge (coming from same educational background) • Validation: 7 modeling experts from different countries • Analysis and findings • Only open-ended questions were used to elicit categories/features • We manually mapped all statements into clusters • Only clusters with at least 2 items were considered • Saturation reached by the fourth interview (no new categories after that) Detection and quantification of flow consistency in business process models 6
  8. Edges-related features elicited • Length of edges The length of

    the edges in the model. A model may vary consisting very short edges (creating a dense model) to very long edges (creating a widely spread model), or a mixture of lengths Detection and quantification of flow consistency in business process models 7
  9. Edges-related features elicited • Length of edges The length of

    the edges in the model. A model may vary consisting very short edges (creating a dense model) to very long edges (creating a widely spread model), or a mixture of lengths Detection and quantification of flow consistency in business process models 7 “The model on the right doesn’t seem right since there are many long edges throughout the model”
  10. Edges-related features elicited • Length of edges The length of

    the edges in the model. A model may vary consisting very short edges (creating a dense model) to very long edges (creating a widely spread model), or a mixture of lengths Detection and quantification of flow consistency in business process models 7 • Edges style: straight, curved, or with bending points Edges can be straight or curved, or they may consist of one or more bending points, which divide the edge into two segments or more “The model on the right doesn’t seem right since there are many long edges throughout the model”
  11. Edges-related features elicited • Length of edges The length of

    the edges in the model. A model may vary consisting very short edges (creating a dense model) to very long edges (creating a widely spread model), or a mixture of lengths Detection and quantification of flow consistency in business process models 7 • Edges style: straight, curved, or with bending points Edges can be straight or curved, or they may consist of one or more bending points, which divide the edge into two segments or more “The model on the right doesn’t seem right since there are many long edges throughout the model” “Need to straighten all the broken edges”
  12. Edges-related features elicited • Length of edges The length of

    the edges in the model. A model may vary consisting very short edges (creating a dense model) to very long edges (creating a widely spread model), or a mixture of lengths • Crossing edges Edges that cross each other intersect with other edges. Intersecting edges might create confusion when following the flow of the model Detection and quantification of flow consistency in business process models 7 • Edges style: straight, curved, or with bending points Edges can be straight or curved, or they may consist of one or more bending points, which divide the edge into two segments or more “The model on the right doesn’t seem right since there are many long edges throughout the model” “Need to straighten all the broken edges”
  13. Edges-related features elicited • Length of edges The length of

    the edges in the model. A model may vary consisting very short edges (creating a dense model) to very long edges (creating a widely spread model), or a mixture of lengths • Crossing edges Edges that cross each other intersect with other edges. Intersecting edges might create confusion when following the flow of the model Detection and quantification of flow consistency in business process models 7 • Edges style: straight, curved, or with bending points Edges can be straight or curved, or they may consist of one or more bending points, which divide the edge into two segments or more “The model on the right doesn’t seem right since there are many long edges throughout the model” “Need to straighten all the broken edges” “There are edges here that just go one on top of the other” “This looks like a spider web”
  14. Edges-related features elicited • Length of edges The length of

    the edges in the model. A model may vary consisting very short edges (creating a dense model) to very long edges (creating a widely spread model), or a mixture of lengths • Crossing edges Edges that cross each other intersect with other edges. Intersecting edges might create confusion when following the flow of the model Detection and quantification of flow consistency in business process models 7 • Edges style: straight, curved, or with bending points Edges can be straight or curved, or they may consist of one or more bending points, which divide the edge into two segments or more • Text on edges Existence and amount of text annotations on edges. The text can either be descriptive or conditional “The model on the right doesn’t seem right since there are many long edges throughout the model” “Need to straighten all the broken edges” “There are edges here that just go one on top of the other” “This looks like a spider web”
  15. Edges-related features elicited • Length of edges The length of

    the edges in the model. A model may vary consisting very short edges (creating a dense model) to very long edges (creating a widely spread model), or a mixture of lengths • Crossing edges Edges that cross each other intersect with other edges. Intersecting edges might create confusion when following the flow of the model Detection and quantification of flow consistency in business process models 7 • Edges style: straight, curved, or with bending points Edges can be straight or curved, or they may consist of one or more bending points, which divide the edge into two segments or more • Text on edges Existence and amount of text annotations on edges. The text can either be descriptive or conditional “The model on the right doesn’t seem right since there are many long edges throughout the model” “Need to straighten all the broken edges” “There are edges here that just go one on top of the other” “This looks like a spider web” “When something is written on the edge, it is difficult to understand which edge it refers to”
  16. Edges-related features elicited • Length of edges The length of

    the edges in the model. A model may vary consisting very short edges (creating a dense model) to very long edges (creating a widely spread model), or a mixture of lengths • Crossing edges Edges that cross each other intersect with other edges. Intersecting edges might create confusion when following the flow of the model • Number of ending points The total number of ending points in the model. An ending point is an end event or an element with no outgoing edges Detection and quantification of flow consistency in business process models 7 • Edges style: straight, curved, or with bending points Edges can be straight or curved, or they may consist of one or more bending points, which divide the edge into two segments or more • Text on edges Existence and amount of text annotations on edges. The text can either be descriptive or conditional “The model on the right doesn’t seem right since there are many long edges throughout the model” “Need to straighten all the broken edges” “There are edges here that just go one on top of the other” “This looks like a spider web” “When something is written on the edge, it is difficult to understand which edge it refers to”
  17. Edges-related features elicited • Length of edges The length of

    the edges in the model. A model may vary consisting very short edges (creating a dense model) to very long edges (creating a widely spread model), or a mixture of lengths • Crossing edges Edges that cross each other intersect with other edges. Intersecting edges might create confusion when following the flow of the model • Number of ending points The total number of ending points in the model. An ending point is an end event or an element with no outgoing edges Detection and quantification of flow consistency in business process models 7 • Edges style: straight, curved, or with bending points Edges can be straight or curved, or they may consist of one or more bending points, which divide the edge into two segments or more • Text on edges Existence and amount of text annotations on edges. The text can either be descriptive or conditional “The model on the right doesn’t seem right since there are many long edges throughout the model” “Need to straighten all the broken edges” “There are edges here that just go one on top of the other” “This looks like a spider web” “When something is written on the edge, it is difficult to understand which edge it refers to” “One ending point connected to many edges, appears like a loop” “There are many ending points”
  18. Edges-related features elicited • Length of edges The length of

    the edges in the model. A model may vary consisting very short edges (creating a dense model) to very long edges (creating a widely spread model), or a mixture of lengths • Crossing edges Edges that cross each other intersect with other edges. Intersecting edges might create confusion when following the flow of the model • Number of ending points The total number of ending points in the model. An ending point is an end event or an element with no outgoing edges Detection and quantification of flow consistency in business process models 7 • Edges style: straight, curved, or with bending points Edges can be straight or curved, or they may consist of one or more bending points, which divide the edge into two segments or more • Text on edges Existence and amount of text annotations on edges. The text can either be descriptive or conditional • Angles The angles used in bending points of edges: 90° angles, angles larger than 45°, angles smaller than 45° “The model on the right doesn’t seem right since there are many long edges throughout the model” “Need to straighten all the broken edges” “There are edges here that just go one on top of the other” “This looks like a spider web” “When something is written on the edge, it is difficult to understand which edge it refers to” “One ending point connected to many edges, appears like a loop” “There are many ending points”
  19. Edges-related features elicited • Length of edges The length of

    the edges in the model. A model may vary consisting very short edges (creating a dense model) to very long edges (creating a widely spread model), or a mixture of lengths • Crossing edges Edges that cross each other intersect with other edges. Intersecting edges might create confusion when following the flow of the model • Number of ending points The total number of ending points in the model. An ending point is an end event or an element with no outgoing edges Detection and quantification of flow consistency in business process models 7 • Edges style: straight, curved, or with bending points Edges can be straight or curved, or they may consist of one or more bending points, which divide the edge into two segments or more • Text on edges Existence and amount of text annotations on edges. The text can either be descriptive or conditional • Angles The angles used in bending points of edges: 90° angles, angles larger than 45°, angles smaller than 45° “The model on the right doesn’t seem right since there are many long edges throughout the model” “Need to straighten all the broken edges” “There are edges here that just go one on top of the other” “This looks like a spider web” “When something is written on the edge, it is difficult to understand which edge it refers to” “Change the edges to be straight lines” “I would improve the angles in this model to be 90° angles” “One ending point connected to many edges, appears like a loop” “There are many ending points”
  20. Model’s structure • Model’s shape The general shape of the

    model refers to the way the model is spread on the canvas. This usually is characterized as a square or rectangle Detection and quantification of flow consistency in business process models 8
  21. Model’s structure • Model’s shape The general shape of the

    model refers to the way the model is spread on the canvas. This usually is characterized as a square or rectangle Detection and quantification of flow consistency in business process models 8 “The structure in both models is horizontal”
  22. Model’s structure • Model’s shape The general shape of the

    model refers to the way the model is spread on the canvas. This usually is characterized as a square or rectangle • Model’s area The area taken by the model on the canvas Detection and quantification of flow consistency in business process models 8 “The structure in both models is horizontal”
  23. Model’s structure • Model’s shape The general shape of the

    model refers to the way the model is spread on the canvas. This usually is characterized as a square or rectangle • Model’s area The area taken by the model on the canvas Detection and quantification of flow consistency in business process models 8 “The structure in both models is horizontal” “The size of the models is different”
  24. Model’s direction • General direction The general direction/flow of the

    model. The direction of the model can be characterized as vertical or horizontal Detection and quantification of flow consistency in business process models 9
  25. Model’s direction • General direction The general direction/flow of the

    model. The direction of the model can be characterized as vertical or horizontal Detection and quantification of flow consistency in business process models 9 “Both models are vertical” “This model goes in a clear direction”
  26. Model’s direction • General direction The general direction/flow of the

    model. The direction of the model can be characterized as vertical or horizontal Detection and quantification of flow consistency in business process models 9 • Placement of ending event The location of ending points in the model in relation to the starting point of the model “Both models are vertical” “This model goes in a clear direction”
  27. Model’s direction • General direction The general direction/flow of the

    model. The direction of the model can be characterized as vertical or horizontal Detection and quantification of flow consistency in business process models 9 • Placement of ending event The location of ending points in the model in relation to the starting point of the model “Both models are vertical” “Location of the ending point makes it clear where the process ends” “This model goes in a clear direction”
  28. Model’s direction • General direction The general direction/flow of the

    model. The direction of the model can be characterized as vertical or horizontal • Branching off Branching off of the model from one main path to more than one, where each branch flows in a different direction Detection and quantification of flow consistency in business process models 9 • Placement of ending event The location of ending points in the model in relation to the starting point of the model “Both models are vertical” “Location of the ending point makes it clear where the process ends” “This model goes in a clear direction”
  29. Model’s direction • General direction The general direction/flow of the

    model. The direction of the model can be characterized as vertical or horizontal • Branching off Branching off of the model from one main path to more than one, where each branch flows in a different direction Detection and quantification of flow consistency in business process models 9 • Placement of ending event The location of ending points in the model in relation to the starting point of the model “Both models are vertical” “Location of the ending point makes it clear where the process ends” “I don’t like to wonder where an edge leads to” “This model goes in a clear direction”
  30. Model’s direction • General direction The general direction/flow of the

    model. The direction of the model can be characterized as vertical or horizontal • Branching off Branching off of the model from one main path to more than one, where each branch flows in a different direction Detection and quantification of flow consistency in business process models 9 • Placement of ending event The location of ending points in the model in relation to the starting point of the model • Consistency of flow The flow of the model can be in one definite direction from the beginning till the end of the model. Alternatively, it can be unclear or changing throughout the model to different directions “Both models are vertical” “Location of the ending point makes it clear where the process ends” “I don’t like to wonder where an edge leads to” “This model goes in a clear direction”
  31. Model’s direction • General direction The general direction/flow of the

    model. The direction of the model can be characterized as vertical or horizontal • Branching off Branching off of the model from one main path to more than one, where each branch flows in a different direction Detection and quantification of flow consistency in business process models 9 • Placement of ending event The location of ending points in the model in relation to the starting point of the model • Consistency of flow The flow of the model can be in one definite direction from the beginning till the end of the model. Alternatively, it can be unclear or changing throughout the model to different directions “Both models are vertical” “Location of the ending point makes it clear where the process ends” “I don’t like to wonder where an edge leads to” “There is a change in the direction of the model” “Both models are built stepwise” “This model goes in a clear direction”
  32. Model’s direction • General direction The general direction/flow of the

    model. The direction of the model can be characterized as vertical or horizontal • Branching off Branching off of the model from one main path to more than one, where each branch flows in a different direction • Symmetry in blocks Referring to structured blocks in the model-symmetry of elements arrangement across the block Detection and quantification of flow consistency in business process models 9 • Placement of ending event The location of ending points in the model in relation to the starting point of the model • Consistency of flow The flow of the model can be in one definite direction from the beginning till the end of the model. Alternatively, it can be unclear or changing throughout the model to different directions “Both models are vertical” “Location of the ending point makes it clear where the process ends” “I don’t like to wonder where an edge leads to” “There is a change in the direction of the model” “Both models are built stepwise” “This model goes in a clear direction”
  33. Model’s direction • General direction The general direction/flow of the

    model. The direction of the model can be characterized as vertical or horizontal • Branching off Branching off of the model from one main path to more than one, where each branch flows in a different direction • Symmetry in blocks Referring to structured blocks in the model-symmetry of elements arrangement across the block Detection and quantification of flow consistency in business process models 9 • Placement of ending event The location of ending points in the model in relation to the starting point of the model • Consistency of flow The flow of the model can be in one definite direction from the beginning till the end of the model. Alternatively, it can be unclear or changing throughout the model to different directions “Both models are vertical” “Location of the ending point makes it clear where the process ends” “I don’t like to wonder where an edge leads to” “There is a change in the direction of the model” “Both models are built stepwise” “This block in the model is very symmetrical and therefore very understandable” “This model goes in a clear direction”
  34. Model’s direction • General direction The general direction/flow of the

    model. The direction of the model can be characterized as vertical or horizontal • Branching off Branching off of the model from one main path to more than one, where each branch flows in a different direction • Symmetry in blocks Referring to structured blocks in the model-symmetry of elements arrangement across the block Detection and quantification of flow consistency in business process models 9 • Placement of ending event The location of ending points in the model in relation to the starting point of the model • Consistency of flow The flow of the model can be in one definite direction from the beginning till the end of the model. Alternatively, it can be unclear or changing throughout the model to different directions • Alignment in the model Alignment of the elements in the model in relation to each other “Both models are vertical” “Location of the ending point makes it clear where the process ends” “I don’t like to wonder where an edge leads to” “There is a change in the direction of the model” “Both models are built stepwise” “This block in the model is very symmetrical and therefore very understandable” “This model goes in a clear direction”
  35. Model’s direction • General direction The general direction/flow of the

    model. The direction of the model can be characterized as vertical or horizontal • Branching off Branching off of the model from one main path to more than one, where each branch flows in a different direction • Symmetry in blocks Referring to structured blocks in the model-symmetry of elements arrangement across the block Detection and quantification of flow consistency in business process models 9 • Placement of ending event The location of ending points in the model in relation to the starting point of the model • Consistency of flow The flow of the model can be in one definite direction from the beginning till the end of the model. Alternatively, it can be unclear or changing throughout the model to different directions • Alignment in the model Alignment of the elements in the model in relation to each other “Both models are vertical” “Location of the ending point makes it clear where the process ends” “I don’t like to wonder where an edge leads to” “There is a change in the direction of the model” “Both models are built stepwise” “This block in the model is very symmetrical and therefore very understandable” “This model is clearer because of the alignment of the whole model. It is very aesthetic” “This model goes in a clear direction”
  36. Validation with experts • All identified categories were supported by

    experts • Two additional categories were elicited • Fixed sizes of activity boxes The possibility of having different sizes of the activity boxes for short and long textual descriptions of the activities • Implicit versus explicit gateways A known property associated with the pragmatic quality of BPMN models Detection and quantification of flow consistency in business process models 10
  37. Validation with experts • All identified categories were supported by

    experts • Two additional categories were elicited • Fixed sizes of activity boxes The possibility of having different sizes of the activity boxes for short and long textual descriptions of the activities • Implicit versus explicit gateways A known property associated with the pragmatic quality of BPMN models • We decided to focus on the flow consistency since • It is particularly challenging since it involves “high-level concepts” and how such concepts are represented • Several ways of computing it, and it is not obvious which approach would most closely reflect human perception Detection and quantification of flow consistency in business process models 10
  38. Our goal • Provide a metric quantifying the consistency of

    the flow • “The extent to which the layout of a process model reflects the temporal logical ordering of the process” • The metric should mimic as much as possible human perception of the consistency of the flow Detection and quantification of flow consistency in business process models 12
  39. Our goal • Provide a metric quantifying the consistency of

    the flow • “The extent to which the layout of a process model reflects the temporal logical ordering of the process” • The metric should mimic as much as possible human perception of the consistency of the flow • Two approaches are possible, based on locality Detection and quantification of flow consistency in business process models 12
  40. Our goal • Provide a metric quantifying the consistency of

    the flow • “The extent to which the layout of a process model reflects the temporal logical ordering of the process” • The metric should mimic as much as possible human perception of the consistency of the flow • Two approaches are possible, based on locality Detection and quantification of flow consistency in business process models 12 Global approach Based on global features, such as “the three lines” (cf. model in previous slide) Pros The consistency of the flow is a “global feature” More similar to human perception Cons Very difficult to capture global patters
  41. Our goal • Provide a metric quantifying the consistency of

    the flow • “The extent to which the layout of a process model reflects the temporal logical ordering of the process” • The metric should mimic as much as possible human perception of the consistency of the flow • Two approaches are possible, based on locality Detection and quantification of flow consistency in business process models 12 Global approach Based on global features, such as “the three lines” (cf. model in previous slide) Local approach Based on local features, such as vertices of the graphical representation of the process Pros The consistency of the flow is a “global feature” More similar to human perception Cons Very difficult to capture global patters Pros Relatively easier to analyze using algorithms Cons Complex composition of several local features to have global view
  42. Our goal • Provide a metric quantifying the consistency of

    the flow • “The extent to which the layout of a process model reflects the temporal logical ordering of the process” • The metric should mimic as much as possible human perception of the consistency of the flow • Two approaches are possible, based on locality Detection and quantification of flow consistency in business process models 12 Global approach Based on global features, such as “the three lines” (cf. model in previous slide) Local approach Based on local features, such as vertices of the graphical representation of the process Pros The consistency of the flow is a “global feature” More similar to human perception Cons Very difficult to capture global patters Pros Relatively easier to analyze using algorithms Cons Complex composition of several local features to have global view
  43. Assumptions made • We consider the graphical representation of BPMN

    models • Only start/end points of edges are considered Detection and quantification of flow consistency in business process models 13
  44. Assumptions made • We consider the graphical representation of BPMN

    models • Only start/end points of edges are considered Detection and quantification of flow consistency in business process models 13
  45. Assumptions made • We consider the graphical representation of BPMN

    models • Only start/end points of edges are considered • From our point of view, these fragments are equivalent Detection and quantification of flow consistency in business process models 13
  46. First two metric: M-E1 and M-E2 • These metrics consider

    the direction of each edge Detection and quantification of flow consistency in business process models 14
  47. First two metric: M-E1 and M-E2 • These metrics consider

    the direction of each edge Detection and quantification of flow consistency in business process models 14
  48. First two metric: M-E1 and M-E2 • These metrics consider

    the direction of each edge Detection and quantification of flow consistency in business process models 14 M-E1 Direction specification providing 1 direction per edge
  49. First two metric: M-E1 and M-E2 • These metrics consider

    the direction of each edge Detection and quantification of flow consistency in business process models 14 M-E1 Direction specification providing 1 direction per edge M-E2 Direction specification providing 2 direction per edge
  50. Metric M-BP • This approach is instead based on Behavioral

    Profiles Detection and quantification of flow consistency in business process models 15
  51. Metric M-BP • This approach is instead based on Behavioral

    Profiles Detection and quantification of flow consistency in business process models 15 Angular representation of “south-east”
  52. Example of metric computations • M-E1 • Edge north: 1

    • Edges east: 48 • Edges west: 2 • Edges south: 0 • Final score: 48/51 = 0.941 Detection and quantification of flow consistency in business process models 16
  53. Example of metric computations • M-E1 • Edge north: 1

    • Edges east: 48 • Edges west: 2 • Edges south: 0 • Final score: 48/51 = 0.941 Detection and quantification of flow consistency in business process models 16 • M-E2 • Edge north: 28 • Edges east: 49 • Edges west: 2 • Edges south: 23 • Final score: 49/51 = 0.960
  54. Example of metric computations • M-E1 • Edge north: 1

    • Edges east: 48 • Edges west: 2 • Edges south: 0 • Final score: 48/51 = 0.941 • M-BP • Strict relations: 43 • Pointing south-east: 40 • Final score: 40/43 = 0.930 Detection and quantification of flow consistency in business process models 16 • M-E2 • Edge north: 28 • Edges east: 49 • Edges west: 2 • Edges south: 23 • Final score: 49/51 = 0.960
  55. Example of metric computations (cont.) • M-E1 • Edge north:

    1 • Edges east: 50 • Edges west: 2 • Edges south: 4 • Final score: 50/59 = 0.847 Detection and quantification of flow consistency in business process models 17
  56. Example of metric computations (cont.) • M-E1 • Edge north:

    1 • Edges east: 50 • Edges west: 2 • Edges south: 4 • Final score: 50/59 = 0.847 Detection and quantification of flow consistency in business process models 17 • M-E2 • Edge north: 28 • Edges east: 54 • Edges west: 5 • Edges south: 31 • Final score: 54/59 = 0.915
  57. Example of metric computations (cont.) • M-E1 • Edge north:

    1 • Edges east: 50 • Edges west: 2 • Edges south: 4 • Final score: 50/59 = 0.847 • M-BP • Strict relations: 38 • Pointing south-east: 33 • Final score: 33/38 = 0.868 Detection and quantification of flow consistency in business process models 17 • M-E2 • Edge north: 28 • Edges east: 54 • Edges west: 5 • Edges south: 31 • Final score: 54/59 = 0.915
  58. Example of metric computations (cont.) • M-E1 • Edge north:

    5 • Edges east: 20 • Edges west: 17 • Edges south: 9 • Final score: 20/51 = 0.392 Detection and quantification of flow consistency in business process models 18
  59. Example of metric computations (cont.) • M-E1 • Edge north:

    5 • Edges east: 20 • Edges west: 17 • Edges south: 9 • Final score: 20/51 = 0.392 Detection and quantification of flow consistency in business process models 18 • M-E2 • Edge north: 21 • Edges east: 27 • Edges west: 24 • Edges south: 30 • Final score: 30/51 = 0.588
  60. Example of metric computations (cont.) • M-E1 • Edge north:

    5 • Edges east: 20 • Edges west: 17 • Edges south: 9 • Final score: 20/51 = 0.392 • M-BP • Strict relations: 37 • Pointing south-east: 23 • Final score: 23/37 = 0.622 Detection and quantification of flow consistency in business process models 18 • M-E2 • Edge north: 21 • Edges east: 27 • Edges west: 24 • Edges south: 30 • Final score: 30/51 = 0.588
  61. Intermediate results summary • Results summary on sample models Detection

    and quantification of flow consistency in business process models 19 M-E1 M-E2 M-BP Consistent model 0.941 0.960 0.930 Average model 0.847 0.915 0.868 Messy model 0.392 0.588 0.622
  62. Intermediate results summary • Results summary on sample models •

    Experimental evaluation Detection and quantification of flow consistency in business process models 19 M-E1 M-E2 M-BP Consistent model 0.941 0.960 0.930 Average model 0.847 0.915 0.868 Messy model 0.392 0.588 0.622
  63. Intermediate results summary • Results summary on sample models •

    Experimental evaluation • Dataset used to answer this question • 125 models, all referring to the same process description • Data collection: December 2012 at the Eindhoven University of Technology • Subjects: students of • operations management and logistics • business information systems • innovation management • human-technology interaction • Aim: how are these metrics performing with respect to human perception? Detection and quantification of flow consistency in business process models 19 M-E1 M-E2 M-BP Consistent model 0.941 0.960 0.930 Average model 0.847 0.915 0.868 Messy model 0.392 0.588 0.622
  64. First analysis: metrics agreement • Goal: the extent to which

    our three metrics agree on the dataset Detection and quantification of flow consistency in business process models 20
  65. First analysis: metrics agreement • Goal: the extent to which

    our three metrics agree on the dataset • Number of models within a consistency score interval Detection and quantification of flow consistency in business process models 20
  66. First analysis: metrics agreement • Goal: the extent to which

    our three metrics agree on the dataset • Number of models within a consistency score interval • Standard deviation of the ranking / average ranking (among the three metrics) Detection and quantification of flow consistency in business process models 20
  67. Second analysis: efficiency • Time required to compute the metrics

    for one process model • Each metric has been compute 5 times for each process (i.e., 5*125 = 625 computations per metric) and the average values are reported Detection and quantification of flow consistency in business process models 21 M-E1 M-E2 M-BP Average time 0.1533 ms 0.0693 ms 34.4179 ms Max time 2.0011 ms 0.8164 ms 174.4437 ms Min time 0.0524 ms 0.0161 ms 2.4495 ms
  68. Second analysis: efficiency • Time required to compute the metrics

    for one process model • Each metric has been compute 5 times for each process (i.e., 5*125 = 625 computations per metric) and the average values are reported • M-BP is the least efficient, since it has to compute the behavioral profiles • Still, about 34 ms per model: affective for time-constrained environments too Detection and quantification of flow consistency in business process models 21 M-E1 M-E2 M-BP Average time 0.1533 ms 0.0693 ms 34.4179 ms Max time 2.0011 ms 0.8164 ms 174.4437 ms Min time 0.0524 ms 0.0161 ms 2.4495 ms
  69. Third analysis: human assessment • We selected 14 models from

    our dataset • Sampled according to the distribution of the ranking and standard deviation • Two questionnaires (A/B) with models presented in opposite order • 7-point Likert scale from “no consistency at all” to “complete consistency” Detection and quantification of flow consistency in business process models 22
  70. Third analysis: human assessment • We selected 14 models from

    our dataset • Sampled according to the distribution of the ranking and standard deviation • Two questionnaires (A/B) with models presented in opposite order • 7-point Likert scale from “no consistency at all” to “complete consistency” Detection and quantification of flow consistency in business process models 22
  71. Third analysis: human assessment • We selected 14 models from

    our dataset • Sampled according to the distribution of the ranking and standard deviation • Two questionnaires (A/B) with models presented in opposite order • 7-point Likert scale from “no consistency at all” to “complete consistency” • We asked participants of BPM 2015 (Innsbruck) to evaluate the flow consistency of the models • Participants are assumed to be familiar/experts with process modeling • We collected 47 evaluations (25 A, 22 B) Detection and quantification of flow consistency in business process models 22
  72. Scores obtained Human evaluation Model M-E1 M-E2 M-BP Average score

    Standard deviation Model 1 0.73 0.85 0.68 0.43 0.25 Model 2 0.38 0.57 0.57 0.36 0.27 Model 3 0.73 0.84 0.83 0.52 0.25 Model 4 0.79 0.87 0.85 0.48 0.28 Model 5 0.37 0.59 0.78 0.39 0.26 Model 6 0.75 0.91 0.92 0.32 0.24 Model 7 0.50 0.88 0.95 0.76 0.19 Model 8 0.69 0.94 0.91 0.72 0.25 Model 9 0.55 0.64 0.70 0.50 0.30 Model 10 0.86 0.92 0.93 0.73 0.20 Model 11 0.78 0.86 0.71 0.35 0.26 Model 12 0.74 0.96 1.00 0.80 0.19 Model 13 0.63 0.81 0.81 0.55 0.29 Model 14 0.87 0.96 0.97 0.66 0.25 Detection and quantification of flow consistency in business process models 23
  73. Correlations • We computed correlations of average human score wrt

    metrics at hand Detection and quantification of flow consistency in business process models 24 Pearson Correlation Significance M-E1 0.263 0.364 M-E2 0.567 0.034 M-BP 0.719 0.004
  74. Correlations • We computed correlations of average human score wrt

    metrics at hand Detection and quantification of flow consistency in business process models 24 Pearson Correlation Significance M-E1 0.263 0.364 M-E2 0.567 0.034 M-BP 0.719 0.004
  75. Conclusions and future work • We showed how we elicited

    layout features by means of an experiment • We identified the consistency of the flow as perceived relevant feature • We proposed 3 metrics for the quantification of the flow consistency • We performed different assessments on our metrics • We identify the metric which is the most similar to the human perception • Possible future work • Reuse similar methodology for other layout features • Deploy suggestions based on our metrics in real-world modeling environments Detection and quantification of flow consistency in business process models 25