Upgrade to Pro — share decks privately, control downloads, hide ads and more …

Visualization of the Evolution of Layout Metrics for Business Process Models

Andrea Burattin
September 19, 2016

Visualization of the Evolution of Layout Metrics for Business Process Models

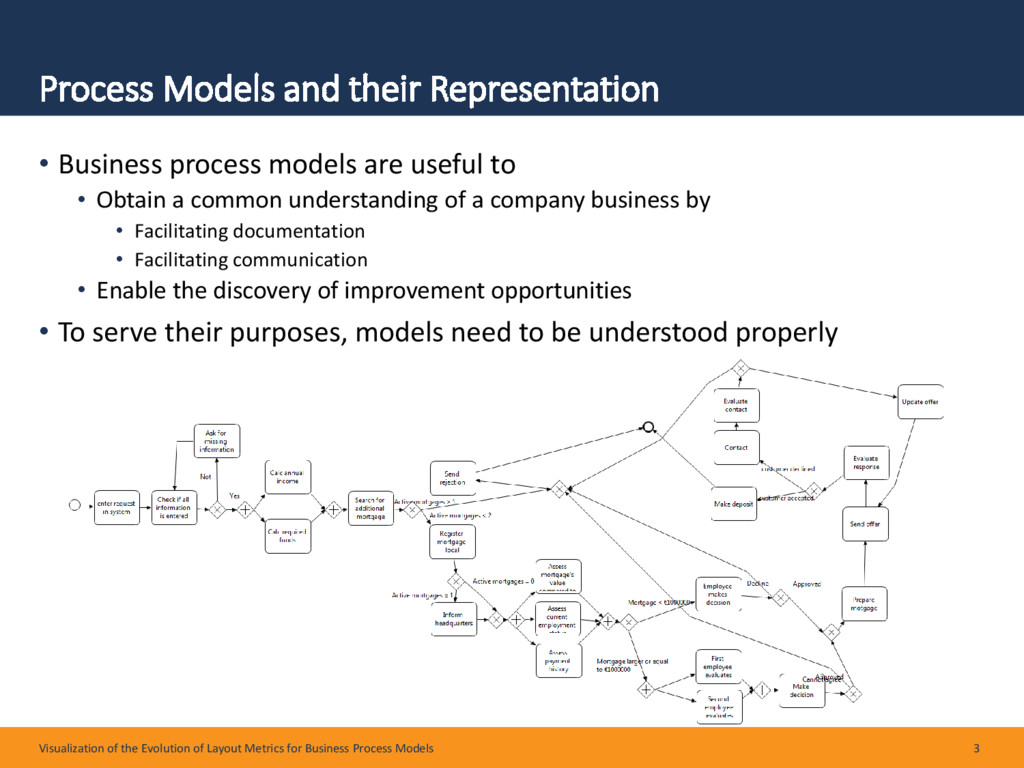
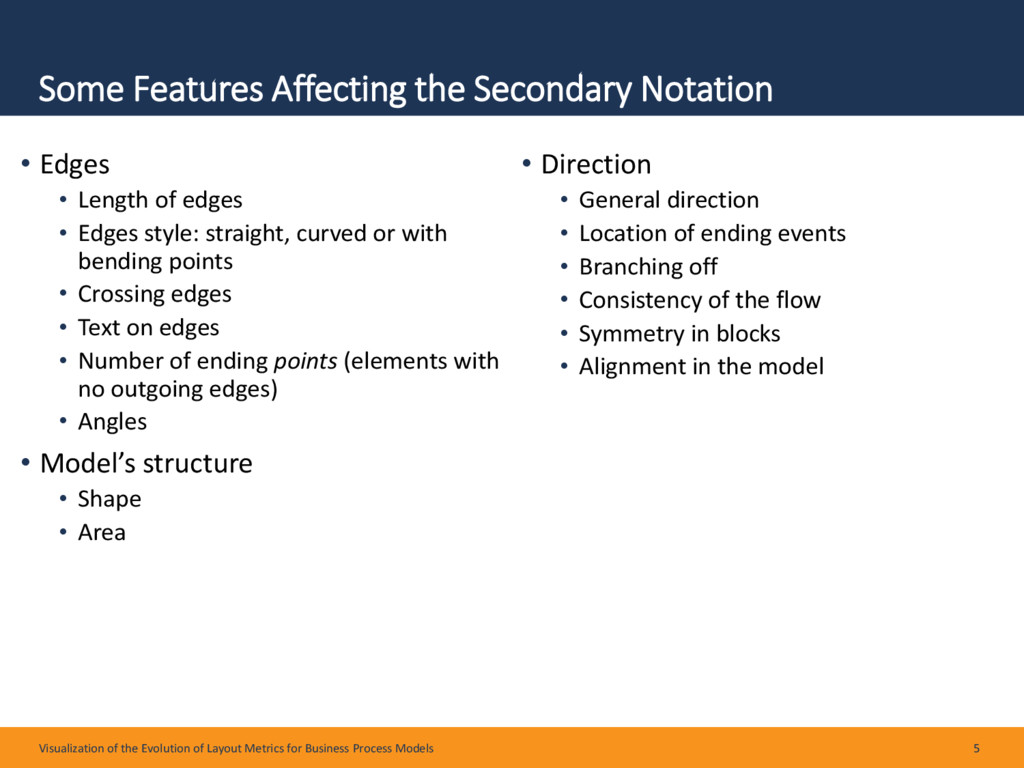
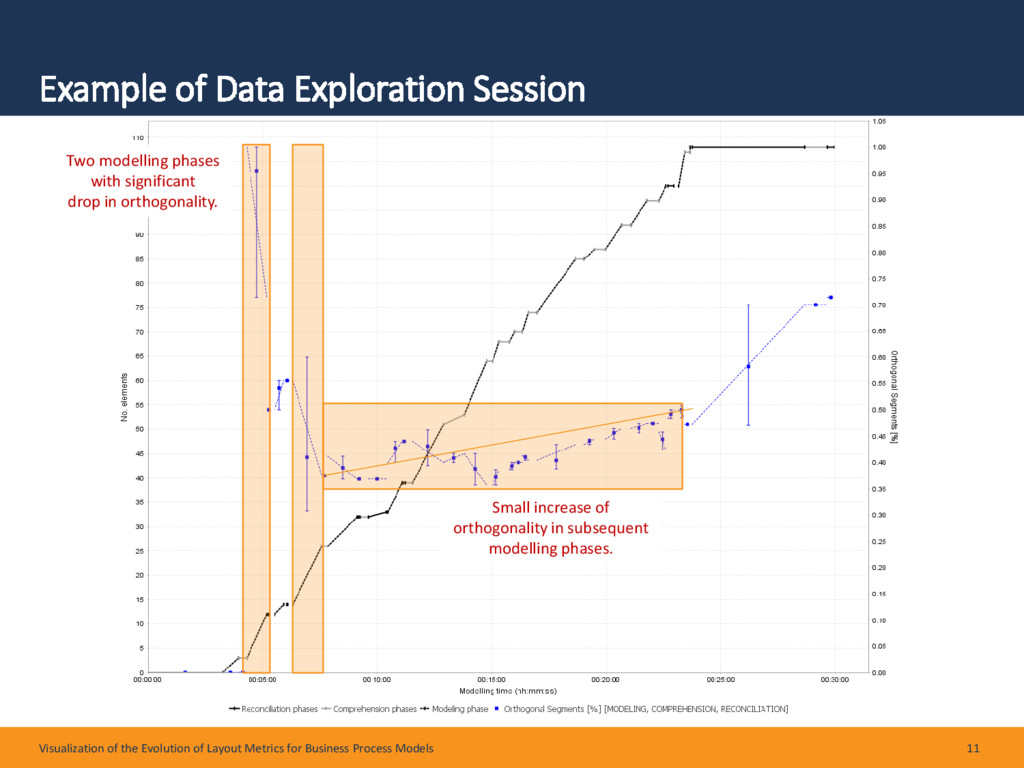
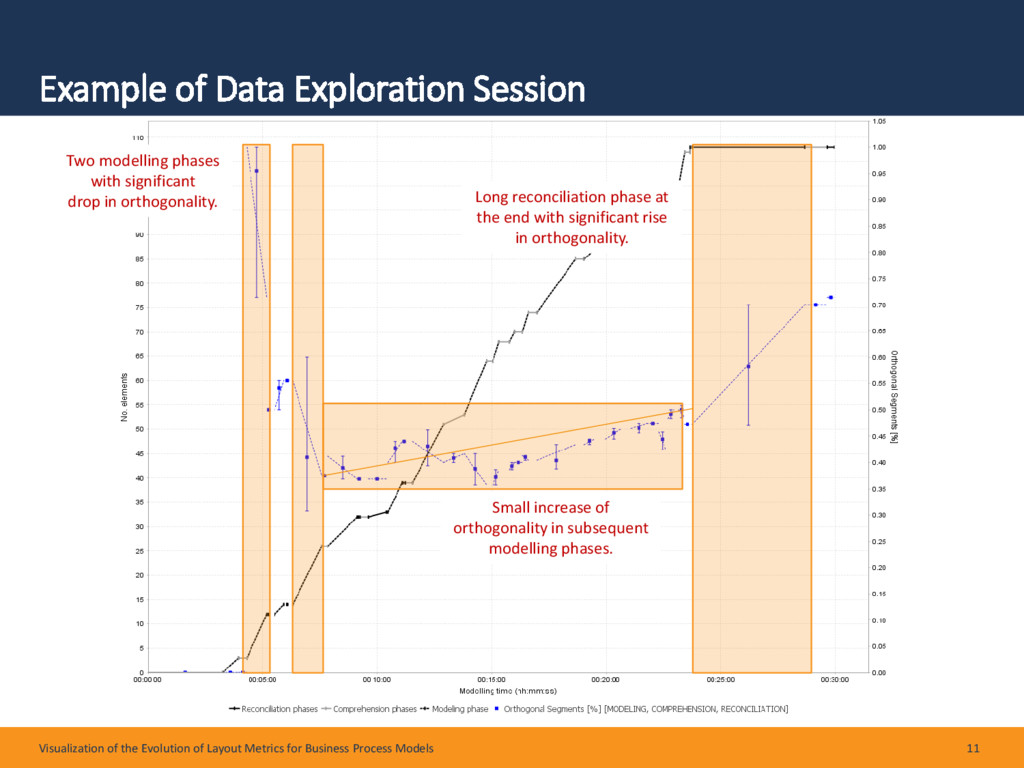
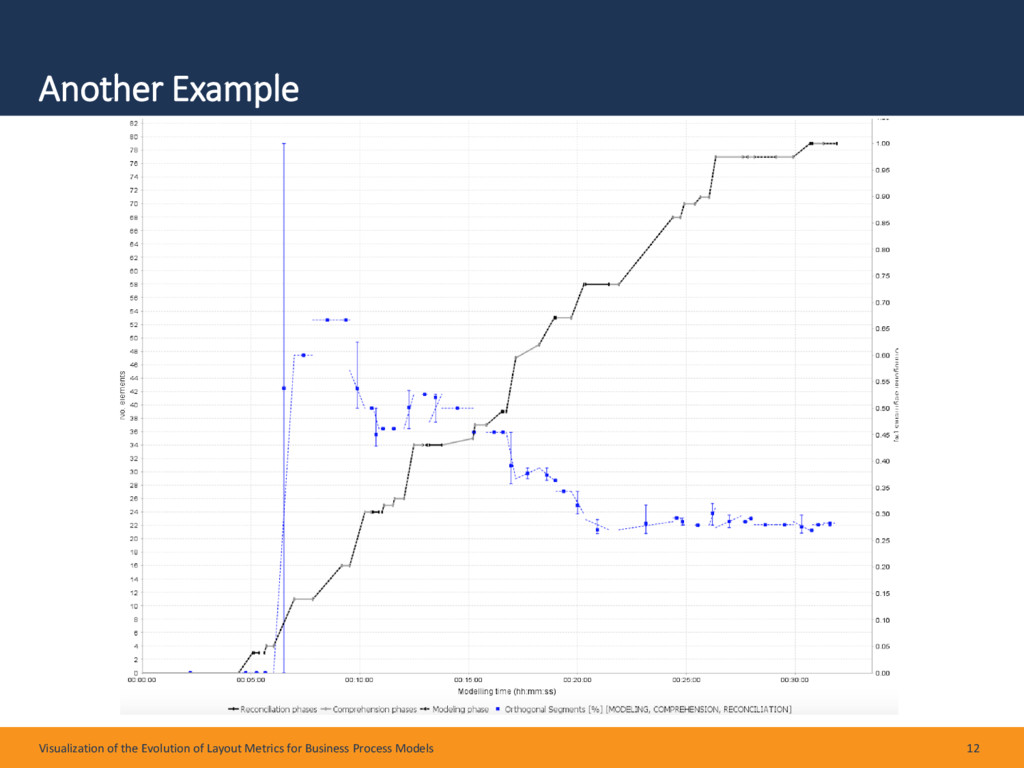
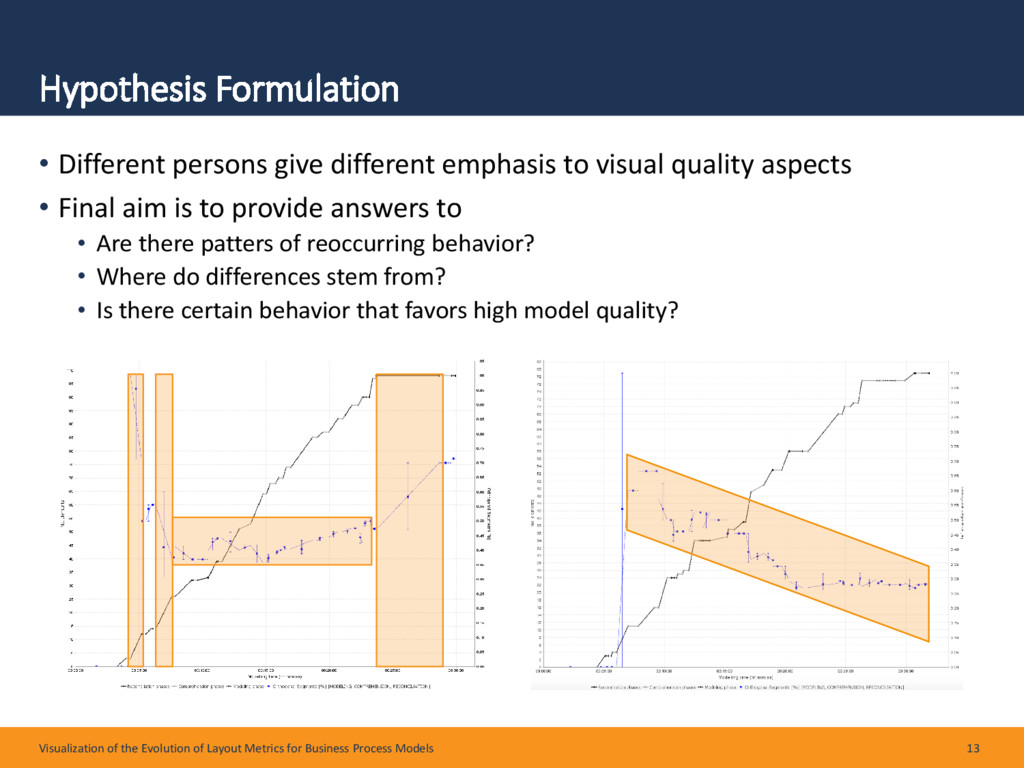
Considerable progress regarding impact factors of process model understandability has been achieved. For example, it has been shown that layout features of process models have an effect on model understandability. Even so, it appears that our knowledge about the modeler's behavior regarding the layout of a model is very limited. In particular, research focuses on the end product or the outcome of the process modeling act rather than the act itself. This paper extends existing research by opening this black box and introducing an enhanced technique enabling the visual analysis of the modeler's behavior towards layout. We demonstrate examples showing that our approach provides valuable insights to better understand and support the creation of process models. Additionally, we sketch challenges impeding this support for future research.

More info: https://andrea.burattin.net/publications/2016-taproviz-2

Andrea Burattin

September 19, 2016
Tweet

More Decks by Andrea Burattin

Other Decks in Research

Transcript

  1. Visualization of the Evolution of Layout Metrics for Business Process

    Models Cornelia Haisjackl 1 Andrea Burattin 1 Pnina Soffer 2 Barbara Weber 1,3 1 University of Innsbruck, Austria 2 University of Haifa, Israel 3 Technical University of Denmark This research is supported by Austrian Science Fund (FWF): P26140.
  2. Table of Contents • Intro, importance of secondary notation •

    Background • Process of process modeling • Modeling phase diagram • Metrics • Crossing edges • Orthogonal segments • Advanced Modeling Phase Diagram • Demonstration • Methodology/description • Crossing edges • Orthogonal segments • Interpretation challenges • Conclusions Visualization of the Evolution of Layout Metrics for Business Process Models 2
  3. Process Models and their Representation • Business process models are

    useful to • Obtain a common understanding of a company business by • Facilitating documentation • Facilitating communication • Enable the discovery of improvement opportunities Visualization of the Evolution of Layout Metrics for Business Process Models 3
  4. Process Models and their Representation • Business process models are

    useful to • Obtain a common understanding of a company business by • Facilitating documentation • Facilitating communication • Enable the discovery of improvement opportunities • To serve their purposes, models need to be understood properly Visualization of the Evolution of Layout Metrics for Business Process Models 3
  5. The Secondary Notation • These two processes have exactly the

    same semantic: Visualization of the Evolution of Layout Metrics for Business Process Models 4 Pictures from “The Impact of Secondary Notation on Process Model Understanding”. Matthias Schrepfer, Johannes Wolf, Jan Mendling, Hajo A. Reijers S ubmit quote Negotiate contract Approve regional manager Approve sales C onclude user deal Archive contract R e-negotiate OK < 5m$ 5m$ Decline S ubmit quote Negotiate contract Approve regional manager Approve sales C onclude user deal Archive contract R e-negotiate OK < 5m$ 5m$ Decline
  6. Some Features Affecting the Secondary Notation • Edges • Length

    of edges • Edges style: straight, curved or with bending points • Crossing edges • Text on edges • Number of ending points (elements with no outgoing edges) • Angles • Model’s structure • Shape • Area Visualization of the Evolution of Layout Metrics for Business Process Models 5 • Direction • General direction • Location of ending events • Branching off • Consistency of the flow • Symmetry in blocks • Alignment in the model
  7. Some Features Affecting the Secondary Notation • Edges • Length

    of edges • Edges style: straight, curved or with bending points • Crossing edges • Text on edges • Number of ending points (elements with no outgoing edges) • Angles • Model’s structure • Shape • Area Visualization of the Evolution of Layout Metrics for Business Process Models 5 • Direction • General direction • Location of ending events • Branching off • Consistency of the flow • Symmetry in blocks • Alignment in the model
  8. Process of Process Modeling • To investigate the secondary notation

    we investigate the process leading to the final process representation • We used the Cheetah Experimental Platform • Tool to model a process model • Records all model interactions • Allows replaying the process modeling step-by-step Visualization of the Evolution of Layout Metrics for Business Process Models 6 J. Pinggera, S. Zugal and B. Weber: Investigating the Process of Process Modeling with Cheetah Experimental Platform. In: Proc. ER-POIS ’10, pp. 13–18, 2010 … Cheetah Experimental Platform (CEP) Traditional Research: Resulting Process Model
  9. Modeling Phase Diagram (MPD) • A typical modeling session is

    characterized by the repetition of three phases • Modeling: creation of the actual mode • Reconciliation: enhancement of the model (moving or renaming nodes and edges) • Comprehension: identification of requirements (no interaction) Visualization of the Evolution of Layout Metrics for Business Process Models 7
  10. Modeling Phase Diagram (MPD) • A typical modeling session is

    characterized by the repetition of three phases • Modeling: creation of the actual mode • Reconciliation: enhancement of the model (moving or renaming nodes and edges) • Comprehension: identification of requirements (no interaction) • Analysis of the interactions to create the modeling phase diagram Visualization of the Evolution of Layout Metrics for Business Process Models 7 J. Pinggera, P. Soffer, S. Zugal, B. Weber, M. Weidlich, D. Fahland, H. Reijers and J. Mendling: Modeling Styles in Business Process Modeling. In: Proc. BPMDS 2012 Example 2 Example 1 0 10 20 30 40 50 60 70 0 500 1000 1500 2000 2500 3000 Number of Elements Time [s] COMPREHENSION MODELING RECONCILIATION
  11. Modeling Phase Diagram (MPD) • A typical modeling session is

    characterized by the repetition of three phases • Modeling: creation of the actual mode • Reconciliation: enhancement of the model (moving or renaming nodes and edges) • Comprehension: identification of requirements (no interaction) • Analysis of the interactions to create the modeling phase diagram Visualization of the Evolution of Layout Metrics for Business Process Models 7 J. Pinggera, P. Soffer, S. Zugal, B. Weber, M. Weidlich, D. Fahland, H. Reijers and J. Mendling: Modeling Styles in Business Process Modeling. In: Proc. BPMDS 2012 Example 2 Example 1 0 10 20 30 40 50 60 70 0 500 1000 1500 2000 2500 3000 Number of Elements Time [s] COMPREHENSION MODELING RECONCILIATION
  12. Crossing Edge Metric • Literature suggests models should not contain

    crossing edges • Metric represents the ratio of edges that contains crossing over all edges • Note: not all models are planar, so we might have models necessarily with metric > 0 Visualization of the Evolution of Layout Metrics for Business Process Models 8 References Purchase, H.: Which Aesthetic has the Greatest Effect on Human Understanding? In: Proc. GD'97. (1997) 248-261 Petre, M.: Why Looking Isn't Always Seeing: Readership Skills and Graphical Programming. Communications of the ACM (1995) 33-44 S ubmit quote Negotiate contract Approve regional manager Approve sales C onclude user deal Archive contract R e-negotiate OK < 5m$ 5m$ Decline
  13. Orthogonal Segments • Literature suggests edges should make use of

    a Manhattan layout • Edges split into segments • Each segment should be either horizontal or vertical • Metric as the ratio of segments that are orthogonal over the total number of segments Visualization of the Evolution of Layout Metrics for Business Process Models 9 Reference Gschwind, T., Pinggera, J., Zugal, S., Reijers, H., Weber, B.: A Linear Time Layout Algorithm for Business Process Models. Technical Report RZ3830, IBM Research (2012) Approve regional manager Approve sales C onclude user deal < 5m$ 5m$ Approve regional manager Approve sales C onclude user deal < 5m$ 5m$
  14. Orthogonal Segments • Literature suggests edges should make use of

    a Manhattan layout • Edges split into segments • Each segment should be either horizontal or vertical • Metric as the ratio of segments that are orthogonal over the total number of segments Visualization of the Evolution of Layout Metrics for Business Process Models 9 Reference Gschwind, T., Pinggera, J., Zugal, S., Reijers, H., Weber, B.: A Linear Time Layout Algorithm for Business Process Models. Technical Report RZ3830, IBM Research (2012) Approve regional manager Approve sales C onclude user deal < 5m$ 5m$ Approve regional manager Approve sales C onclude user deal < 5m$ 5m$ Two orthogonal segments
  15. Orthogonal Segments • Literature suggests edges should make use of

    a Manhattan layout • Edges split into segments • Each segment should be either horizontal or vertical • Metric as the ratio of segments that are orthogonal over the total number of segments Visualization of the Evolution of Layout Metrics for Business Process Models 9 Reference Gschwind, T., Pinggera, J., Zugal, S., Reijers, H., Weber, B.: A Linear Time Layout Algorithm for Business Process Models. Technical Report RZ3830, IBM Research (2012) Approve regional manager Approve sales C onclude user deal < 5m$ 5m$ Approve regional manager Approve sales C onclude user deal < 5m$ 5m$ Two orthogonal segments A non-orthogonal segment
  16. Advanced Modeling Phase Diagram (AMPD) • Idea behind the Advanced

    Modeling Phase Diagram • Compute the metric on the model obtained after each interaction • Plot the evolution (or avg/min/max for each phase) of the metric on top of the MPD Visualization of the Evolution of Layout Metrics for Business Process Models 10
  17. Example of Data Exploration Session Visualization of the Evolution of

    Layout Metrics for Business Process Models 11
  18. Example of Data Exploration Session Visualization of the Evolution of

    Layout Metrics for Business Process Models 11 Two modelling phases with significant drop in orthogonality.
  19. Example of Data Exploration Session Visualization of the Evolution of

    Layout Metrics for Business Process Models 11 Two modelling phases with significant drop in orthogonality. Small increase of orthogonality in subsequent modelling phases.
  20. Example of Data Exploration Session Visualization of the Evolution of

    Layout Metrics for Business Process Models 11 Two modelling phases with significant drop in orthogonality. Small increase of orthogonality in subsequent modelling phases. Long reconciliation phase at the end with significant rise in orthogonality.
  21. Another Example Visualization of the Evolution of Layout Metrics for

    Business Process Models 12 Continuous drop of the orthogonality.
  22. Hypothesis Formulation • Different persons give different emphasis to visual

    quality aspects • Final aim is to provide answers to • Are there patters of reoccurring behavior? • Where do differences stem from? • Is there certain behavior that favors high model quality? Visualization of the Evolution of Layout Metrics for Business Process Models 13
  23. Analysis of Modeling Behaviors • We analyzed a dataset of

    a BPMN modeling session • Session occurred at TU Eindhoven in December 2012 • 120 participants • Participants were asked to model a mortgage application process • We built the Advanced MPD for each modeling session considering • Crossing edges • Orthogonal segments Visualization of the Evolution of Layout Metrics for Business Process Models 14
  24. Analysis of Modeling Behaviors • We analyzed a dataset of

    a BPMN modeling session • Session occurred at TU Eindhoven in December 2012 • 120 participants • Participants were asked to model a mortgage application process • We built the Advanced MPD for each modeling session considering • Crossing edges • Orthogonal segments Visualization of the Evolution of Layout Metrics for Business Process Models 14 Focus on the modeler’s behavior with respect to the given metric.
  25. Analysis of Modeling Behaviors • We analyzed a dataset of

    a BPMN modeling session • Session occurred at TU Eindhoven in December 2012 • 120 participants • Participants were asked to model a mortgage application process • We built the Advanced MPD for each modeling session considering • Crossing edges • Orthogonal segments • Crossing edges • 119 participants have at least one crossing edge • Causes for crossing edge 1. The modeler introduces it by moving an element already connected 2. The tool introduces it when the modeler connects two elements • 3 behavioral patterns Visualization of the Evolution of Layout Metrics for Business Process Models 14 Focus on the modeler’s behavior with respect to the given metric.
  26. Crossing Edge Metric – Pattern 1 • Immediate resolution of

    the problem Visualization of the Evolution of Layout Metrics for Business Process Models 15 0 0.02 0.04 0.06 0.08 0.1 0.12 0.14 0.16 00:00 05:00 10:00 15:00 20:00 25:00 30:00 35:00 40:00 45:00 Metric value Time Crossing edge
  27. Crossing Edge Metric – Pattern 2 • Errors introduced are

    never resolved (drop is due to new edges) Visualization of the Evolution of Layout Metrics for Business Process Models 16 0 0.02 0.04 0.06 0.08 0.1 0.12 0.14 00:00 05:00 10:00 15:00 20:00 25:00 30:00 35:00 40:00 45:00 Metric value Time Crossing edge
  28. Crossing Edge Metric – Pattern 3 • Initial resolve, then

    errors are kept Visualization of the Evolution of Layout Metrics for Business Process Models 17 0 0.02 0.04 0.06 0.08 0.1 0.12 0.14 00:00 05:00 10:00 15:00 20:00 25:00 30:00 35:00 Metric value Time Crossing edge
  29. Orthogonal Segments • Metric computed when the first edge is

    put • In our case, typically, the first edge is orthogonal (metric = 1) • As the modeling tool has no “auto-alignment” feature we considered a threshold of 7 pixels • Still, no model maintained perfect alignment • 3+1 behavioral patterns Visualization of the Evolution of Layout Metrics for Business Process Models 18 Approve regional manager Approve sales C onclude user deal < 5m$ 5m$ Two orthogonal segments
  30. Orthogonal Segments – Pattern 1 • User clearly “cared” about

    this feature Visualization of the Evolution of Layout Metrics for Business Process Models 19 0 0.1 0.2 0.3 0.4 0.5 0.6 0.7 0.8 0.9 1 00:00:00 00:10:00 00:20:00 00:30:00 00:40:00 00:50:00 01:00:00 01:10:00 01:20:00 Metric value Time Orthogonal segments
  31. Orthogonal Segments – Pattern 2 • Apparently, no real effort

    to keep the metric high Visualization of the Evolution of Layout Metrics for Business Process Models 20 0 0.1 0.2 0.3 0.4 0.5 0.6 0.7 0.8 0.9 1 00:00 05:00 10:00 15:00 20:00 25:00 30:00 35:00 40:00 Metric value Time Orthogonal segments
  32. Orthogonal Segments – Pattern 3 • Next to the end,

    effort to improve the metric Visualization of the Evolution of Layout Metrics for Business Process Models 21 0 0.1 0.2 0.3 0.4 0.5 0.6 0.7 0.8 0.9 1 00:00 05:00 10:00 15:00 20:00 25:00 30:00 35:00 40:00 45:00 Metric value Time Orthogonal segments
  33. Orthogonal Segments – Pattern 4 • Mix of different reaction

    types Visualization of the Evolution of Layout Metrics for Business Process Models 22 0 0.1 0.2 0.3 0.4 0.5 0.6 0.7 0.8 0.9 1 00:00 05:00 10:00 15:00 20:00 25:00 30:00 35:00 40:00 45:00 50:00 Metric value Time Orthogonal segments
  34. Limitations and Interpretation Challenges • These are preliminary results, no

    generalization is possible Visualization of the Evolution of Layout Metrics for Business Process Models 23
  35. Limitations and Interpretation Challenges • These are preliminary results, no

    generalization is possible Visualization of the Evolution of Layout Metrics for Business Process Models 23 Several metrics contributing to the design of the very same model.
  36. Limitations and Interpretation Challenges • These are preliminary results, no

    generalization is possible Visualization of the Evolution of Layout Metrics for Business Process Models 23 Several metrics contributing to the design of the very same model. Some metrics, to be interpreted, require information regarding the context.
  37. Limitations and Interpretation Challenges • These are preliminary results, no

    generalization is possible Visualization of the Evolution of Layout Metrics for Business Process Models 23 Several metrics contributing to the design of the very same model. Increases or decreases of a metric do not imply the same concepts. Some metrics, to be interpreted, require information regarding the context.
  38. Limitations and Interpretation Challenges • These are preliminary results, no

    generalization is possible Visualization of the Evolution of Layout Metrics for Business Process Models 23 Several metrics contributing to the design of the very same model. Increases or decreases of a metric do not imply the same concepts. Some metrics, to be interpreted, require information regarding the context. Metric stability may change during the process of process modeling.
  39. Limitations and Interpretation Challenges • These are preliminary results, no

    generalization is possible Visualization of the Evolution of Layout Metrics for Business Process Models 23 Several metrics contributing to the design of the very same model. Increases or decreases of a metric do not imply the same concepts. Looking at one metric at the time does not consider trade-offs between metrics. Some metrics, to be interpreted, require information regarding the context. Metric stability may change during the process of process modeling.
  40. Limitations and Interpretation Challenges • These are preliminary results, no

    generalization is possible Visualization of the Evolution of Layout Metrics for Business Process Models 23 Several metrics contributing to the design of the very same model. Increases or decreases of a metric do not imply the same concepts. Looking at one metric at the time does not consider trade-offs between metrics. Some metrics, to be interpreted, require information regarding the context. Metric stability may change during the process of process modeling. The AMPD is not enough to grasp the actual intentions of the modeler.
  41. Summary and Outlook • We proposed an approach to inspect

    the evolution of secondary notation metrics • We focused on • Crossing edges • Orthogonal segments • We identified different behavioral patterns, typical in our dataset • We also highlighted several challenges that mainly represent our future working directions on this topic Visualization of the Evolution of Layout Metrics for Business Process Models 25