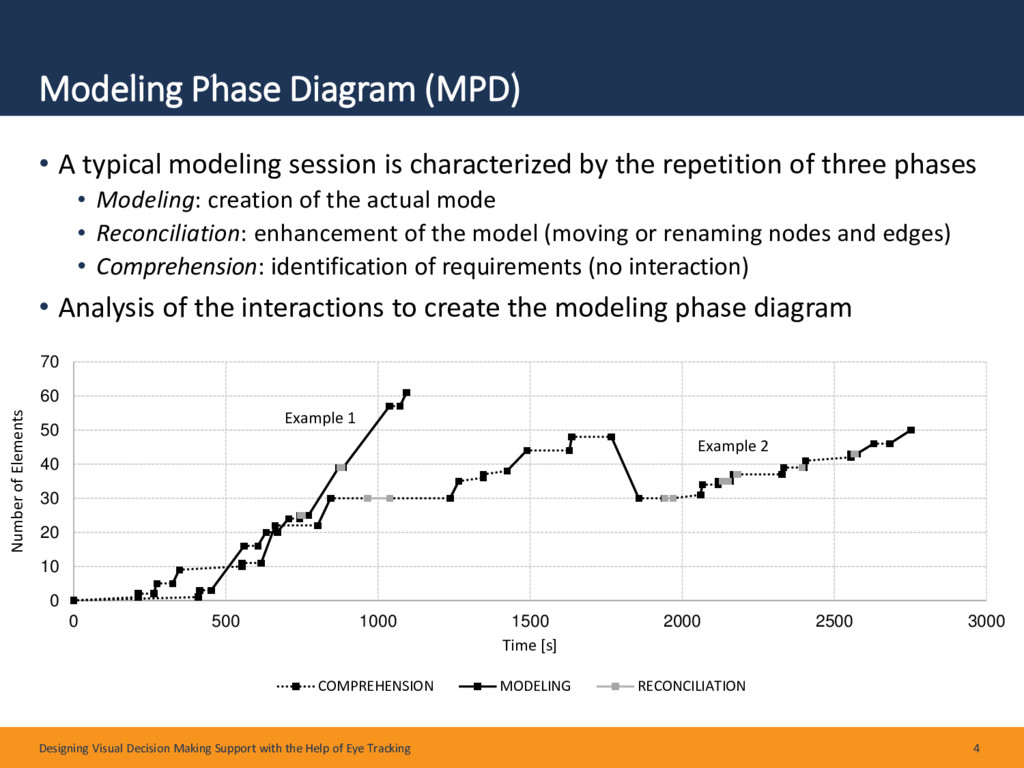
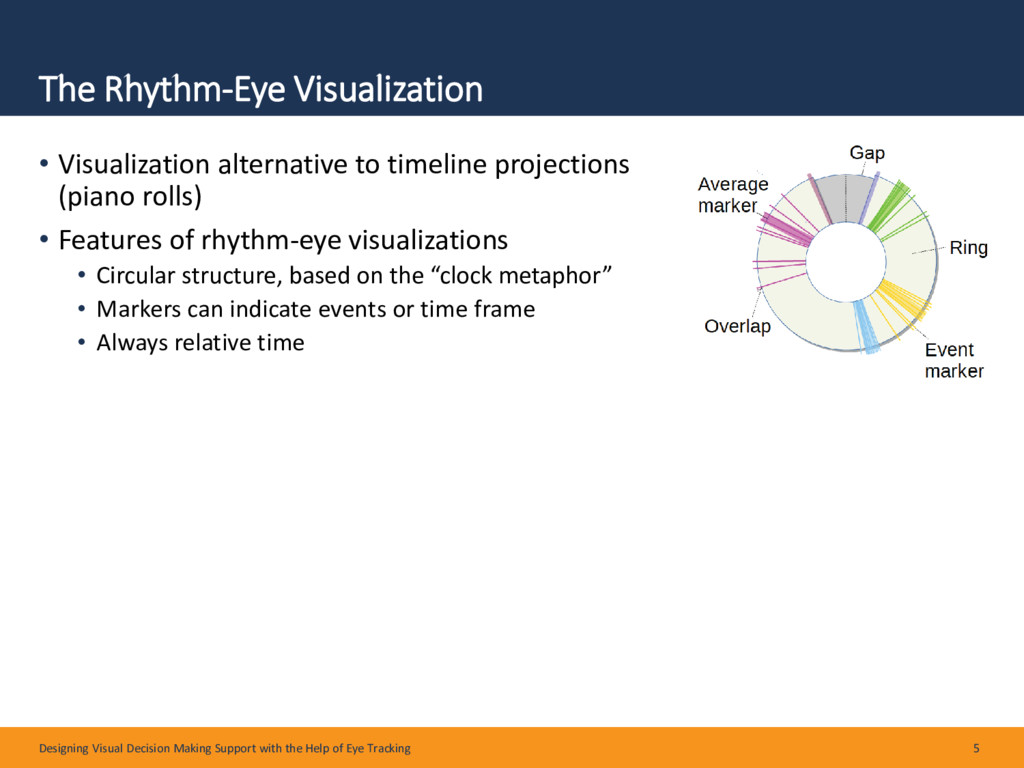
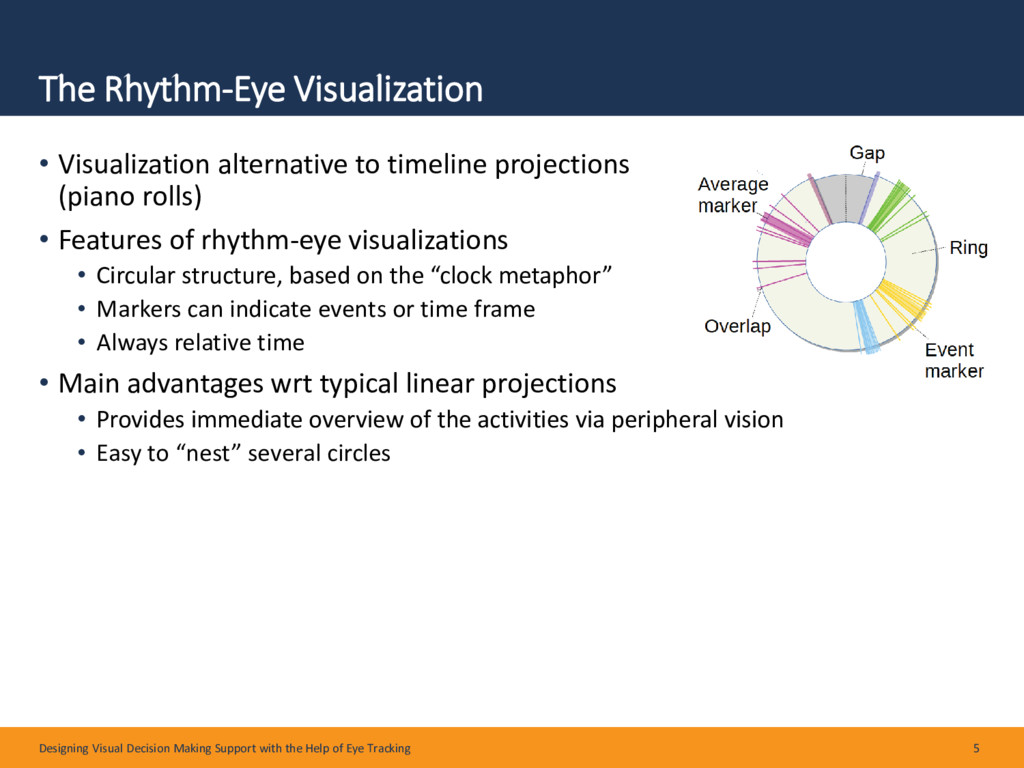
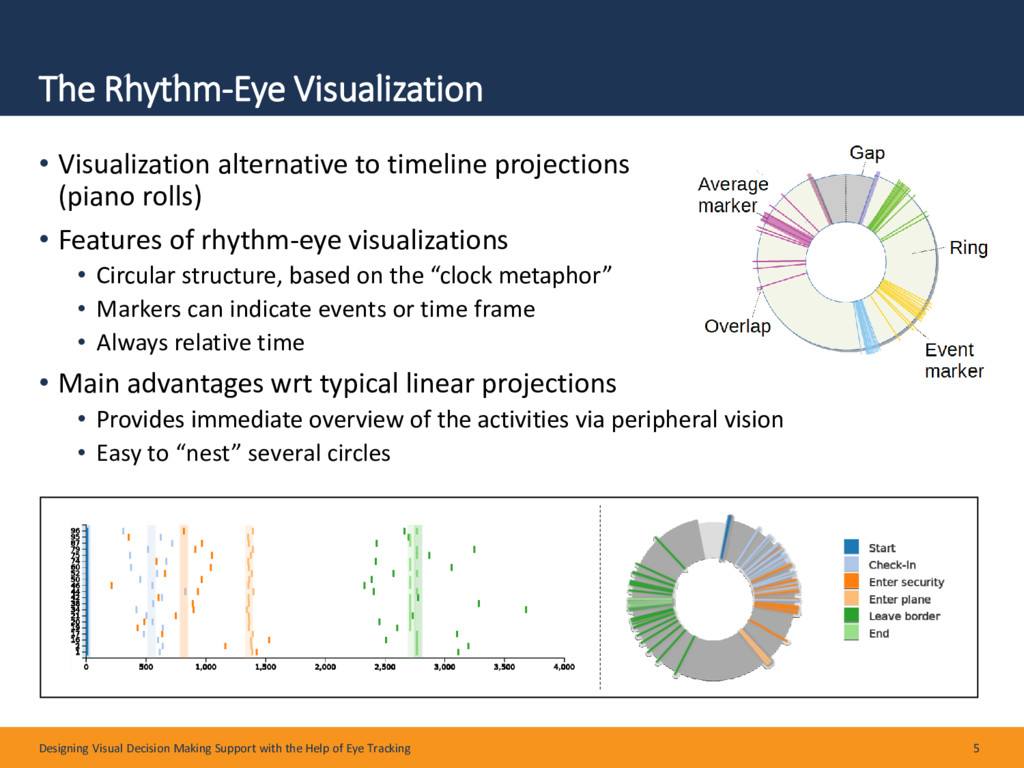
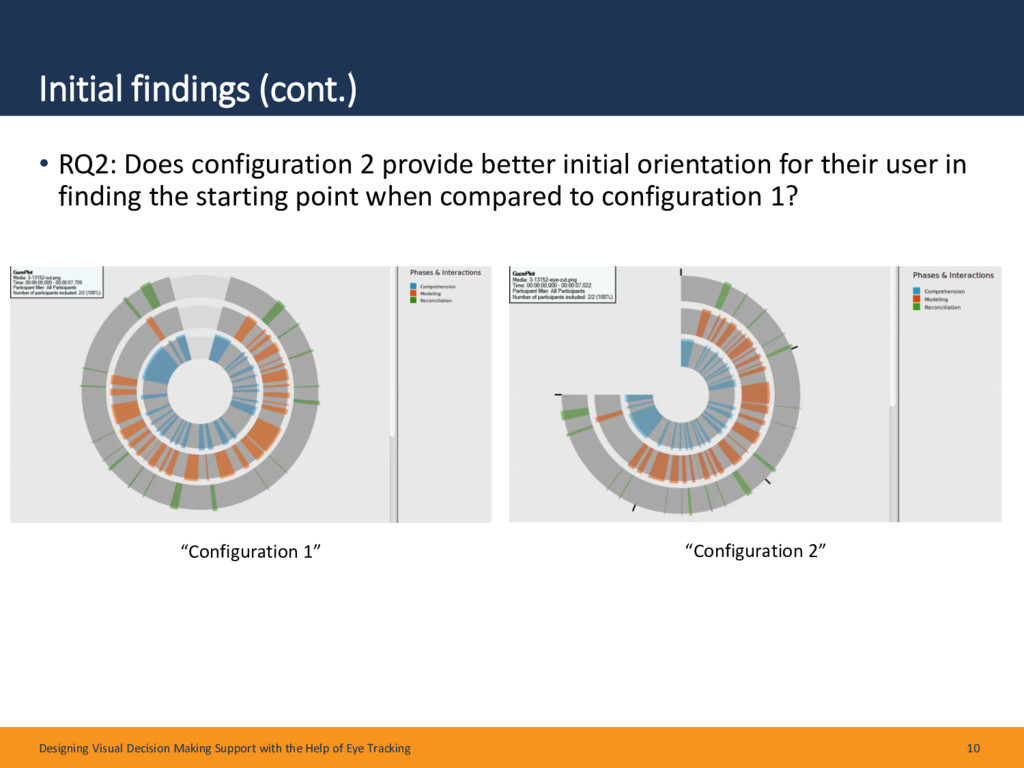
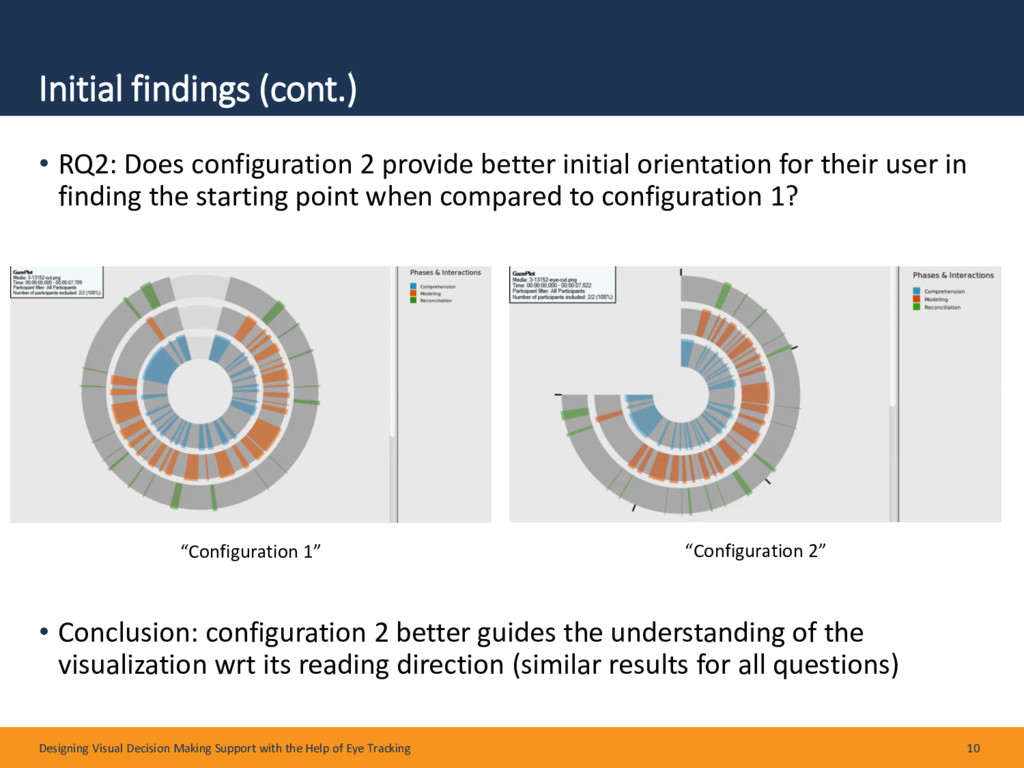
Data visualizations are helpful tools to cognitively access large amounts of data and make complex relationships in data understandable. This paper shows how results from neuro-physiological measurements, more speci cally eye-tracking, can support justi ed design decisions about improving existing data visualizations for exploring process execution data. This is achieved by gaining insight into how visualizations are used for decision-making. The presented examination is embedded in the domain of process modeling behavior analysis, and the analyses are performed on the background of representative analytical questions from the domain of process model behavior analysis. We present initial ndings on one out of three visualization types we have examined, which is the Rhythm-Eye visualization.
More info: https://andrea.burattin.net/publications/2017-bpmds