if there is performance impact. • Application transparency ◦ A tracing system that relies in application developers becomes fragile. • Tracing data quickly available ◦ We want to be able to react to problems as soon as possible.
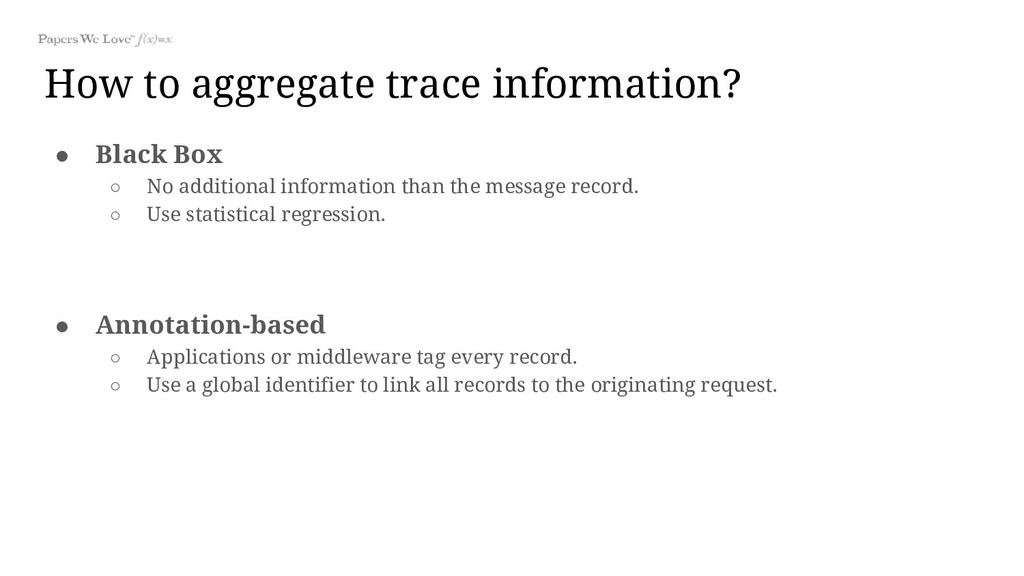
additional information than the message record. ◦ Use statistical regression. • Annotation-based ◦ Applications or middleware tag every record. ◦ Use a global identifier to link all records to the originating request.
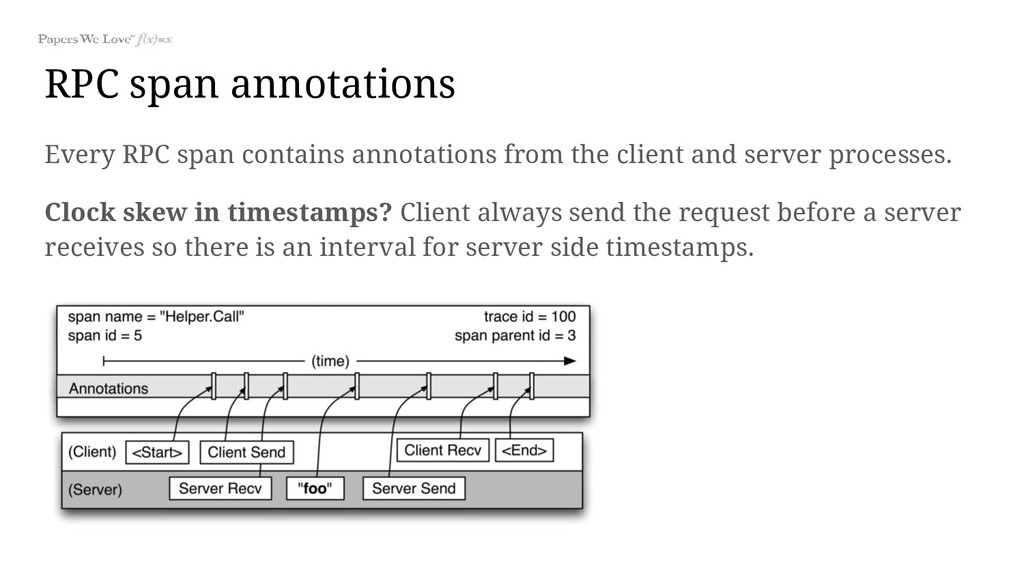
client and server processes. Clock skew in timestamps? Client always send the request before a server receives so there is an interval for server side timestamps.
in shared libraries: • Threading library ◦ The trace context container is injected in the thread context. ◦ This container is small and contains trace and span ids. • Control flow library ◦ Allows to construct callbacks and schedule them in a thread pool. ◦ Callbacks store the trace context of their creator. • RPC framework for Java and C++ ◦ Span and trace ids are transmitted from client to server. ◦ This is an essential instrumentation point.
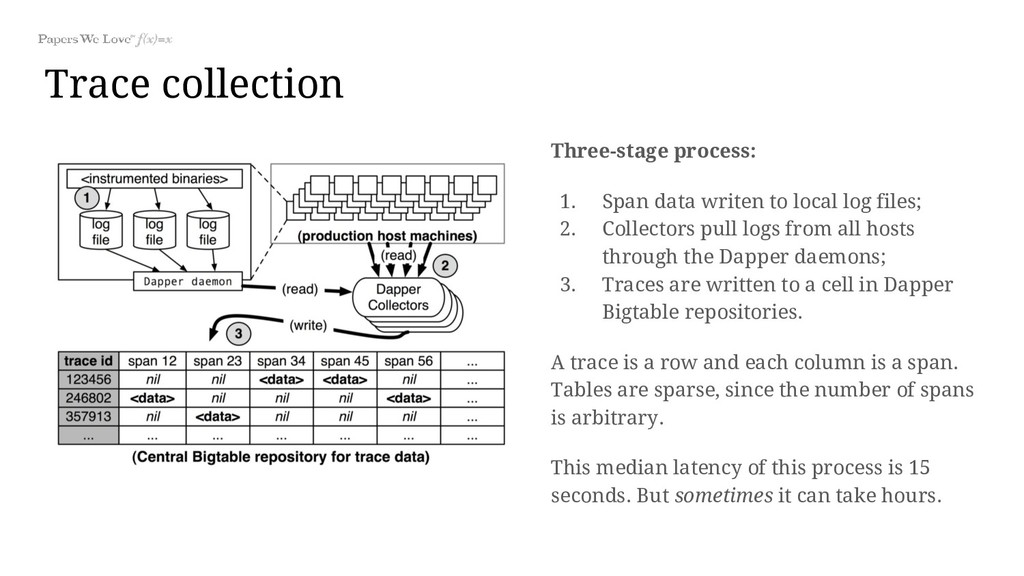
log files; 2. Collectors pull logs from all hosts through the Dapper daemons; 3. Traces are written to a cell in Dapper Bigtable repositories. A trace is a row and each column is a span. Tables are sparse, since the number of spans is arbitrary. This median latency of this process is 15 seconds. But sometimes it can take hours.
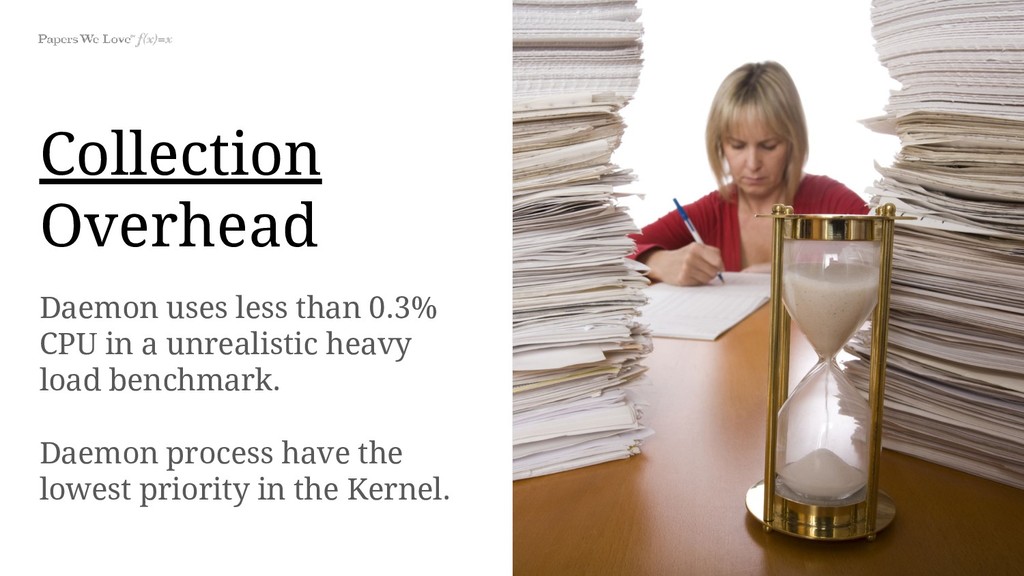
and Control Flow libraries. Core instrumentation in ~1000 lines for C++ and ~800 lines for Java. Key-value annotations takes ~500 lines. Dapper daemon is part of the basic machine image, so it is present in every server at Google. Nearly every Google production process supports tracing. Google developed a simple library to control trace ids propagation manually as a workarround in non-standard control flows that Dapper doesn’t support. Near 90% of Dapper traces contain annotations. Annotations are also used to relate traces with a certain feature.
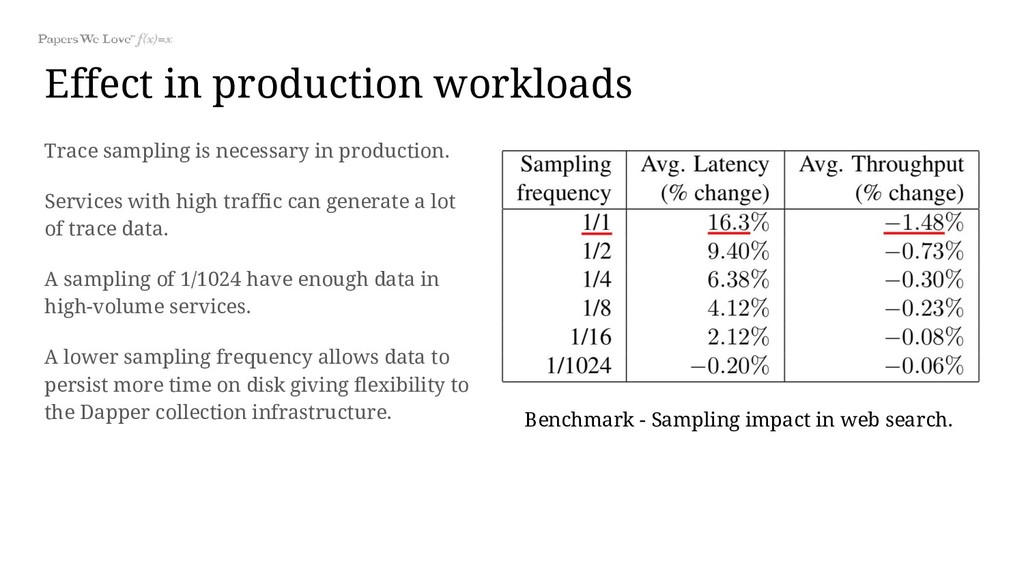
Services with high traffic can generate a lot of trace data. A sampling of 1/1024 have enough data in high-volume services. A lower sampling frequency allows data to persist more time on disk giving flexibility to the Dapper collection infrastructure. Benchmark - Sampling impact in web search.
Bulk access ◦ Map Reduce ◦ User-defined function that accept a trace • Indexed access ◦ Index storage cost is 74% of the trace data itself ◦ Access traces by service or hostname ◦ Hostname index was nearly not used ◦ Dropped hostname index, and composed one of {hostname,service,timestamp} • Analytics tools developed on top
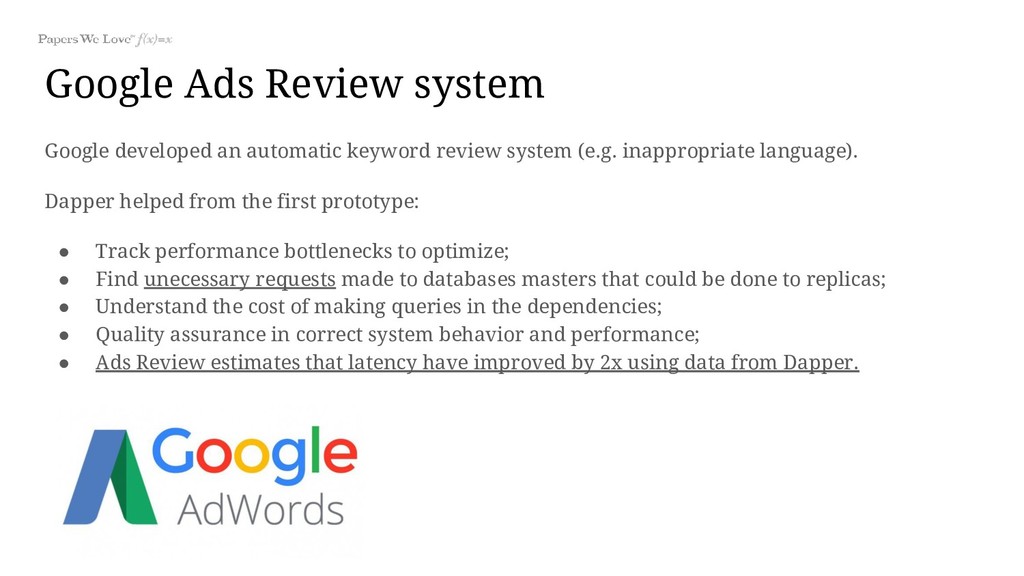
system (e.g. inappropriate language). Dapper helped from the first prototype: • Track performance bottlenecks to optimize; • Find unecessary requests made to databases masters that could be done to replicas; • Understand the cost of making queries in the dependencies; • Quality assurance in correct system behavior and performance; • Ads Review estimates that latency have improved by 2x using data from Dapper.
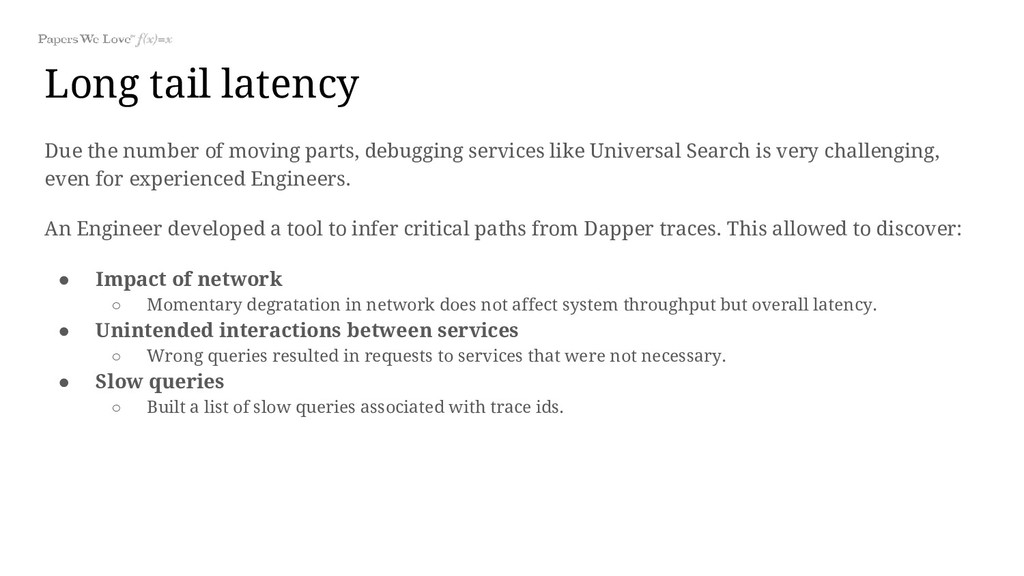
services like Universal Search is very challenging, even for experienced Engineers. An Engineer developed a tool to infer critical paths from Dapper traces. This allowed to discover: • Impact of network ◦ Momentary degratation in network does not affect system throughput but overall latency. • Unintended interactions between services ◦ Wrong queries resulted in requests to services that were not necessary. • Slow queries ◦ Built a list of slow queries associated with trace ids.
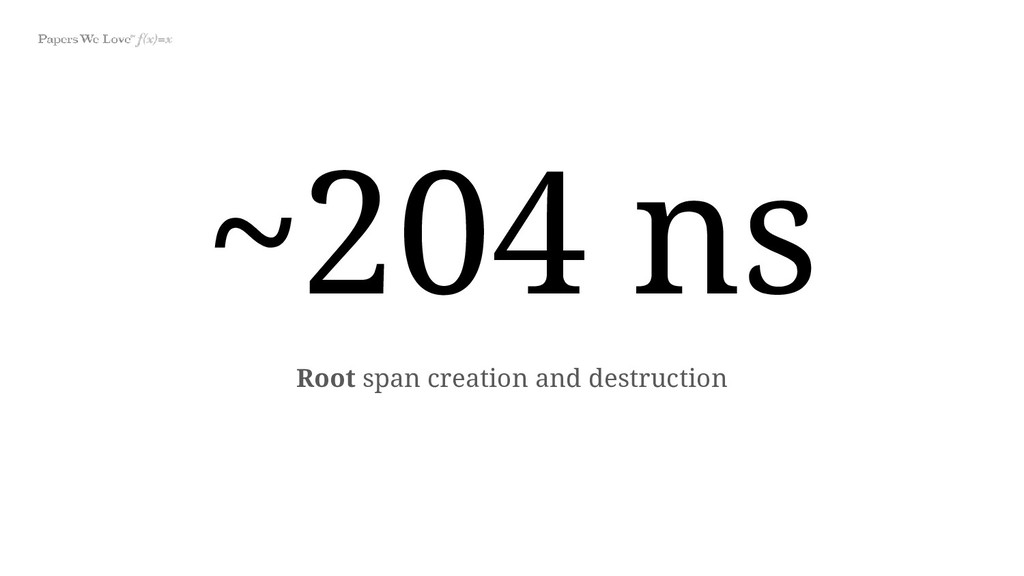
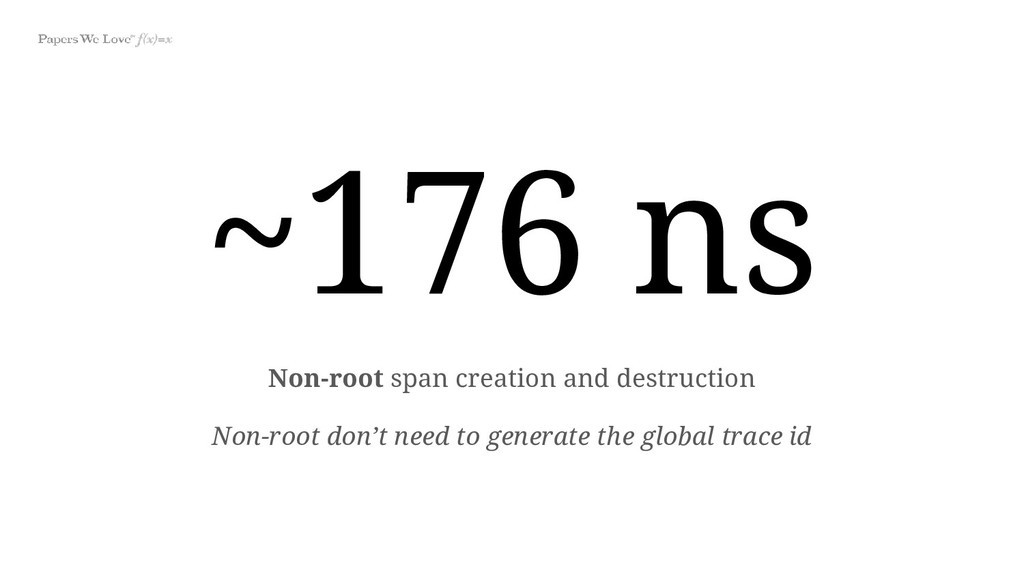
Google services to be tracked without the need for application level modifications. Shared libraries The usage of shared libraries was key to allow application transparency. Performance Dapper allows to trace requests without performance impacts due sampling.