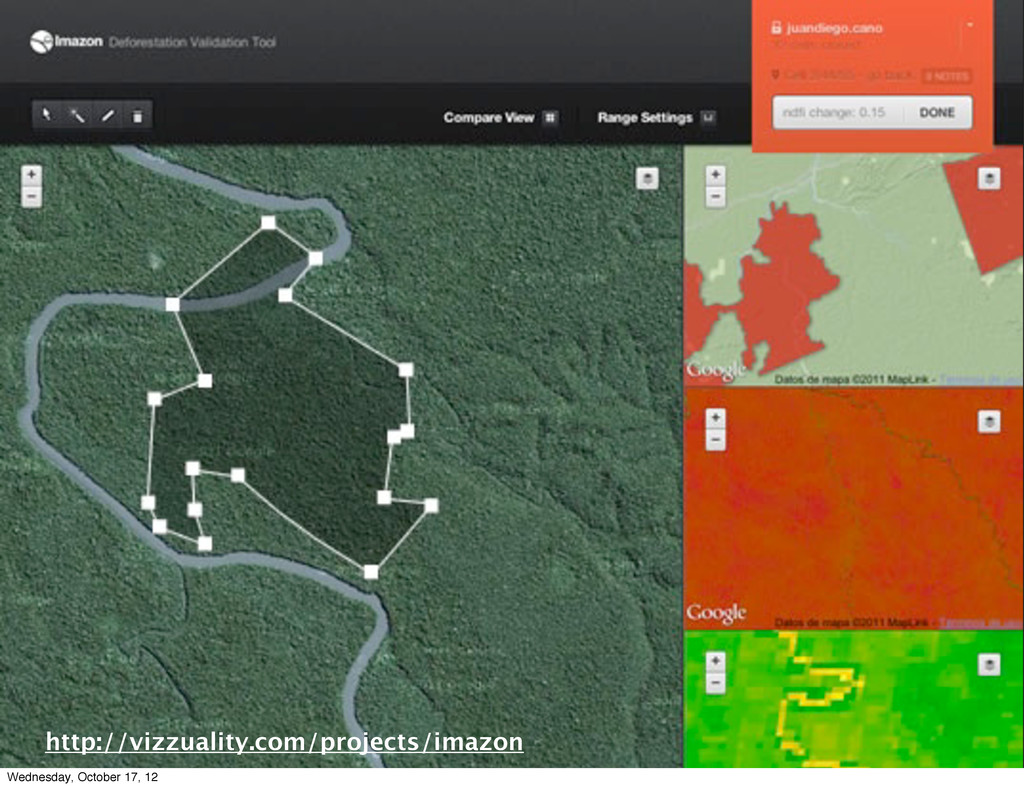
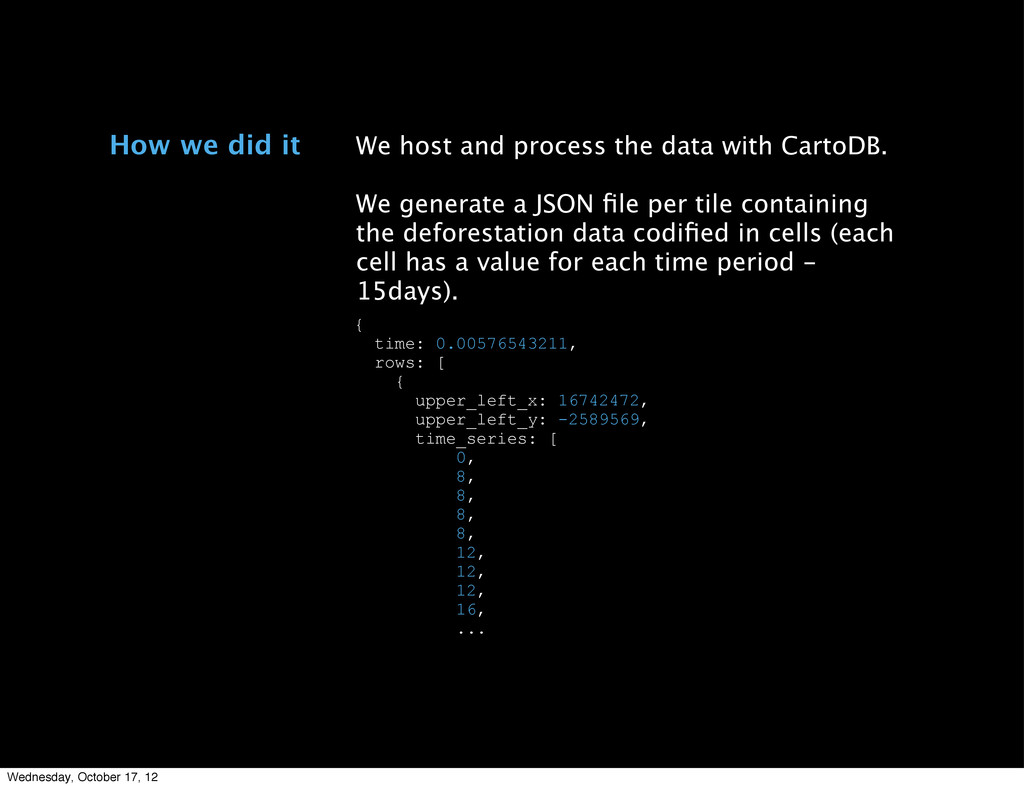
a JSON file per tile containing the deforestation data codified in cells (each cell has a value for each time period - 15days). How we did it { time: 0.00576543211, rows: [ { upper_left_x: 16742472, upper_left_y: -2589569, time_series: [ 0, 8, 8, 8, 8, 12, 12, 12, 16, ... Wednesday, October 17, 12
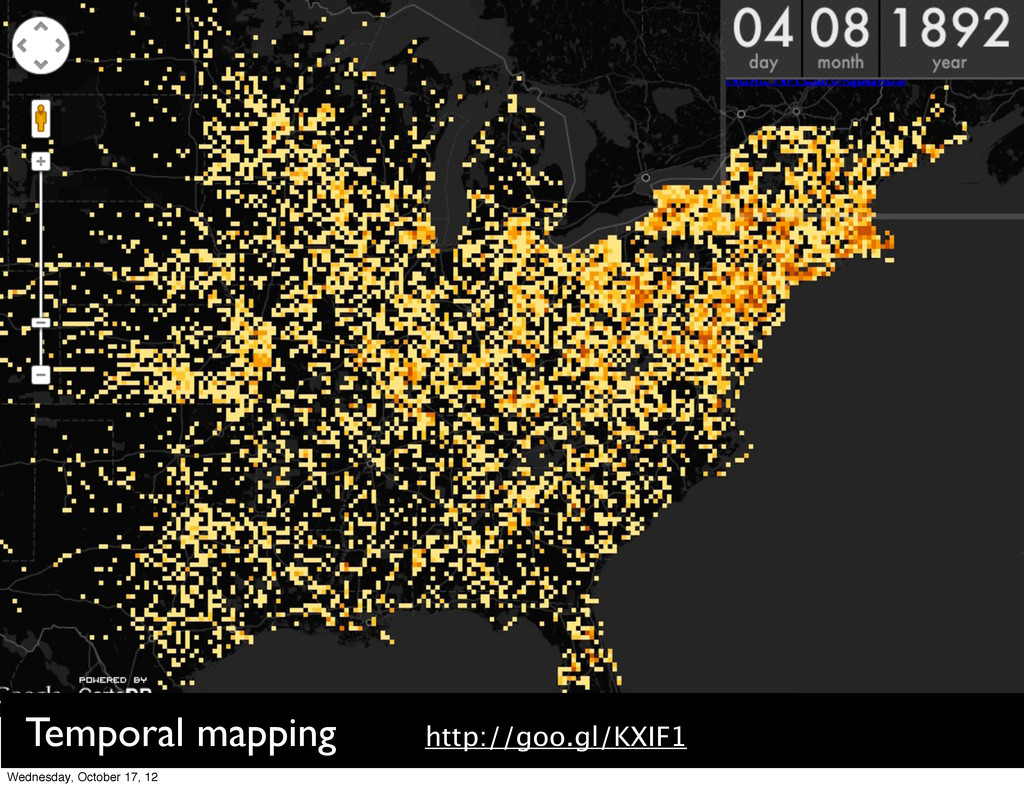
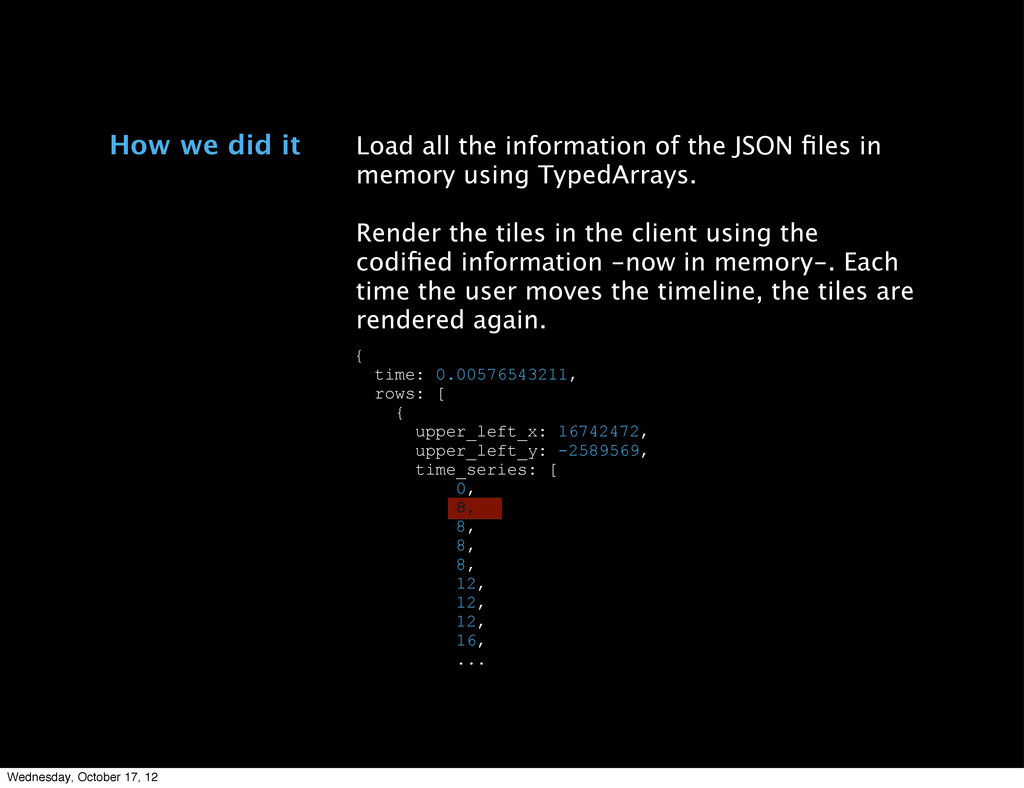
time_series: [ 0, 8, 8, 8, 8, 12, 12, 12, 16, ... Load all the information of the JSON files in memory using TypedArrays. Render the tiles in the client using the codified information -now in memory-. Each time the user moves the timeline, the tiles are rendered again. How we did it Wednesday, October 17, 12
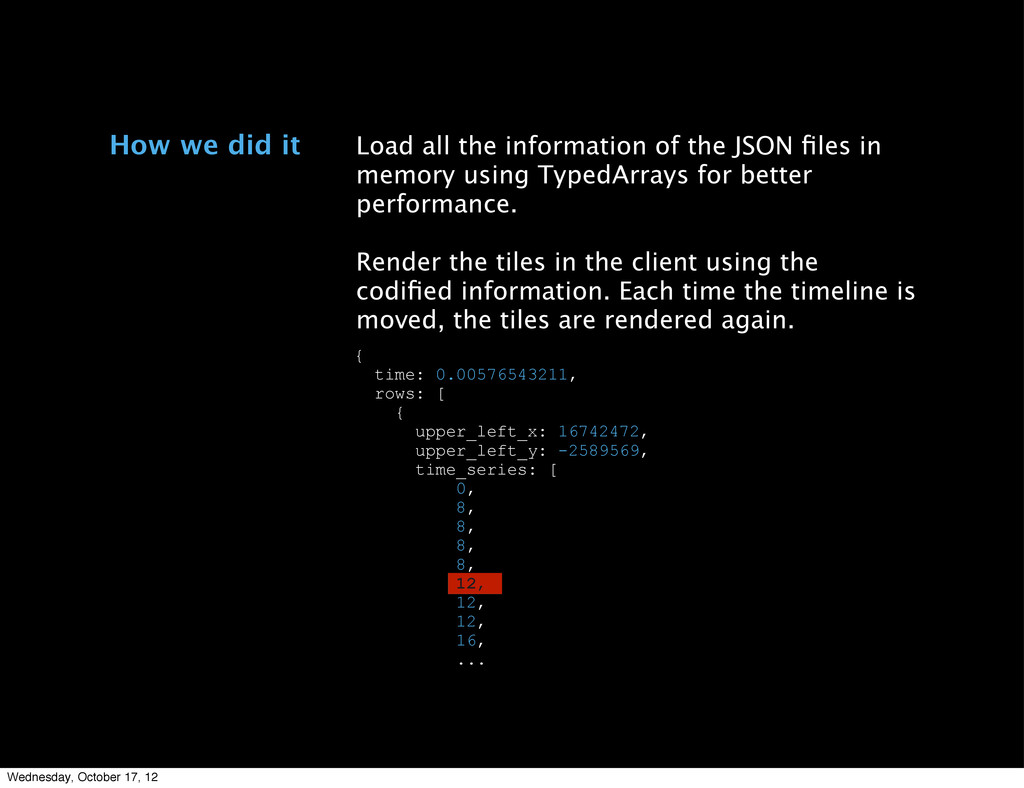
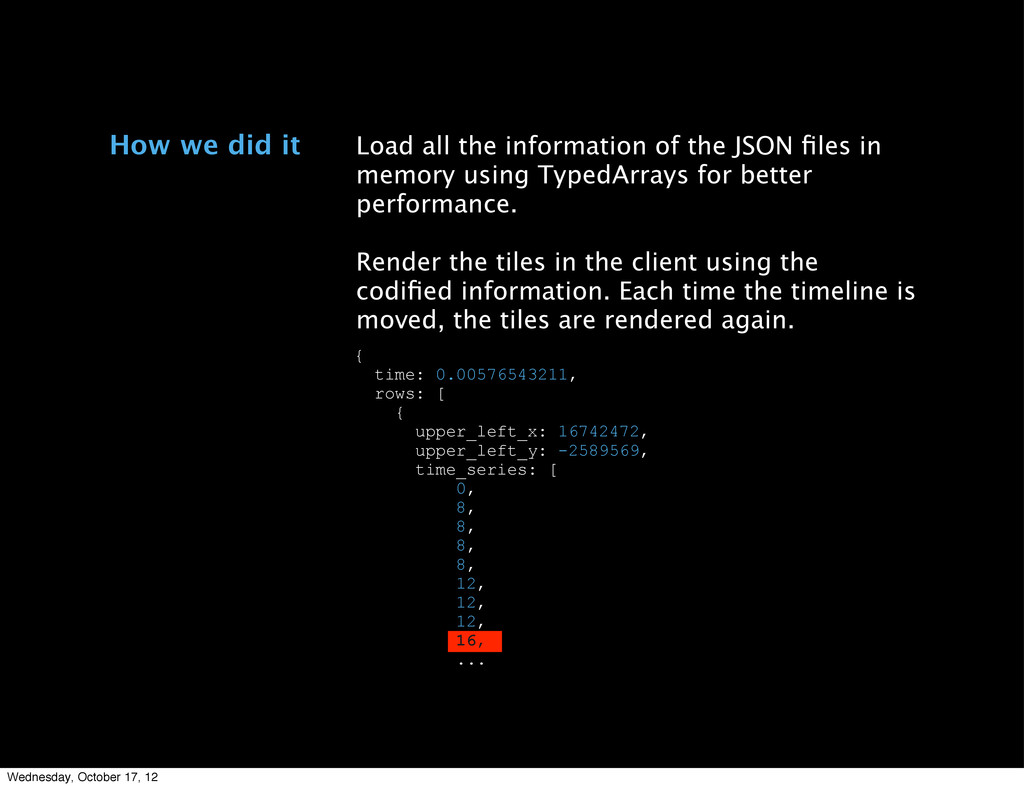
time_series: [ 0, 8, 8, 8, 8, 12, 12, 12, 16, ... Load all the information of the JSON files in memory using TypedArrays for better performance. Render the tiles in the client using the codified information. Each time the timeline is moved, the tiles are rendered again. How we did it Wednesday, October 17, 12
time_series: [ 0, 8, 8, 8, 8, 12, 12, 12, 16, ... Load all the information of the JSON files in memory using TypedArrays for better performance. Render the tiles in the client using the codified information. Each time the timeline is moved, the tiles are rendered again. How we did it Wednesday, October 17, 12