Upgrade to Pro — share decks privately, control downloads, hide ads and more …

Observability before and after Service Mesh

Observability before and after Service Mesh

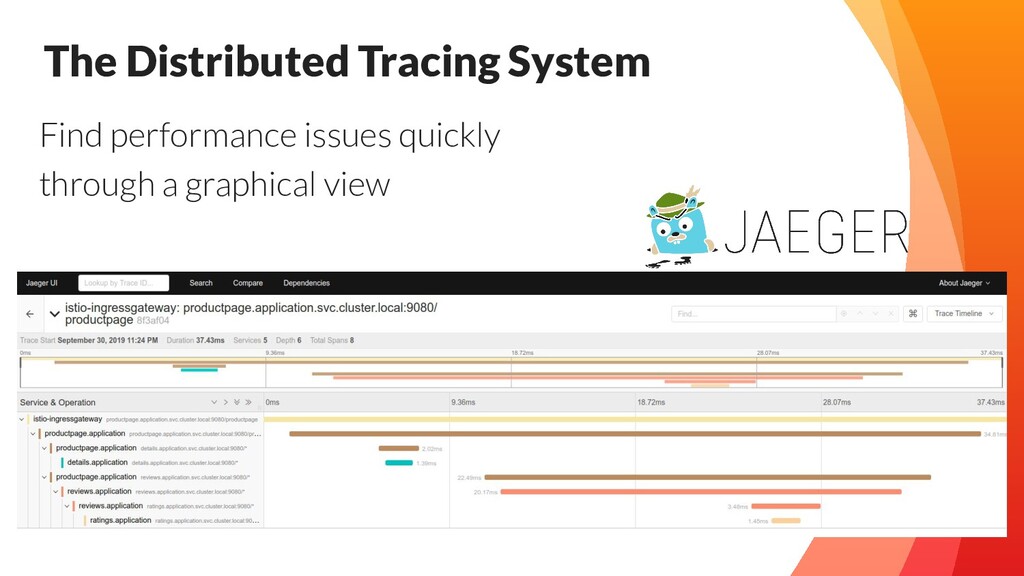
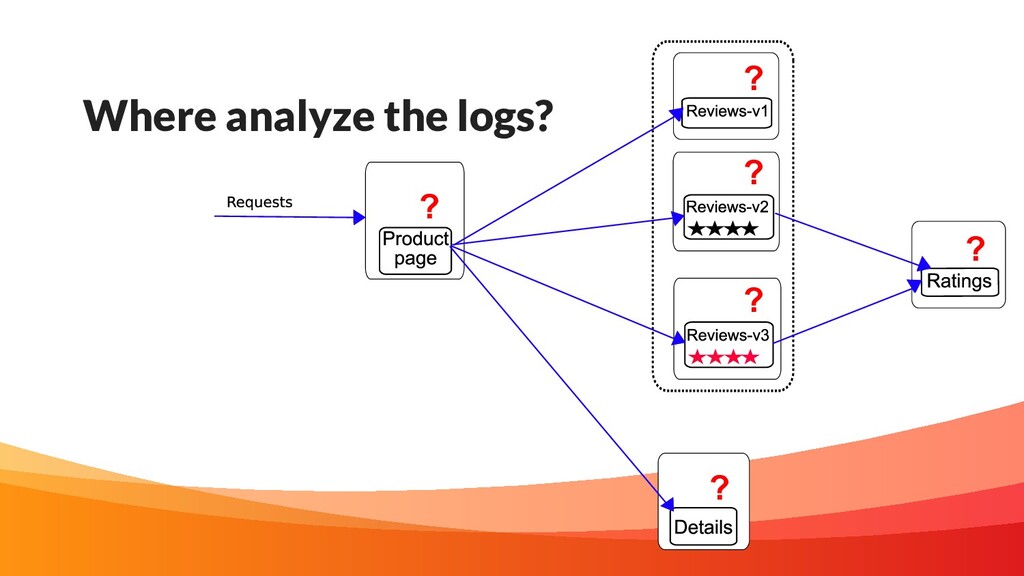
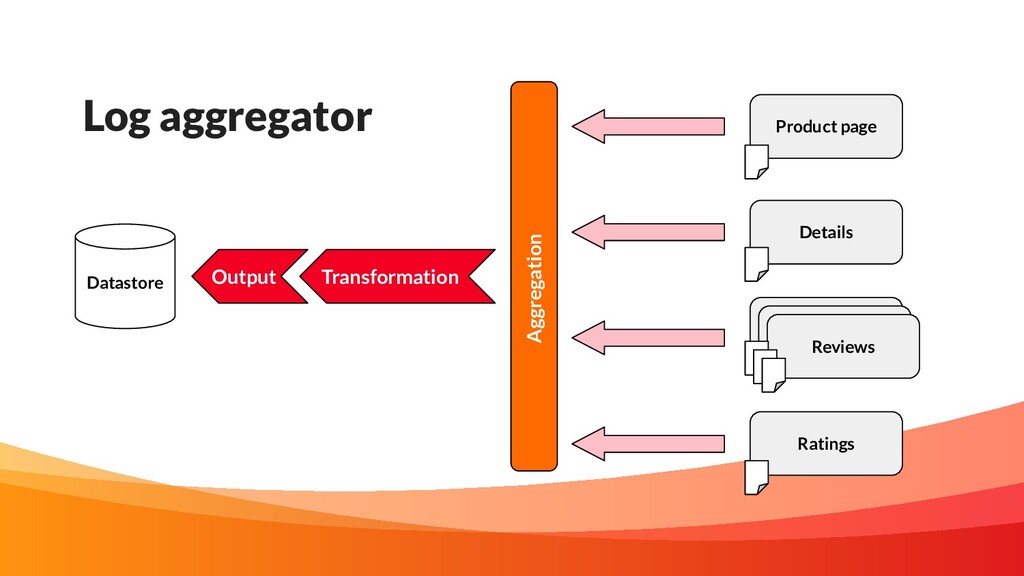
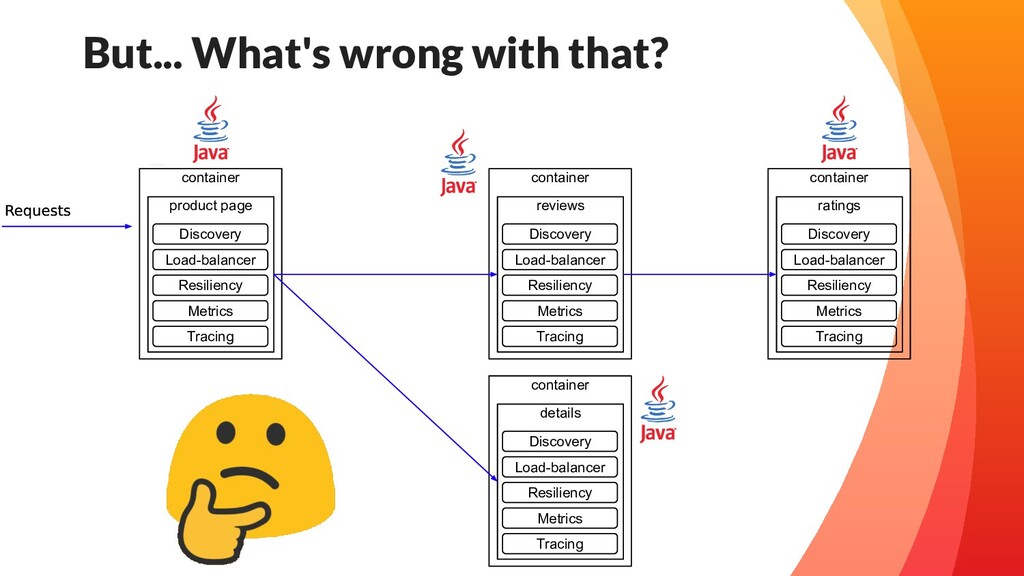
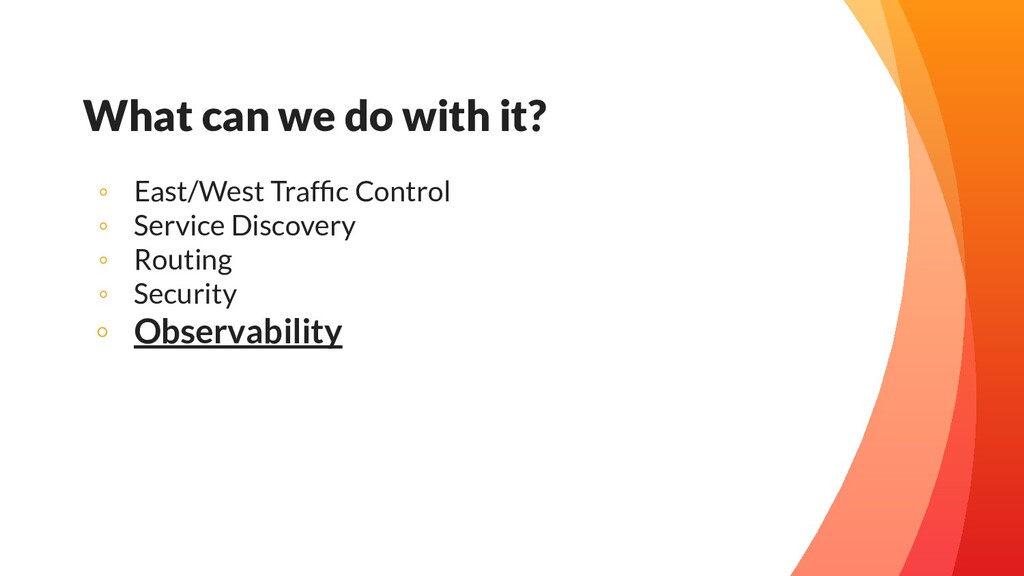
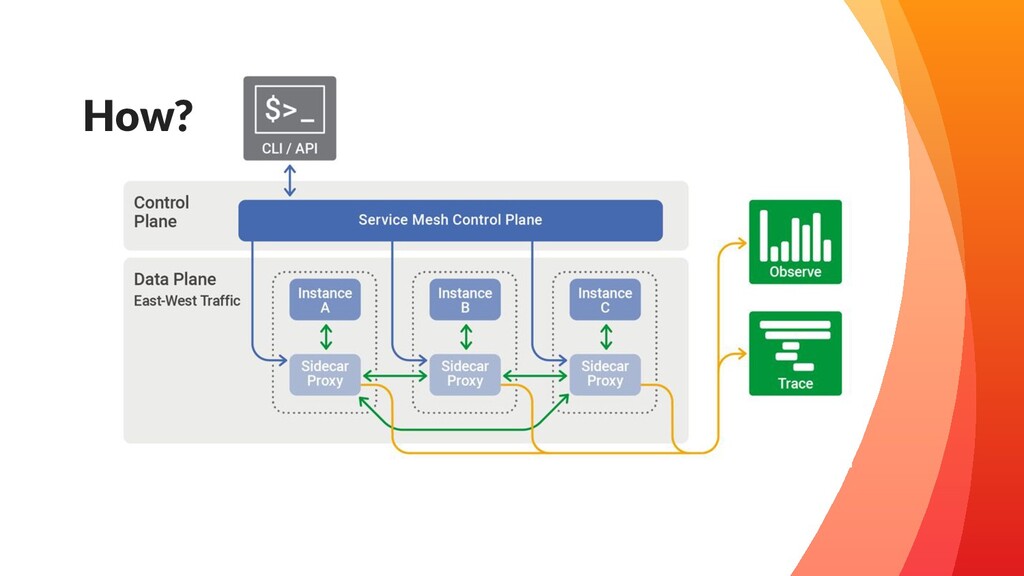
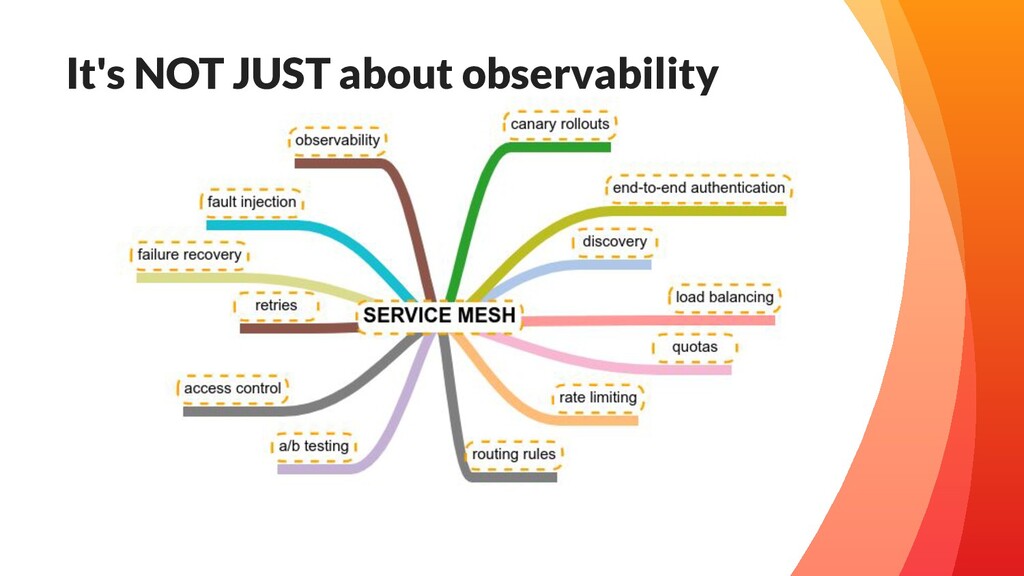
O principal desafio da arquitetura de microservices é a complexidade em visualizar o que acontece no tráfego Leste-Oeste (entre os serviços), principalmente em cenários com erros. Para lidar com esse desafio e ter sucesso na adoção dessa arquitetura, é imprescindível que nosso ecossistema seja observável. O Service Mesh chegou para reduzir a complexidade da arquitetura de microservices, facilitando a implantação de funcionalidades importantes, tais como gerenciamento de tráfego, segurança e, principalmente, observabilidade. Mas nem sempre foi assim. Nesta palestra, vamos abordar os conceitos e fazer demonstrações da implantação de observabilidade antes e depois do Service Mesh.

Avatar for Tiago Angelo

Tiago Angelo

November 30, 2019
Tweet

More Decks by Tiago Angelo

Other Decks in Technology

Transcript

  1. Agenda ◦ Microservices and the fallacies of distributed computing ◦

    Observability ◦ Logs, traces and metrics ◦ How have we been solving this so far? ◦ Service Mesh ◦ Data and Control plane ◦ Istio ◦ Control plane components ◦ Demo
  2. whoami I am Tiago Angelo Software Engineer ➔ microservices ➔

    containers and service mesh ➔ Java ➔ Go
  3. Fallacies of distributed computing ◦ The network is reliable ◦

    Latency is zero ◦ Bandwidth is infinite ◦ The network is secure ◦ Topology doesn't change ◦ There is one administrator ◦ Transport cost is zero ◦ The network is homogeneous
  4. 1 Do I have a problem? Dashboarding, Trending & Problem

    Detection 2 3 Where exactly is my problem? What is causing it? Cross-Service Debug & Performance Optimization Root Cause & Forensics Traces Metrics Logs
  5. Prometheus & Grafana Product page Details Ratings Reviews Reviews Reviews

    GET /metrics GET /metrics GET /metrics GET /metrics • Scrapping; • Storage; • Service Discovery; • Alerts; • Dashboards. • Beautiful Visualizations; • Alerts.
  6. Just by adding the Spring dependency: Spring Actuator & Micrometer

    We automatically gain production ready endpoints: ◦ /actuator/health ◦ /actuator/info ◦ /actuator/metrics ◦ /actuator/trace ◦ /actuator/prometheus
  7. ? ? ? ? ? ? ? ? ? Where

    exactly is my problem?
  8. Just by adding the Spring dependency: Spring Cloud Sleuth We

    automatically gain: ◦ trace and span instrumentation; ◦ logging; ◦ send traces to the distributed tracing system.
  9. [INFO][2019-10-10 00:51:48][de4c1b04-9ca1][c.s.domain.service.ProductService] - finding product details by id 140708 [WARN][2019-10-10

    00:52:02][de4c1b04-9ca1][c.s.domain.service.ProductService] - product details non-cached, calling details service [ERROR][2019-10-10 00:52:03][de4c1b04-9ca1][c.s.domain.service.ProductService] - error when calling /details/140708 org.springframework.web.server.ResponseStatusException: 404 NOT_FOUND
  10. container Discovery Load-balancer Resiliency Metrics Tracing reviews container Discovery Load-balancer

    Resiliency Metrics Tracing product page container Discovery Load-balancer Resiliency Metrics Tracing details container Discovery Load-balancer Resiliency Metrics Tracing ratings But... What's wrong with that?
  11. ◦ East/West Traffic Control ◦ Service Discovery ◦ Routing ◦

    Security ◦ Observability What can we do with it?
  12. Thanks! Any questions? You can find us at: mfariam matheusfm

    matheusfm kurtisangelo angelokurtis tiagoangelo angelokurtis/gcp-mesh-infrastructure angelokurtis/istio-bookinfo