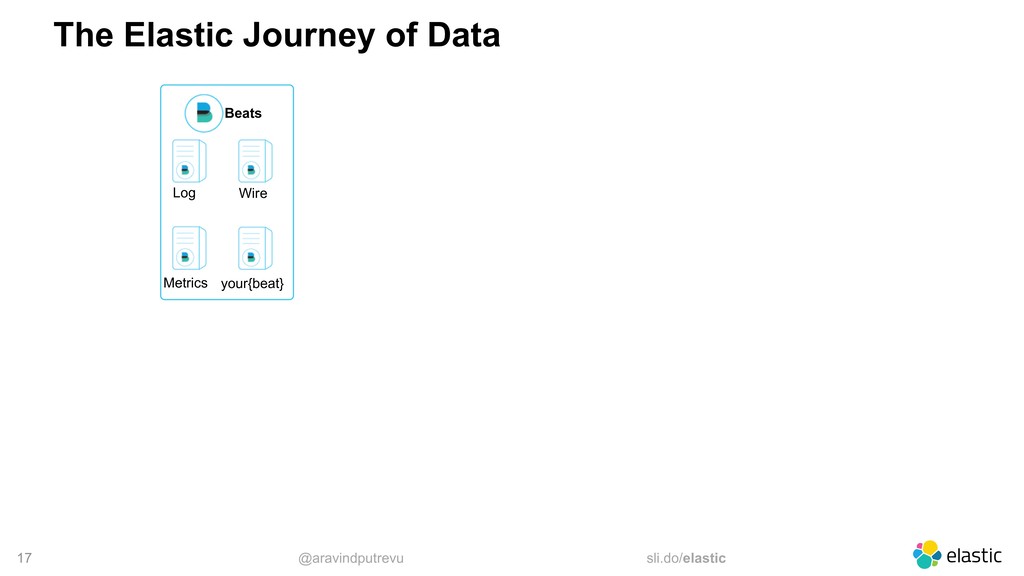
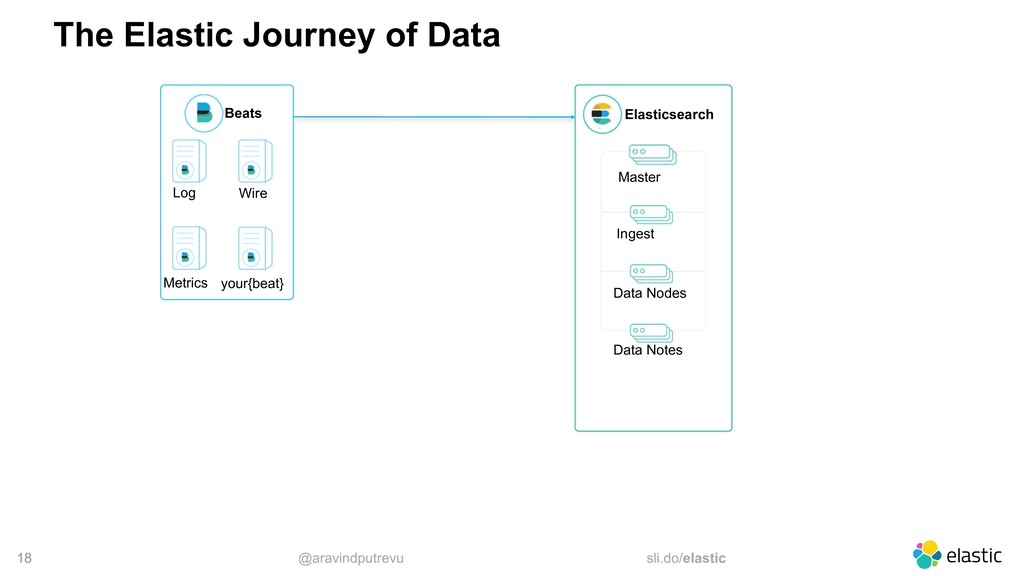
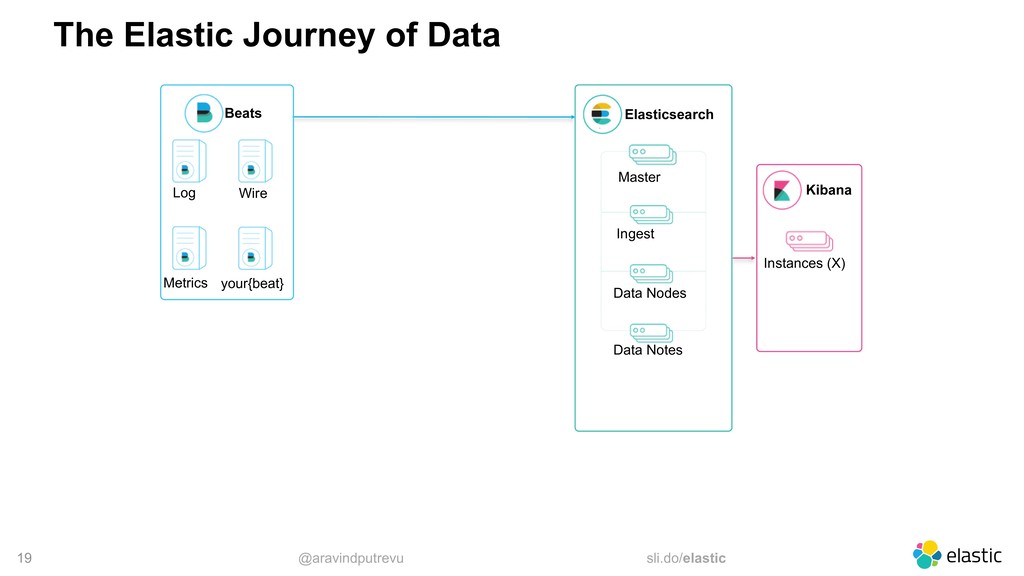
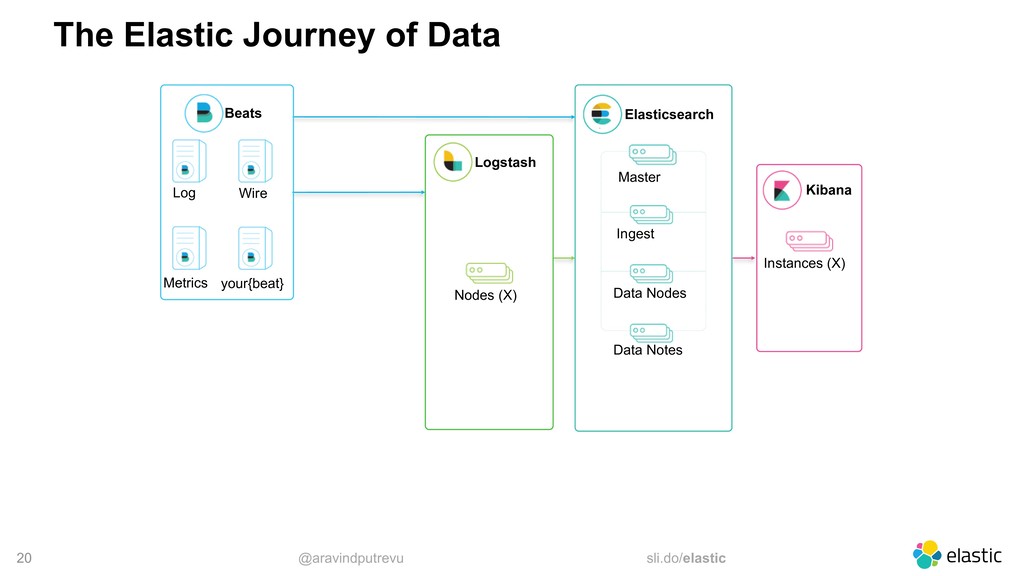
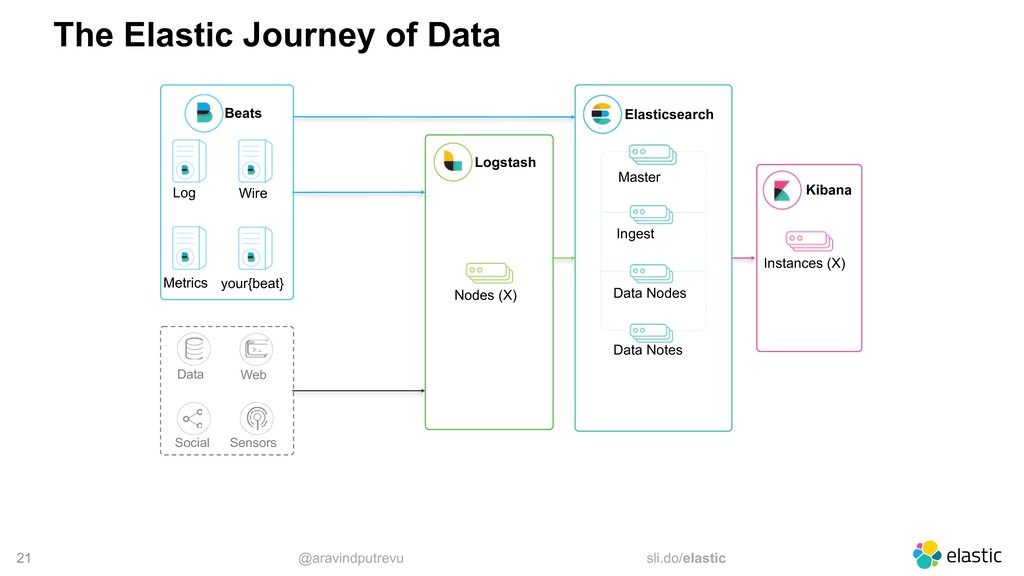
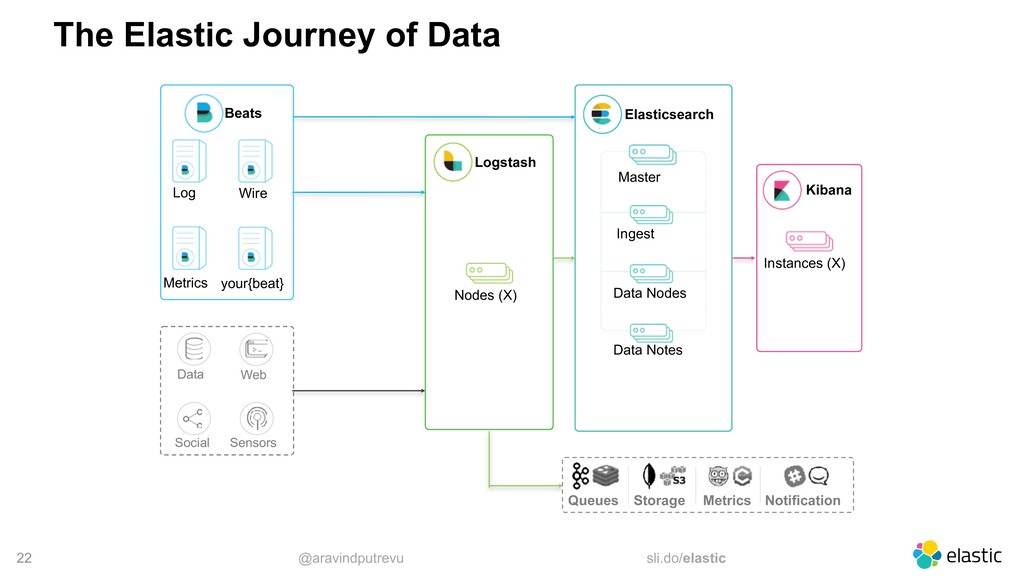
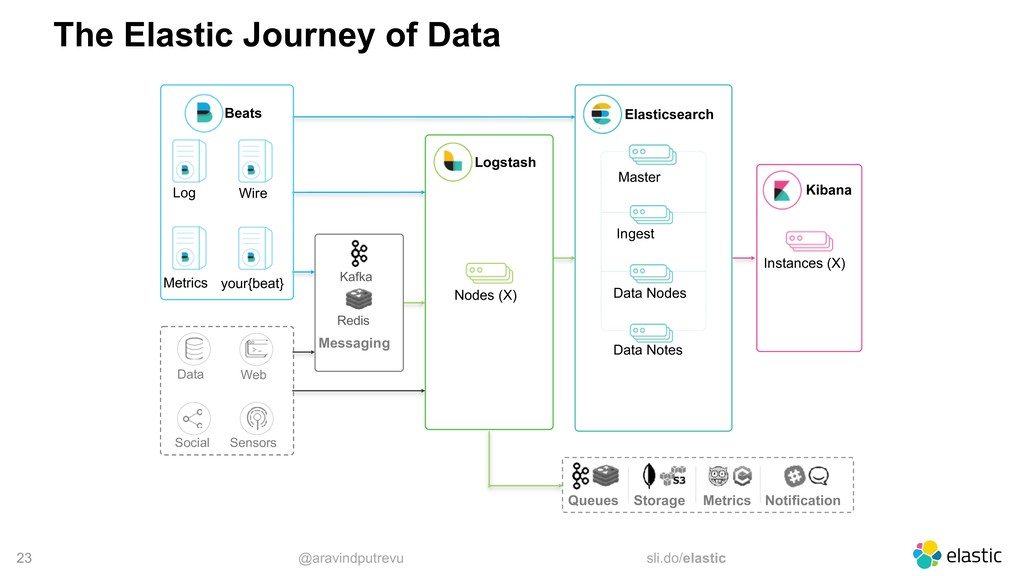
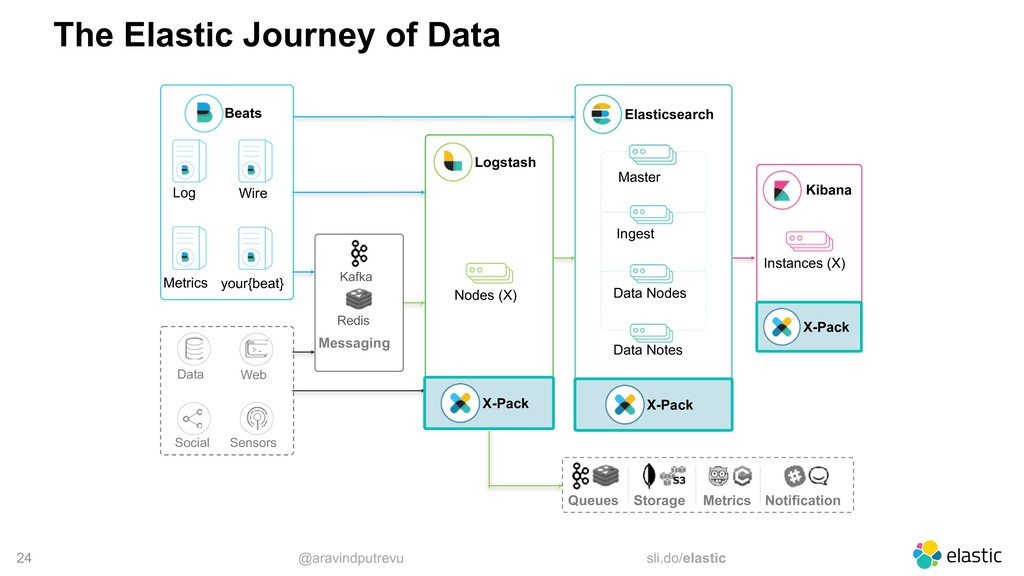
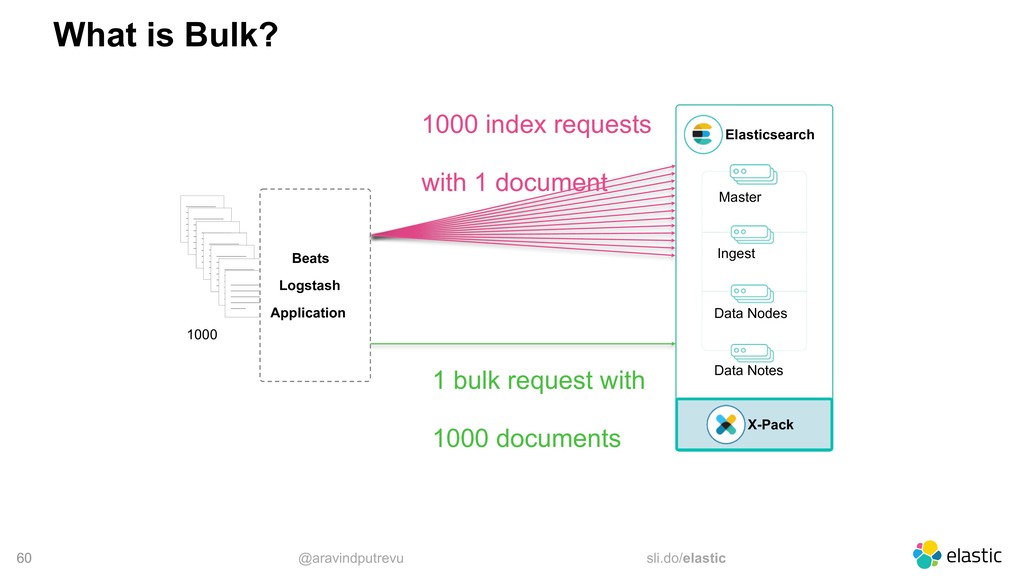
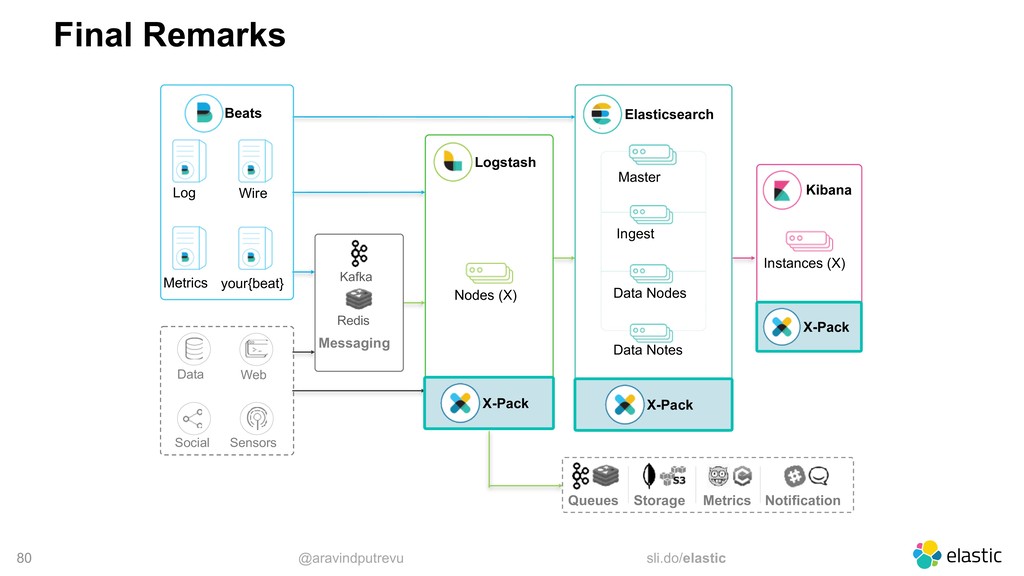
Metrics Wire your{beat} Data Web Social Sensors Elasticsearch Master Ingest Data Nodes Data Notes Logstash Nodes (X) Kibana Instances (X) Notification Queues Storage Metrics
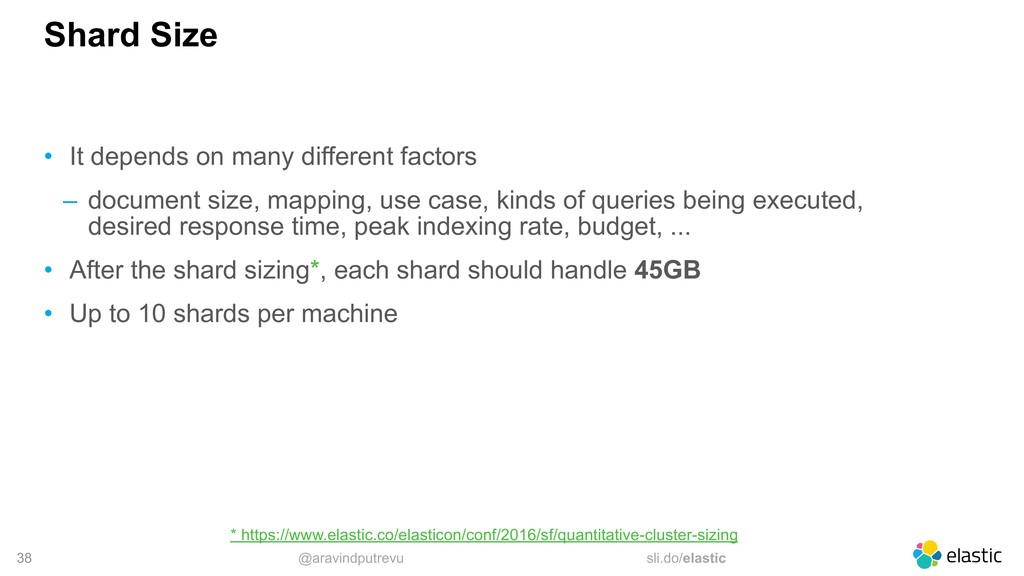
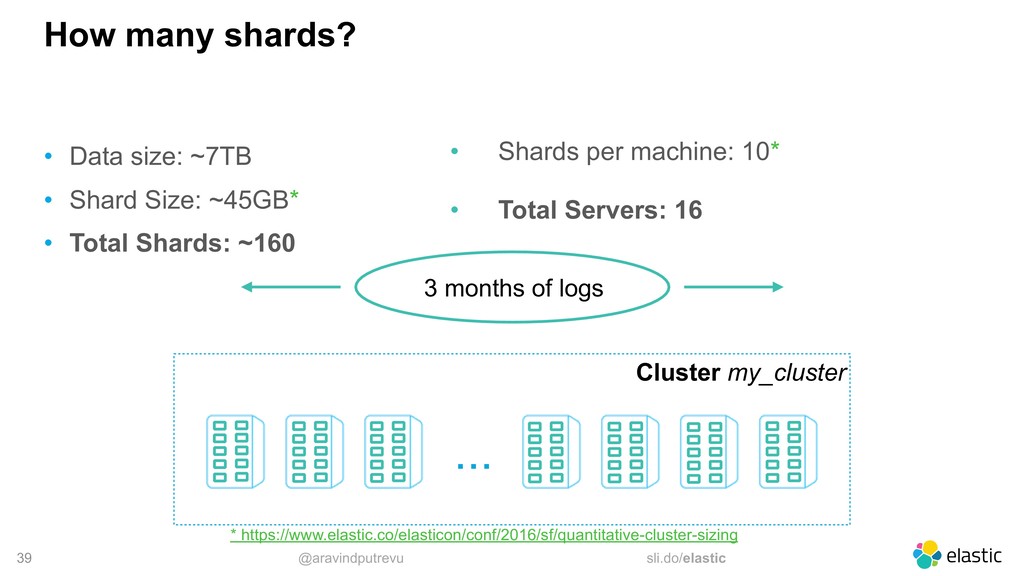
different factors ‒ document size, mapping, use case, kinds of queries being executed, desired response time, peak indexing rate, budget, ... • After the shard sizing*, each shard should handle 45GB • Up to 10 shards per machine * https://www.elastic.co/elasticon/conf/2016/sf/quantitative-cluster-sizing
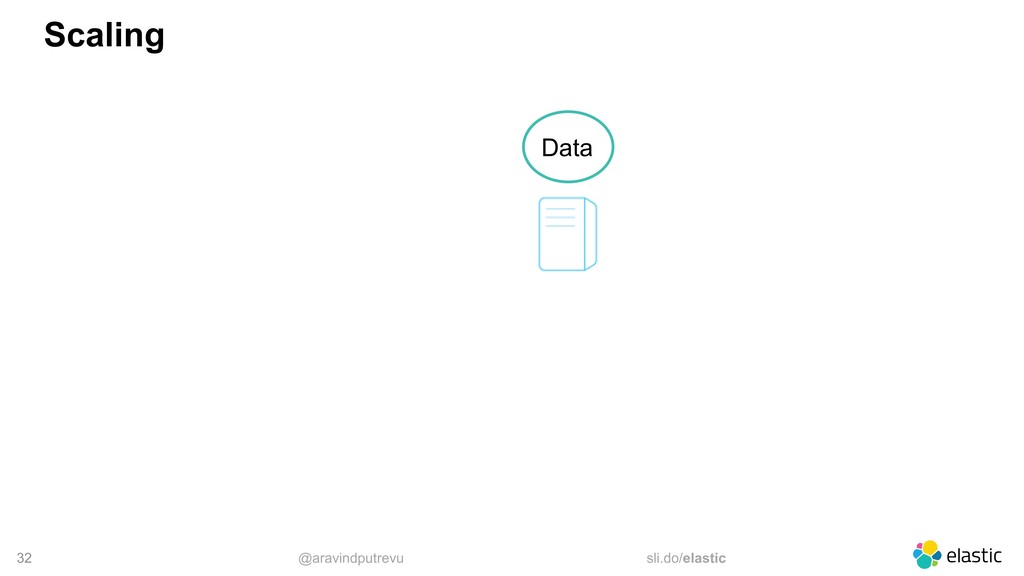
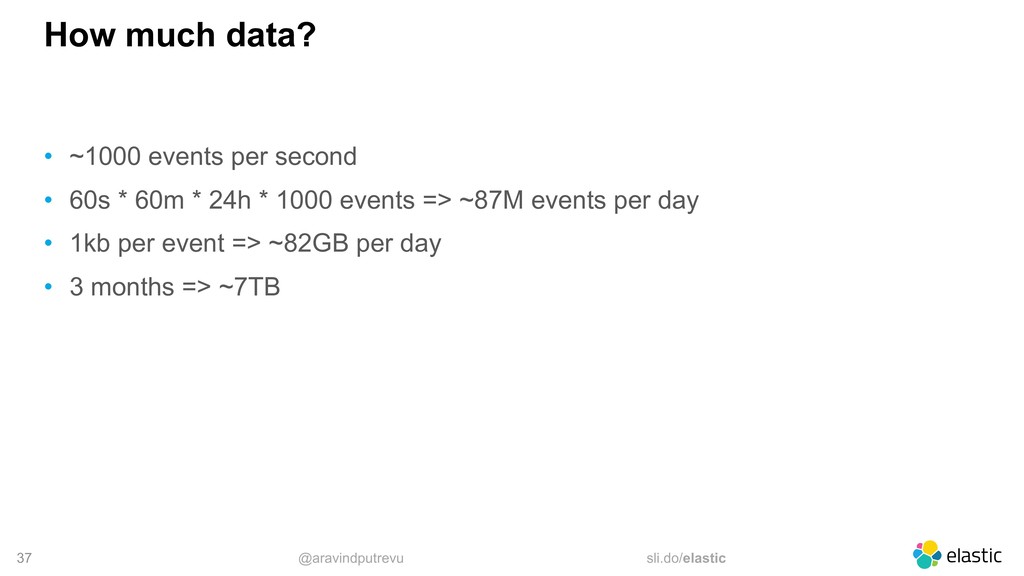
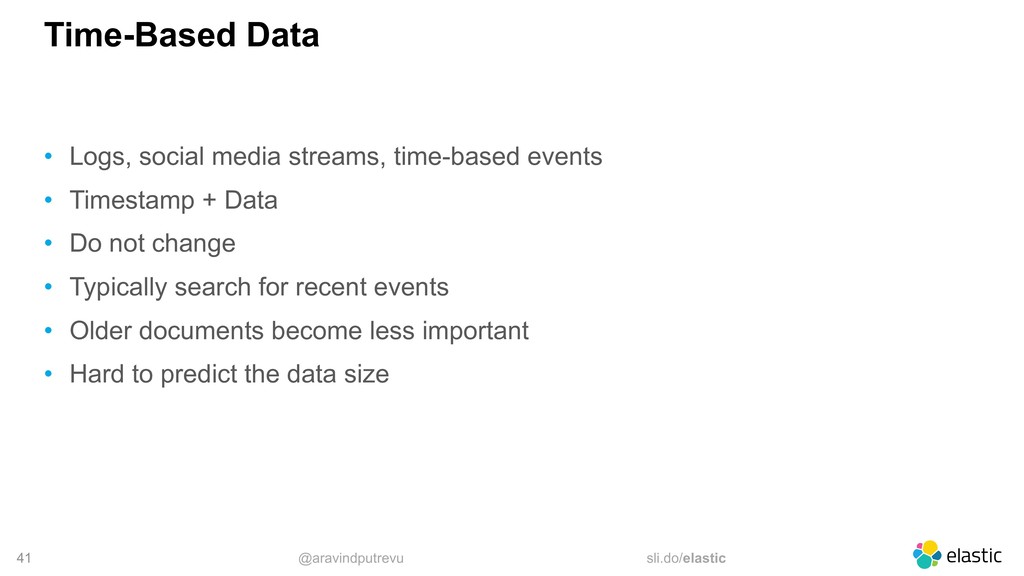
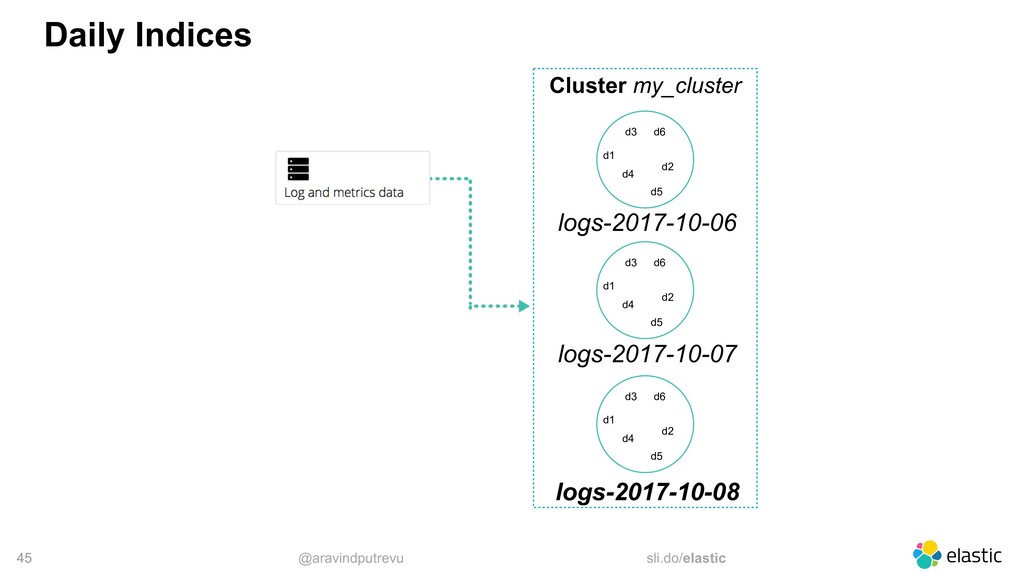
time-based events • Timestamp + Data • Do not change • Typically search for recent events • Older documents become less important • Hard to predict the data size
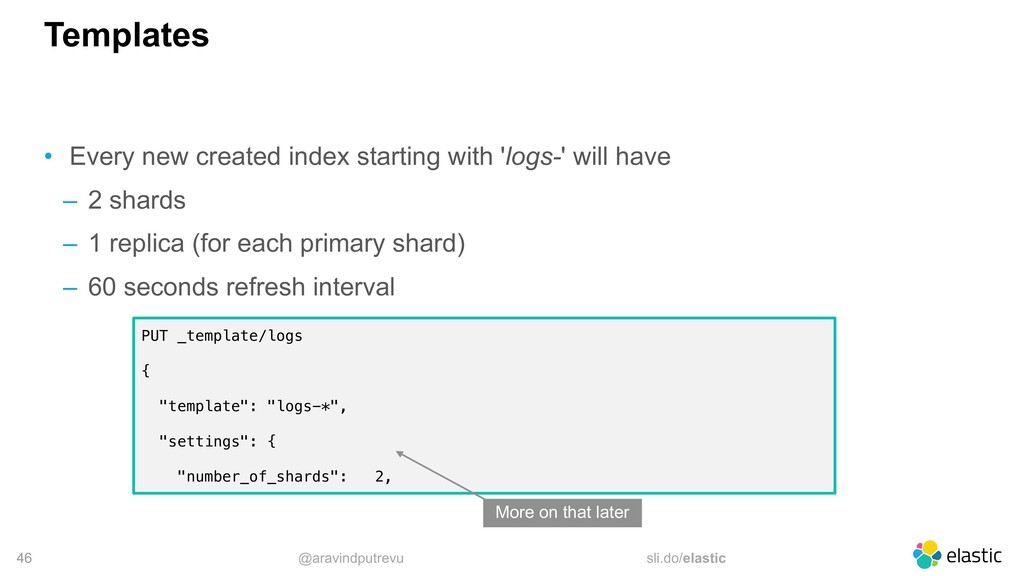
with 'logs-' will have ‒ 2 shards ‒ 1 replica (for each primary shard) ‒ 60 seconds refresh interval PUT _template/logs { "template": "logs-*", "settings": { "number_of_shards": 2, More on that later
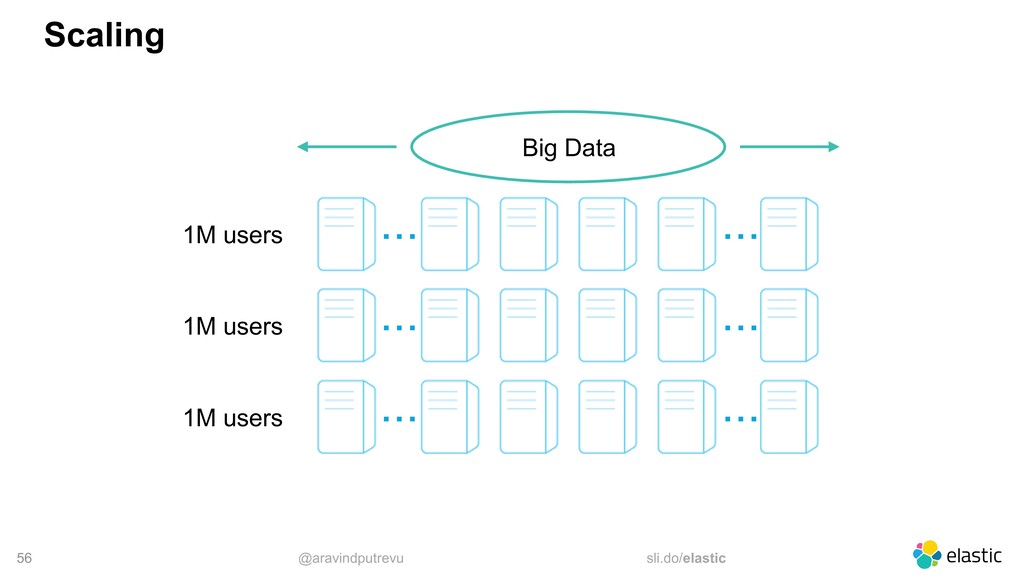
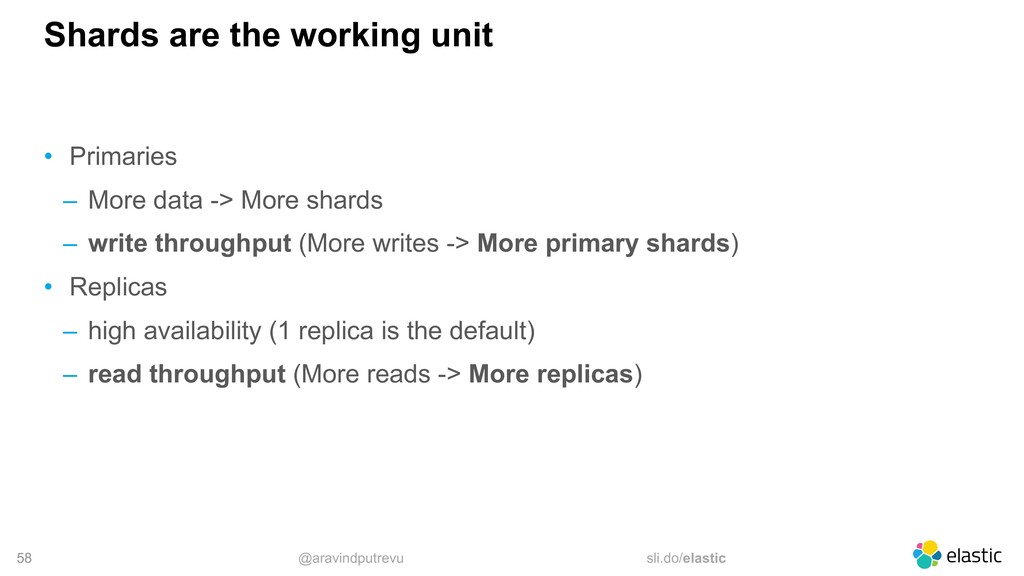
‒ More data -> More shards ‒ write throughput (More writes -> More primary shards) • Replicas ‒ high availability (1 replica is the default) ‒ read throughput (More reads -> More replicas)
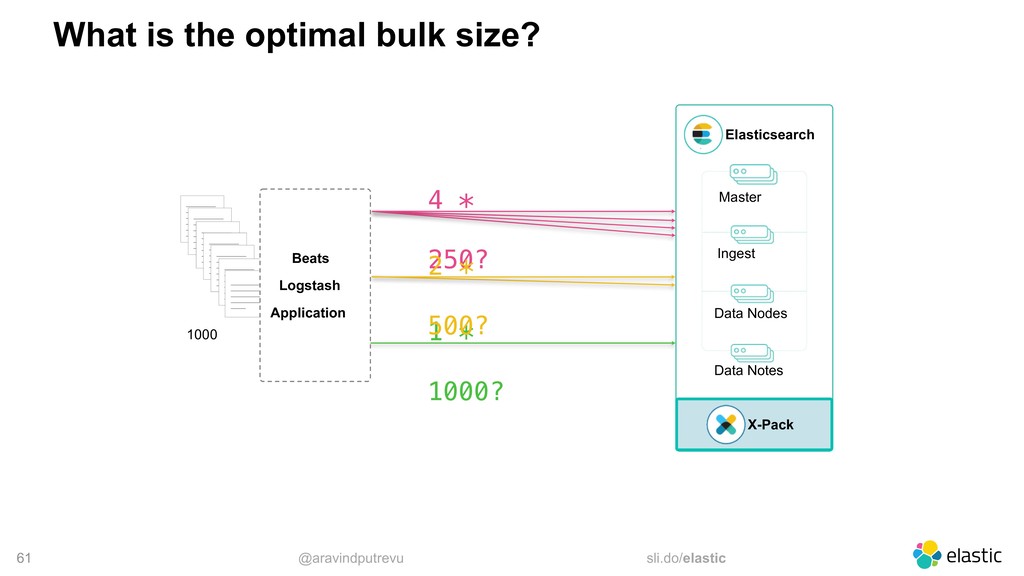
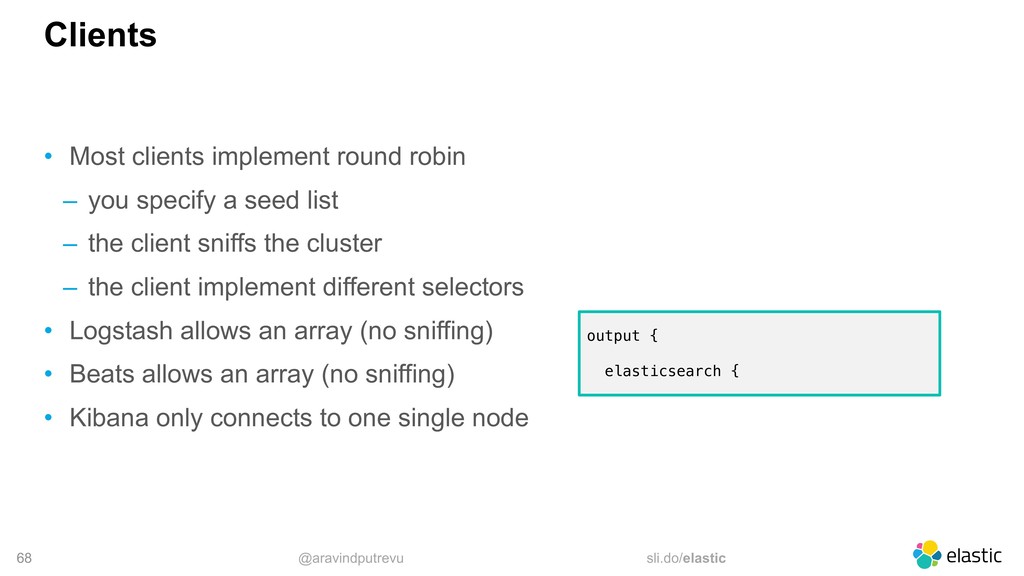
‒ you specify a seed list ‒ the client sniffs the cluster ‒ the client implement different selectors • Logstash allows an array (no sniffing) • Beats allows an array (no sniffing) • Kibana only connects to one single node output { elasticsearch {
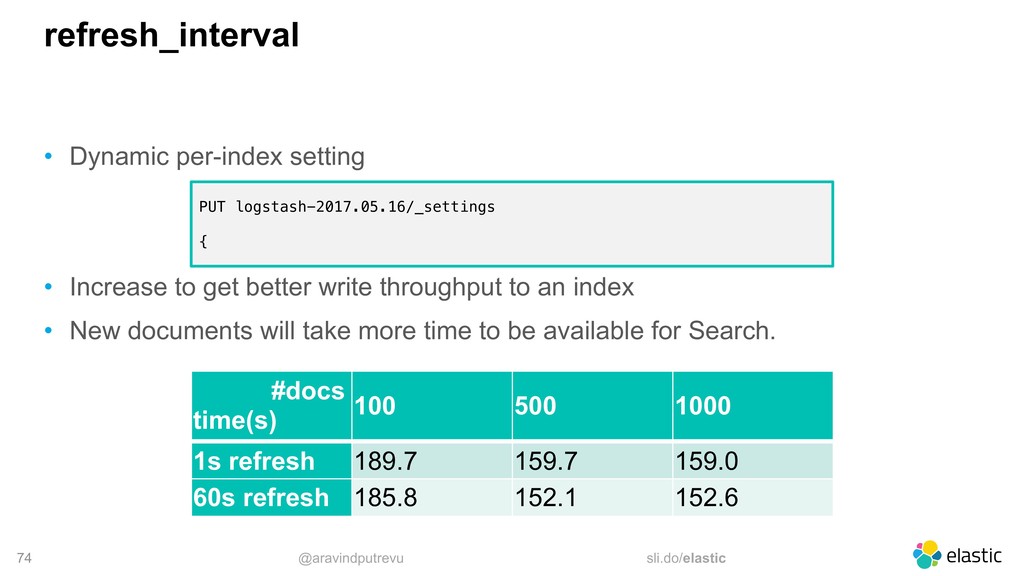
to get better write throughput to an index • New documents will take more time to be available for Search. PUT logstash-2017.05.16/_settings { #docs time(s) 100 500 1000 1s refresh 189.7 159.7 159.0 60s refresh 185.8 152.1 152.6
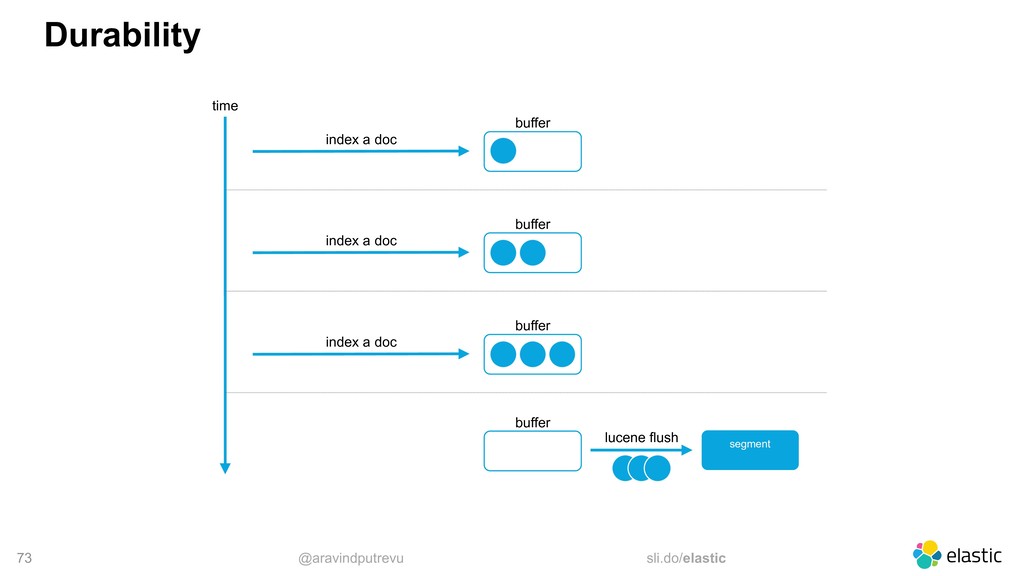
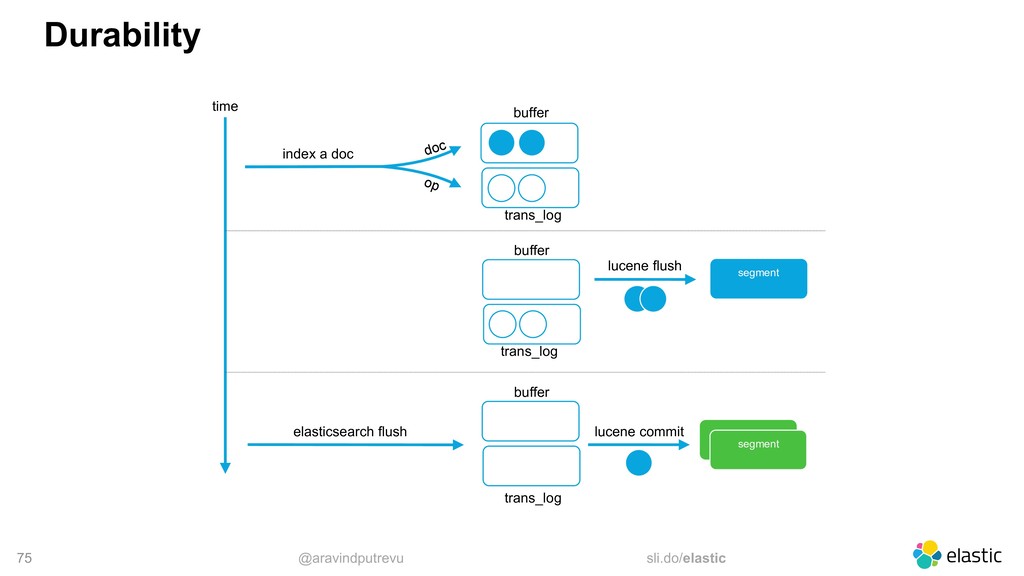
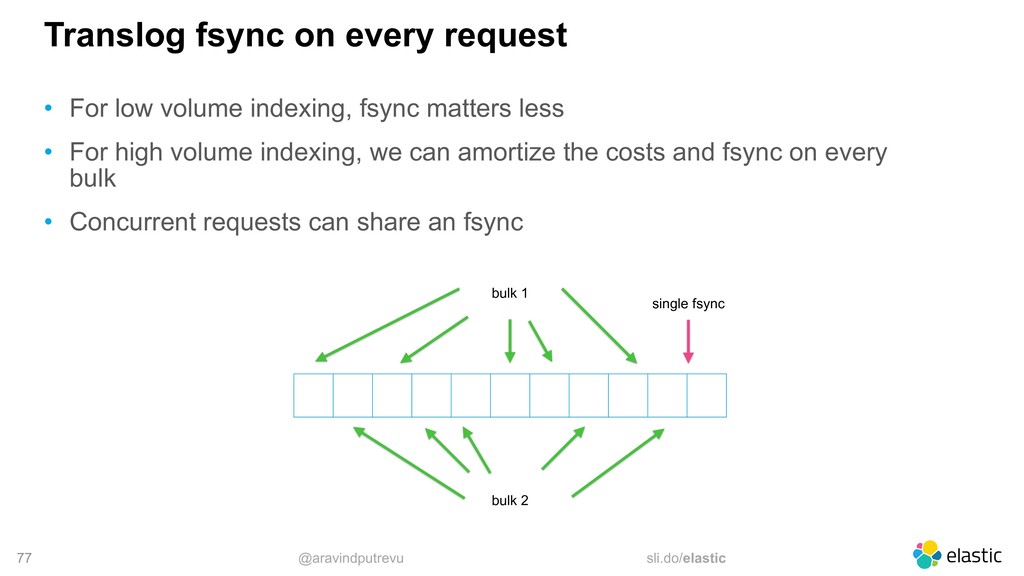
low volume indexing, fsync matters less • For high volume indexing, we can amortize the costs and fsync on every bulk • Concurrent requests can share an fsync bulk 1 bulk 2 single fsync
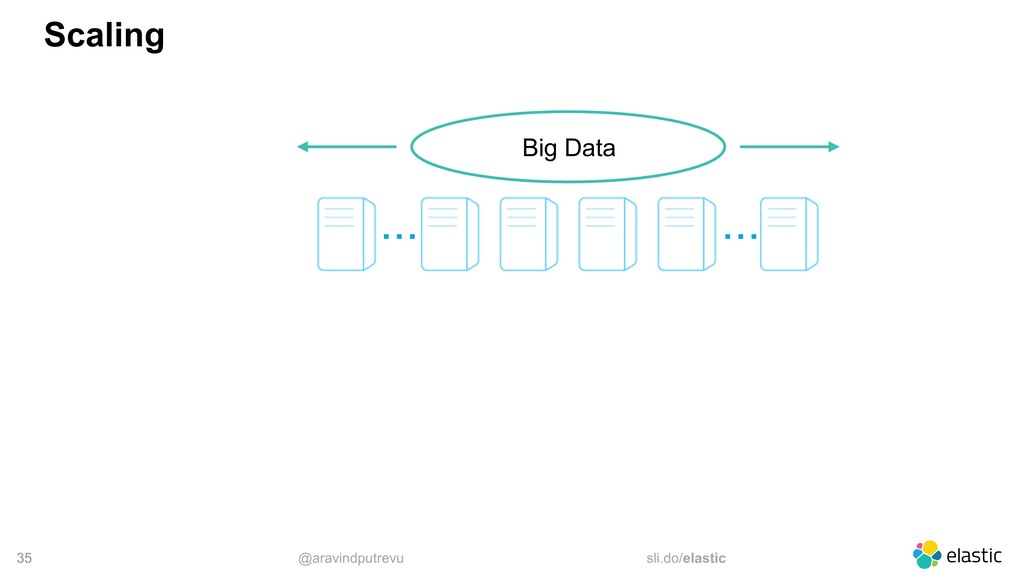
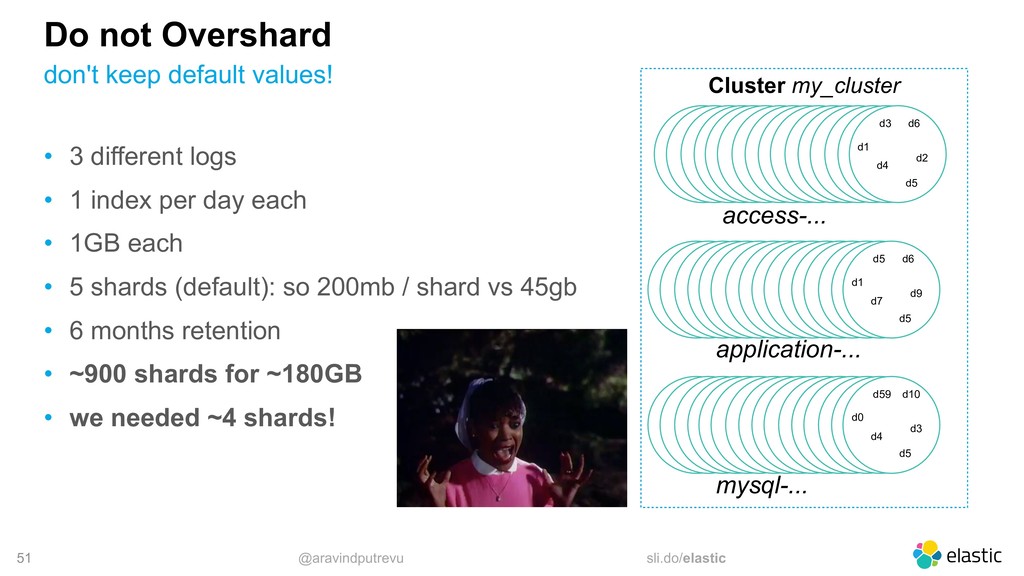
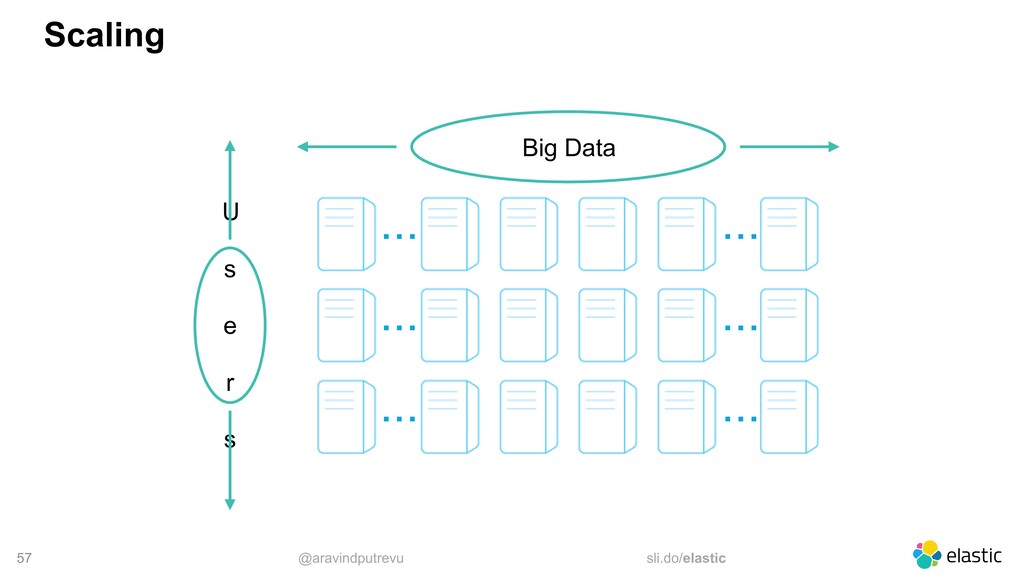
-> More shards ‒ Do not overshard! • Replicas ‒ high availability (1 replica is the default) ‒ read throughput (More reads -> More replicas) Big Data ... ... ... ... ... ... U s e