Upgrade to Pro — share decks privately, control downloads, hide ads and more …

Monitoring your {X} with Elastic Stack

Monitoring your {X} with Elastic Stack

Aravind Putrevu

October 17, 2018
Tweet

More Decks by Aravind Putrevu

Other Decks in Technology

Transcript

  1. 2 2 Agenda Why Monitoring? 1 Beats : Lightweight data

    shipper framework 3 Monitor All things with Beats 4 Demo 5 Why Elastic Stack? 2
  2. 3 3 Agenda Why Monitoring? 1 Beats : Lightweight data

    shipper framework 3 Monitor All things with Beats 4 Demo 5 Why Elastic Stack? 2
  3. 4 4 Agenda Why Monitoring? 1 Beats : Lightweight data

    shipper framework 3 Monitor All things with Beats 4 Demo 5 Why Elastic Stack? 2
  4. 5 5 Agenda Why Monitoring? 1 Beats : Lightweight data

    shipper framework 3 Monitor All things with Beats 4 Demo 5 Why Elastic Stack? 2
  5. 6 6 Agenda Why Monitoring? 1 Beats : Lightweight data

    shipper framework 3 Monitor All things with Beats 4 Demo 5 Why Elastic Stack? 2
  6. 7 Elastic Stack No enterprise edition All new versions with

    6.3 X-Pack Security Alerting Monitoring Reporting Machine Learning Graph
  7. 1 1 \ LOG ANALYTICS METRICS ANALYTICS BUSINESS ANALYTICS SEARCH

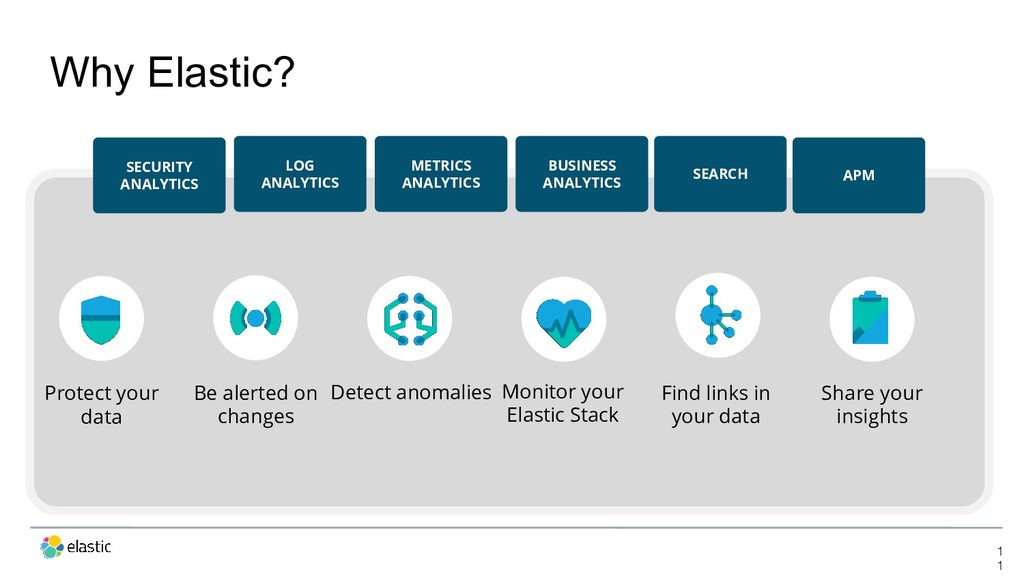
    SECURITY ANALYTICS Monitor your Elastic Stack Find links in your data Be alerted on changes Protect your data Share your insights Detect anomalies APM Why Elastic?
  8. Beats Log Files Metrics Wire Data Datastore Web APIs Social

    Sensors Kafka Redis Messaging Queue ES-Hadoop Elasticsearch Kibana Master Nodes (3) Ingest Nodes (X) Data Nodes – Hot (X) Data Notes – Warm (X) Instances (X) your{beat} X-Pack X-Pack Custom UI LDAP Authentication AD Notification SSO Hadoop Ecosystem Logstash Nodes (X)
  9. Logstash Nodes (X) Datastore Web APIs Social Sensors Kafka Redis

    Messaging Queue ES-Hadoop Elasticsearch Kibana Master Nodes (3) Ingest Nodes (X) Data Nodes – Hot (X) Data Notes – Warm (X) Instances (X) X-Pack X-Pack Custom UI LDAP Authentication AD Notification SSO Hadoop Ecosystem Beats Log Files Metrics Wire Data your{beat}
  10. 14 Beats Lightweight data shippers Ship data from the source

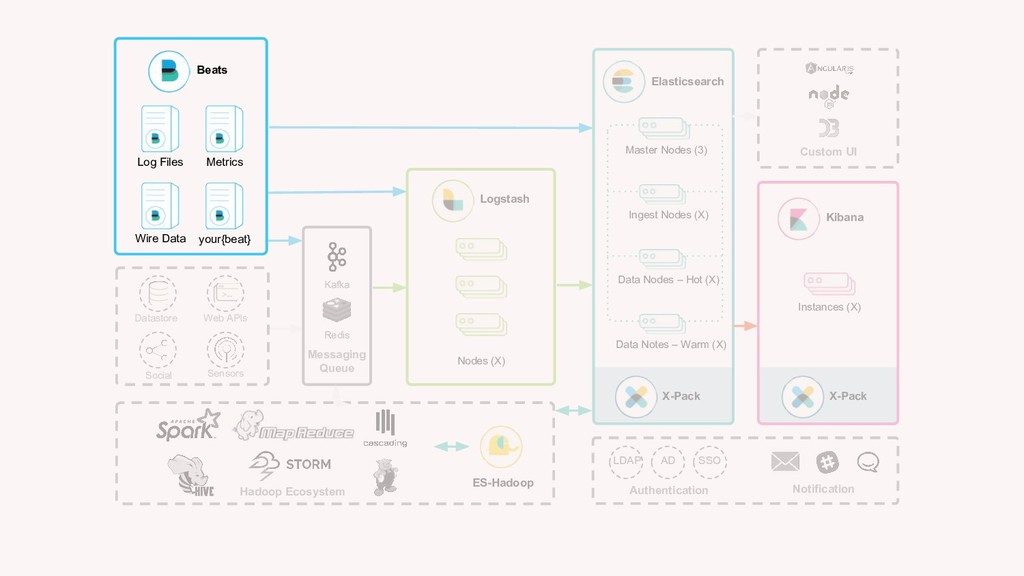
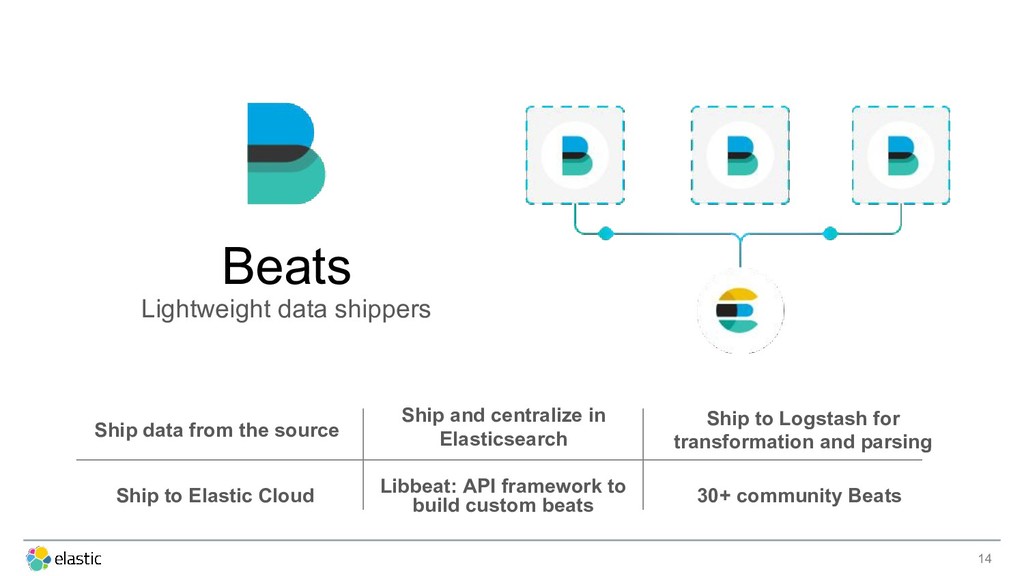
    Ship and centralize in Elasticsearch Ship to Logstash for transformation and parsing Ship to Elastic Cloud Libbeat: API framework to build custom beats 30+ community Beats
  11. 15 The Beats family Heartbeat Uptime monitoring Filebeat Log files

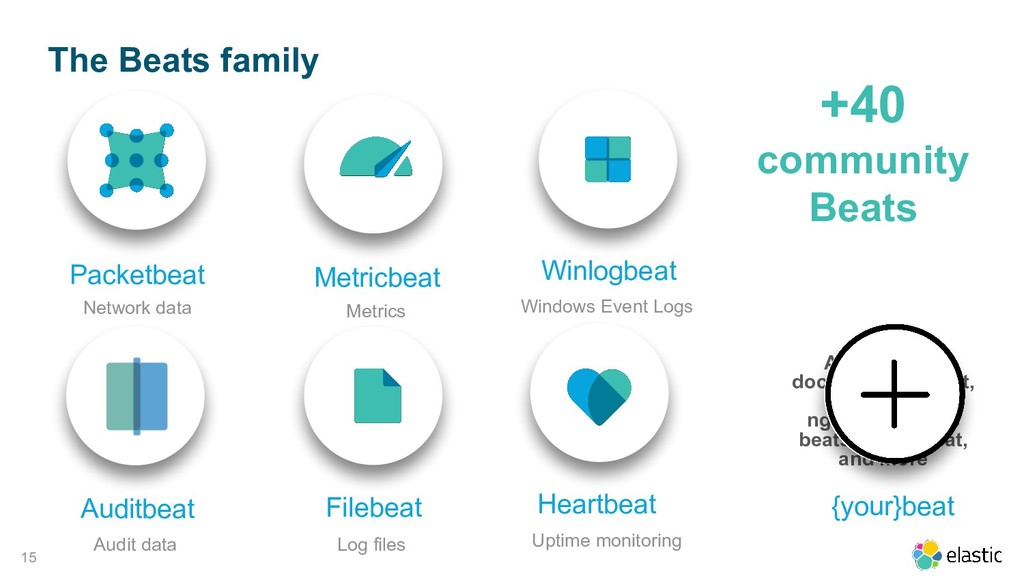
    Winlogbeat Windows Event Logs Packetbeat Network data +40 community Beats Metricbeat Metrics Auditbeat Audit data Apachebeat, dockbeat, httpbeat, mysqlbeat, nginxbeat, redis beats, twitterbeat, and more {your}beat
  12. Logstash vs Beats 16 • Beats are lightweight data shippers

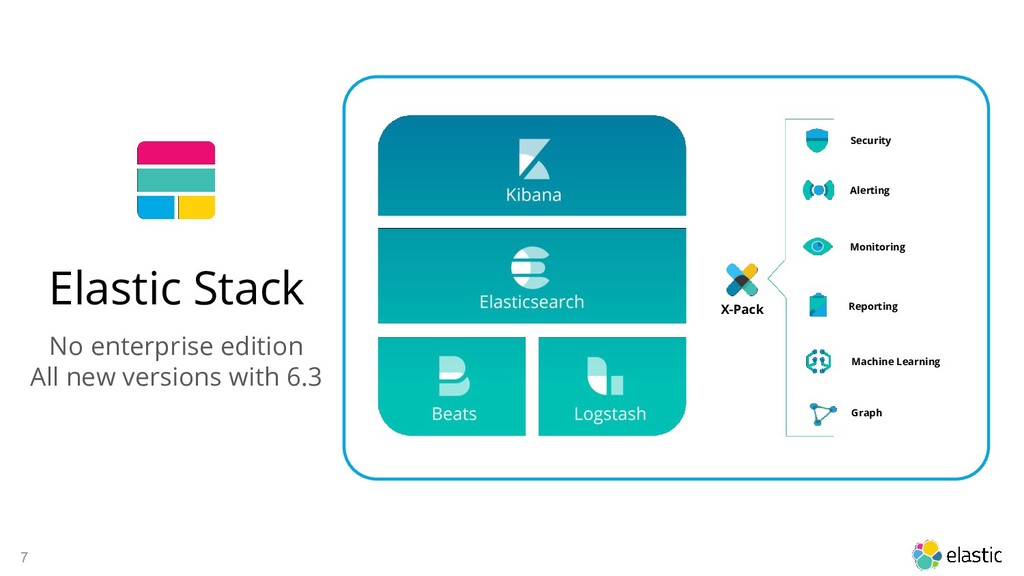
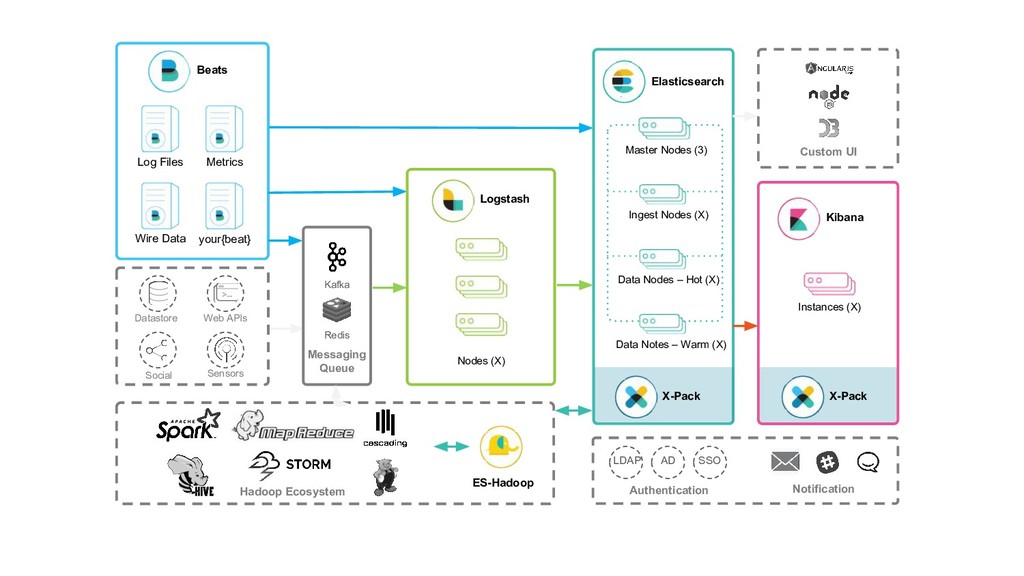
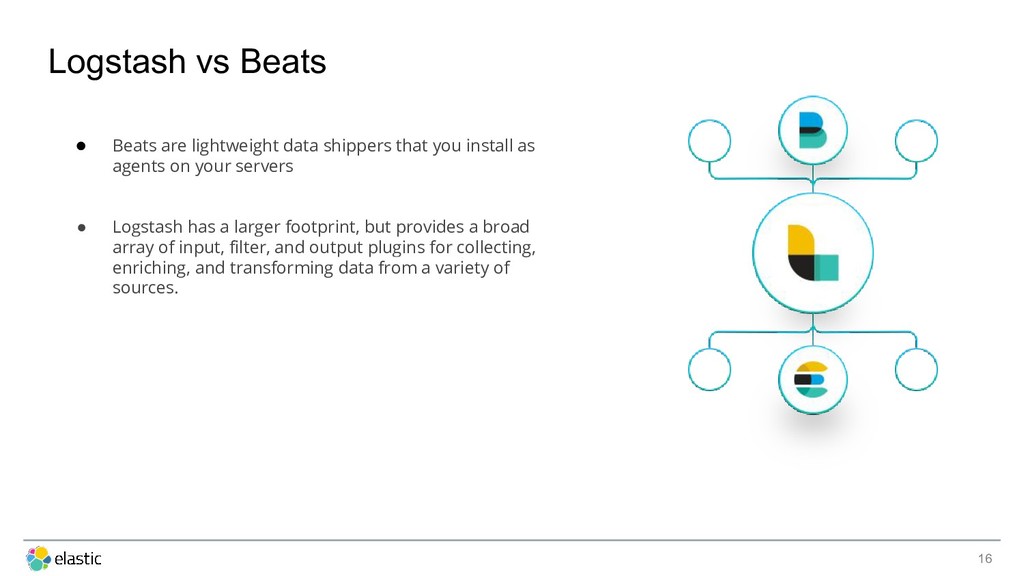
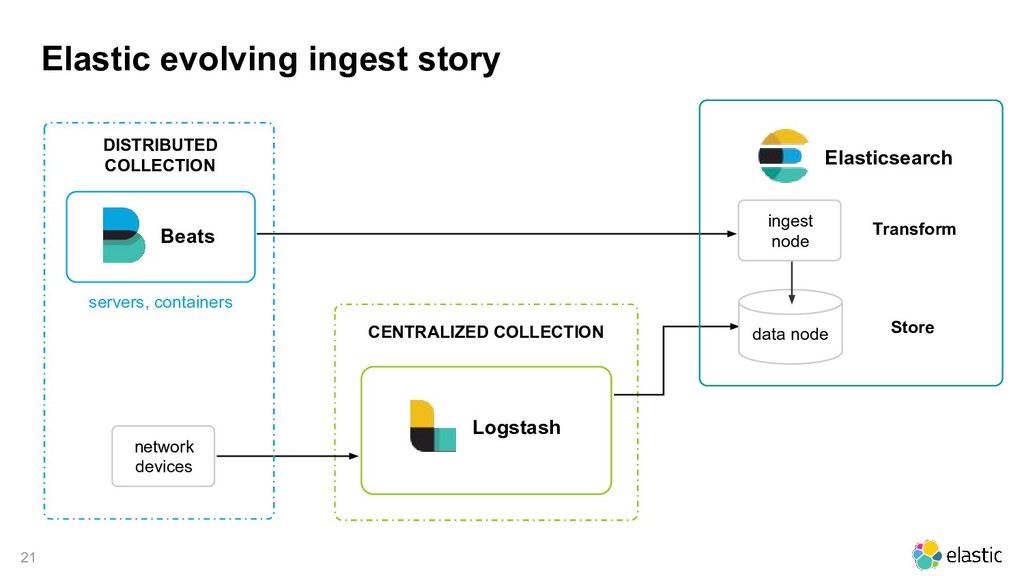
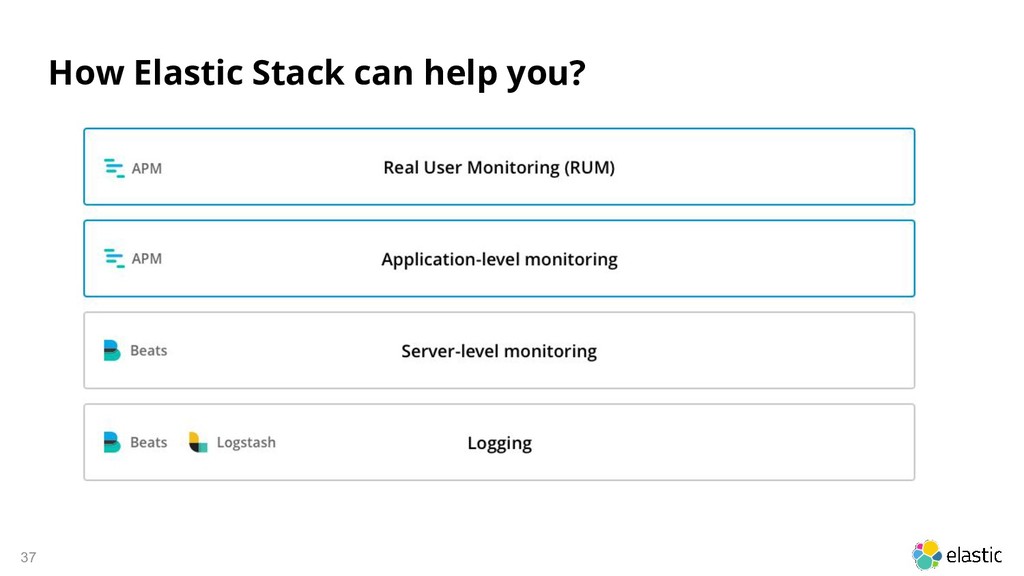
    that you install as agents on your servers • Logstash has a larger footprint, but provides a broad array of input, filter, and output plugins for collecting, enriching, and transforming data from a variety of sources.
  13. How beats work? 17 Log Files Metrics Wire Data your{beat}

    Beats Framework libbeat • Small application • Install as agent on your servers • Written in Golang • No runtime dependencies • Single purpose
  14. 21 CENTRALIZED COLLECTION Logstash Elasticsearch Transform Store ingest node data

    node network devices DISTRIBUTED COLLECTION Beats servers, containers Elastic evolving ingest story
  15. 22 Immediate insights with modules • Turnkey experience for specific

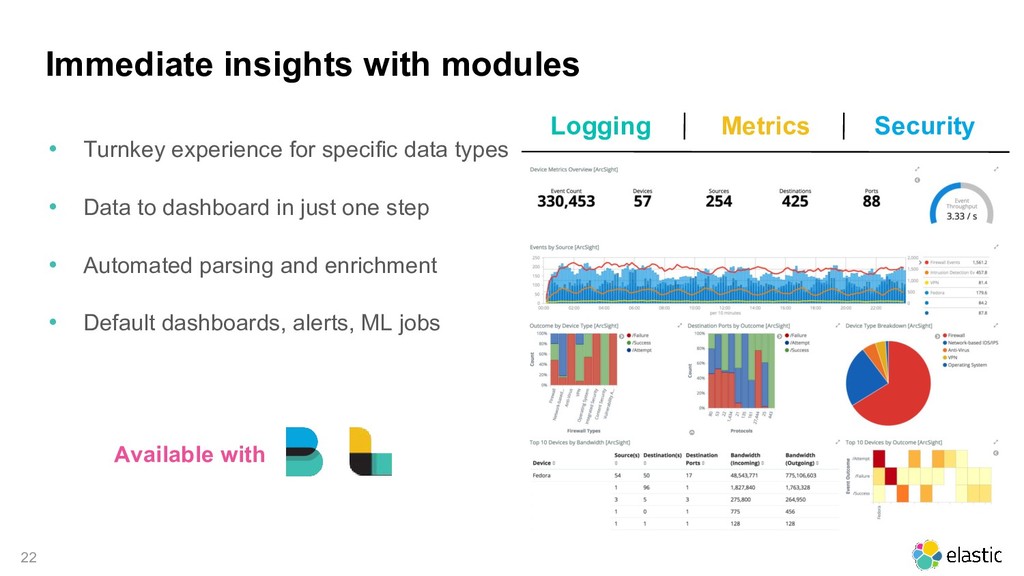
    data types • Data to dashboard in just one step • Automated parsing and enrichment • Default dashboards, alerts, ML jobs Logging Metrics Security Available with
  16. 23 Logging modules System • Linux / MacOS • Windows

    Events Containers • Docker • Kubernetes Infrastructure Applications Databases • MySQL • PostgreSQL Queues • Kafka • Redis Web servers • Apache • Nginx Audit data • Filesystem • System calls WINLOGBEAT FILEBEAT AUDITBEAT
  17. 24 Metrics modules System • Linux • MacOS • Windows

    • Perfmon Infrastructure Cloud • AWS • Azure • DigitalOcean • GCP Containers • Docker • Kubernetes Virtualization • vSphere PACKETBEAT METRICBEAT Network • Netflow • Packets • TLS Envelope Storage • Ceph LOGSTASH
  18. 25 Metrics modules Applications Datastores • MySQL • PostgreSQL •

    MongoDB • Couchbase • Aerospike • Graphite Web servers • Apache • Nginx Other • HAProxy • Zookeeper Queues • Kafka • Redis • RabbitMQ Caches • Memcached Uptime • Heartbeat Custom apps • JMX/Jolokia • PHP-FPM • Golang PACKETBEAT METRICBEAT LOGSTASH HEARTBEAT
  19. 26 26 We need specific tools to track things down

    With containers architecture, everything is a moving target
  20. 27 volume mounts volume mounts Docker deployment Kibana Elasticsearch docker

    host Log files (/var/lib/docker/containers) Web Apps Services Docker API ... Networking Filebeat Metricbeat /proc filesystem
  21. 28 Kubernetes deployment Node 1 Metricbeat Filebeat Node 2 Metricbeat

    Filebeat Node n Metricbeat Filebeat Filebeat DaemonSet Metricbeat DaemonSet
  22. 29 Docker logs input filebeat.prospectors: - type: docker containers.ids: -

    ‘*’ Parse and ship /var/lib/docker/containers/*/*.log: {"log":"INFO elasticsearch/client.go:145 Elasticsearch url:http://elasticsearch:9200\r\n","stream":"stdout","t ime":"2018-02-11T23:29:19.236692181Z"} Retrieve logs from Docker containers
  23. 30 Metadata processors Enrich events with useful metadata to correlate

    logs, metrics & traces • cloud.region • cloud.instance_id • cloud.machine_type • cloud.provider • docker.container.id • docker.container.image • docker.container.name • docker.container.labels • kubernetes.pod.name • kubernetes.namespace • kubernetes.labels • kubernetes.annotations • kubernetes.container.name • kubernetes.container.image add_cloud_metadata add_docker_metadata add_kubernetes_metadata
  24. 31 Metadata processors Example { "@timestamp": "2017-11-17T00:53:33.759Z", "message": "2017/11/07 00:53:32.804991

    client.go:651: INFO Connected to Elasticsearch version 6.0.0", "kubernetes": { "pod": { "name": "filebeat-vqf85" }, "container": { "name": "filebeat" }, "namespace": "kube-system", "labels": { "k8s-app": "filebeat", "kubernetes.io/cluster-service": "true" } }, "meta": { "cloud": { "instance_id": "1234567", "provider": "digitalocean", "region": "blr1" } }, }
  25. 32 Metadata processors add_kubernetes_metadata internals API Server add_kubernetes_metadata pod watcher

    Pod start/stop events Docker Logs Cont. ID Metadata update 418a913c7076 ……………… c626cfdf38614 ……………… e5563a7cb80e ……………… 73de79be045c ……………... Elasticsearch Parse Enrich
  26. 33 Autodiscover metricbeat.autodiscover: providers: - type: docker templates: - condition:

    contains.docker.container.image: etcd config: - module: etcd metricsets: ["leader", "self", "store"] hosts: "${data.host}:2379" Watch Docker events and react to changes
  27. 34 Autodiscover Watch Docker events and react to changes Events

    API Container start/stop events Beats { "host": "10.4.15.9", "port": 2379, "docker": { "container": { "id": "13a2...d716" "name": "etcd", "image": "quay.io/coreos/etcd:v3.0.0", "labels": { "io.kubernetes.pod.name": "etcd-4dk4c", "io.kubernetes.pod.namespace": "kube-system" ... } } } } 1. autodiscover event - module: etcd metricsets: ["leader", "self", "store"] hosts: "${data.host}:2379" config template 3. var expansion 2. match condition 4. launch module - module: etcd hosts: "10.4.15.9:237 metricsets: ["leader", "self", "store"] 9"