Upgrade to Pro — share decks privately, control downloads, hide ads and more …

Wait! What’s going on inside my database?

Wait! What’s going on inside my database?

PostgreSQL 9.6 introduced wait events and PostgreSQL 10 progressed them, but what are they? What do they mean? How do I find them and how do I make them go away? Wait events are one of the most significant advancements in observability for PostgreSQL databases; their usefulness is unparalleled in troubleshooting performance. This talk will go into all that and more as we explore the world of PostgreSQL wait events.

Avatar for Jeremy Schneider

Jeremy Schneider

September 19, 2019

Other Decks in Technology

Transcript

  1. Jeremy Schneider, Amazon RDS Wait! What’s going on inside my

    database? PostgreSQL and the Science of Database Performance Updated: Sep 19, 2019
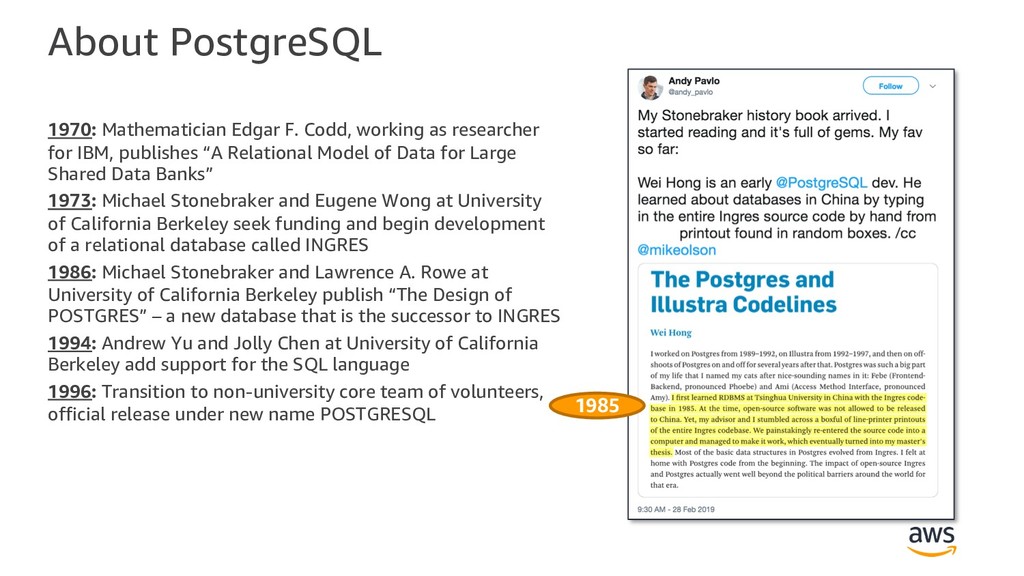
  2. About PostgreSQL 1970: Mathematician Edgar F. Codd, working as researcher

    for IBM, publishes “A Relational Model of Data for Large Shared Data Banks” 1973: Michael Stonebraker and Eugene Wong at University of California Berkeley seek funding and begin development of a relational database called INGRES 1986: Michael Stonebraker and Lawrence A. Rowe at University of California Berkeley publish “The Design of POSTGRES” – a new database that is the successor to INGRES 1994: Andrew Yu and Jolly Chen at University of California Berkeley add support for the SQL language 1996: Transition to non-university core team of volunteers, official release under new name POSTGRESQL 1985
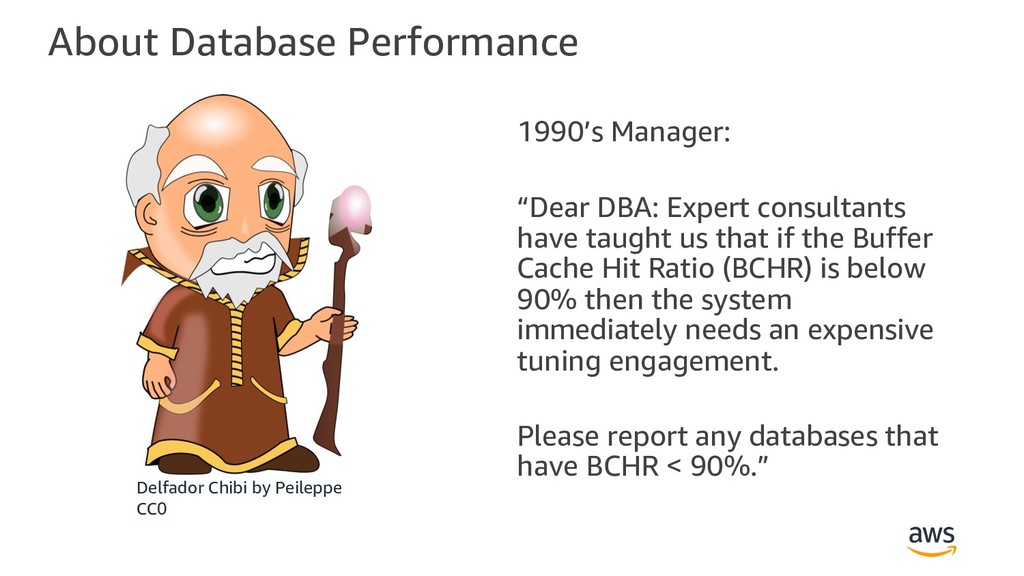
  3. About Database Performance 1990’s Manager: “Dear DBA: Expert consultants have

    taught us that if the Buffer Cache Hit Ratio (BCHR) is below 90% then the system immediately needs an expensive tuning engagement. Please report any databases that have BCHR < 90%.” Delfador Chibi by Peileppe CC0
  4. About Database Performance 1990’s Manager: “Dear DBA: Expert consultants have

    taught us that if the Buffer Cache Hit Ratio (BCHR) is below 90% then the system immediately needs an expensive tuning engagement. Please report any databases that have BCHR < 90%.” Delfador Chibi by Peileppe CC0
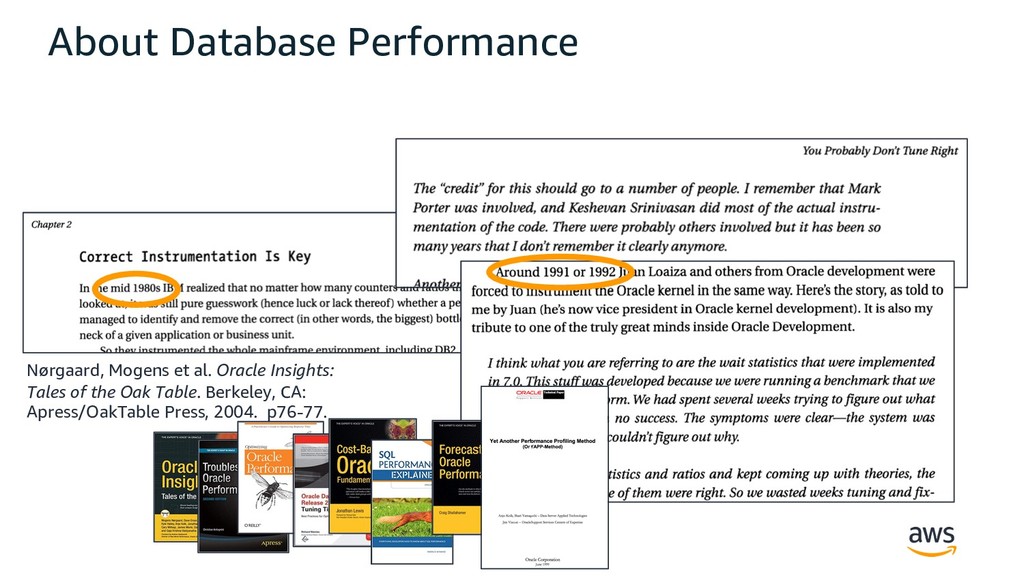
  5. Nørgaard, Mogens et al. Oracle Insights: Tales of the Oak

    Table. Berkeley, CA: Apress/OakTable Press, 2004. p76-77. About Database Performance
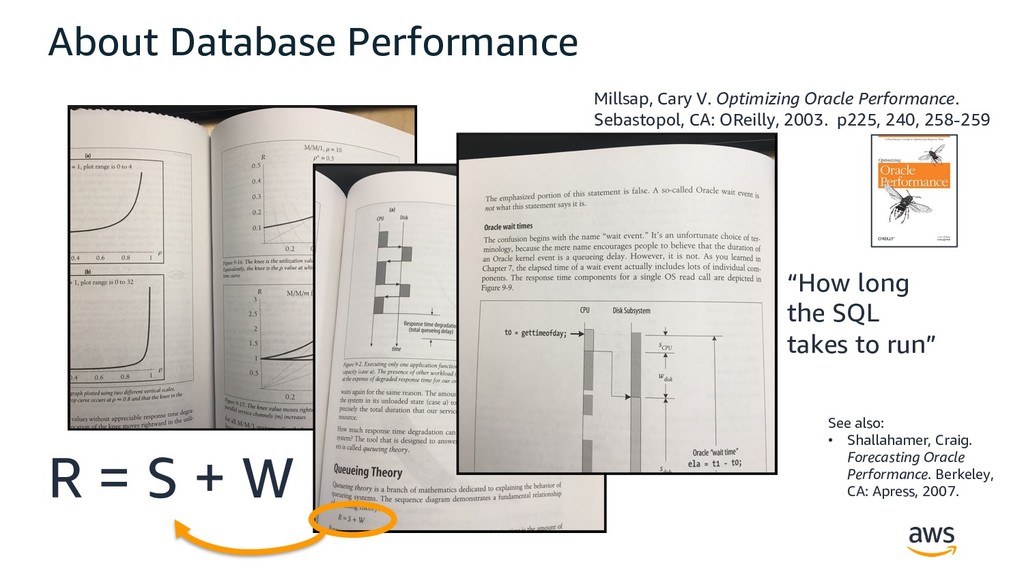
  6. About Database Performance Millsap, Cary V. Optimizing Oracle Performance. Sebastopol,

    CA: OReilly, 2003. p225, 240, 258-259 R = S + W “How long the SQL takes to run” See also: • Shallahamer, Craig. Forecasting Oracle Performance. Berkeley, CA: Apress, 2007.
  7. © 2019, Amazon Web Services, Inc. or its Affiliates. All

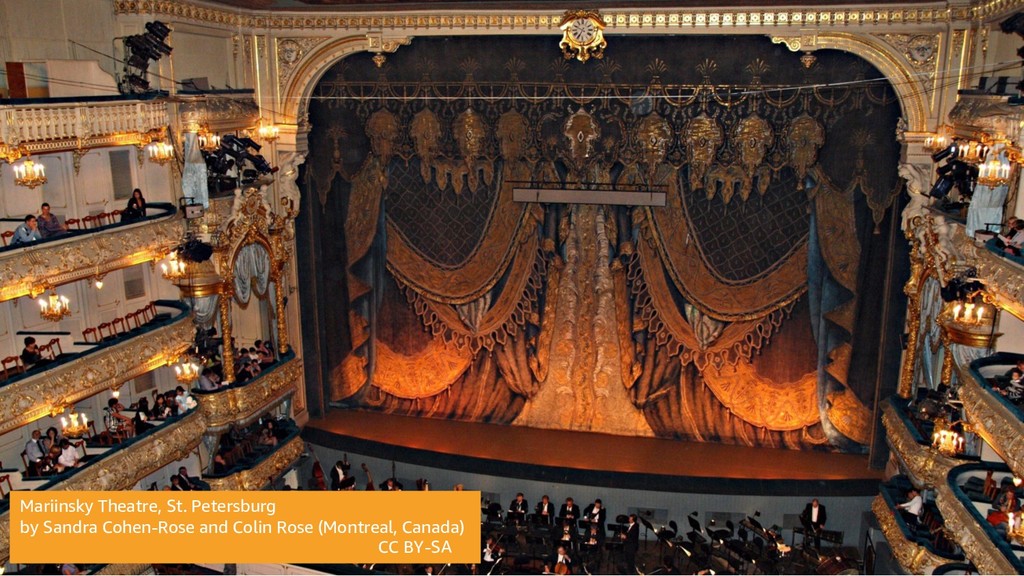
    rights reserved. Mariinsky Theatre, St. Petersburg by Sandra Cohen-Rose and Colin Rose (Montreal, Canada) CC BY-SA
  8. Mariinsky Theatre, St. Petersburg by Sandra Cohen-Rose and Colin Rose

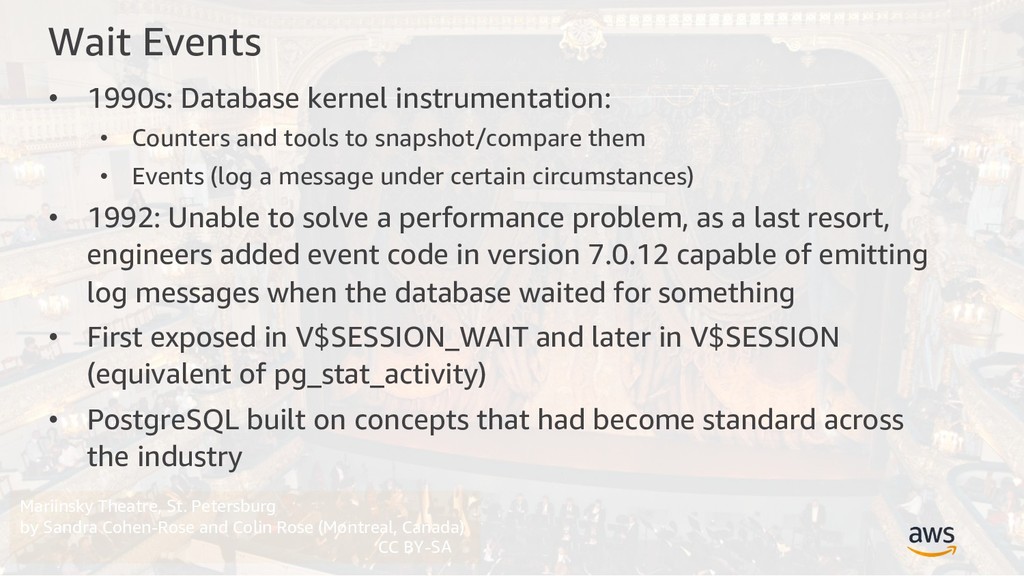
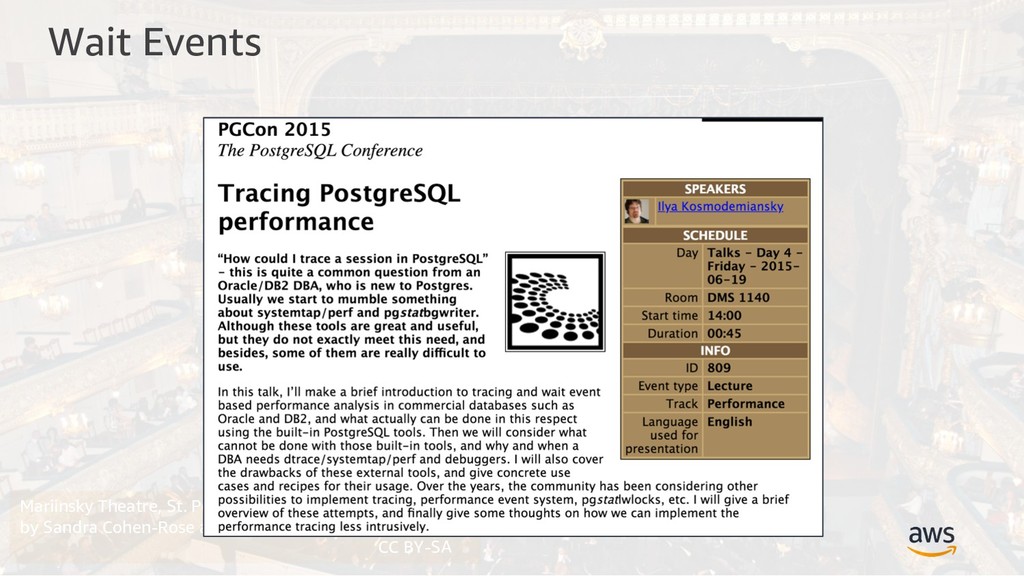
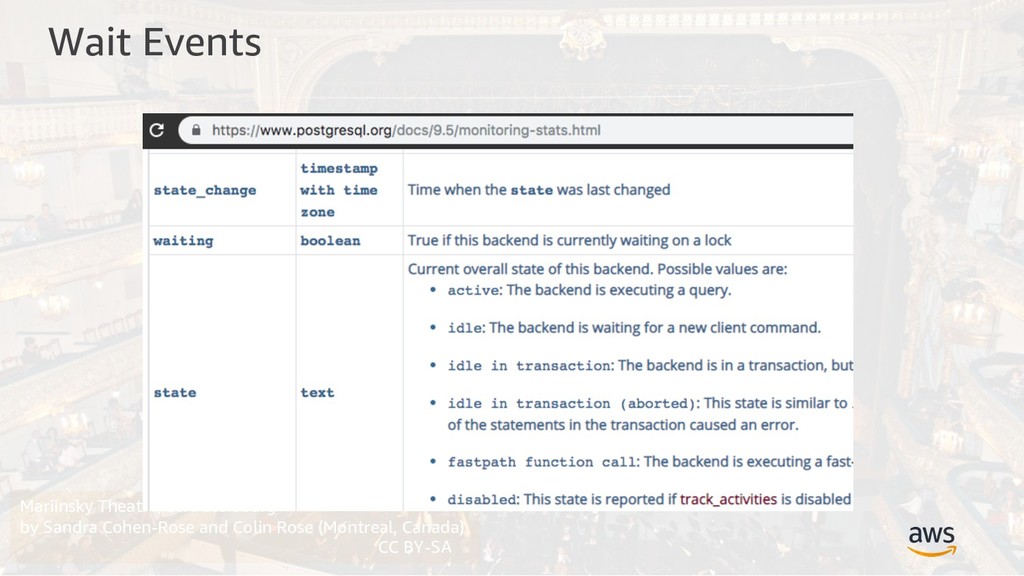
    (Montreal, Canada) CC BY-SA Wait Events • 1990s: Database kernel instrumentation: • Counters and tools to snapshot/compare them • Events (log a message under certain circumstances) • 1992: Unable to solve a performance problem, as a last resort, engineers added event code in version 7.0.12 capable of emitting log messages when the database waited for something • First exposed in V$SESSION_WAIT and later in V$SESSION (equivalent of pg_stat_activity) • PostgreSQL built on concepts that had become standard across the industry
  9. Mariinsky Theatre, St. Petersburg by Sandra Cohen-Rose and Colin Rose

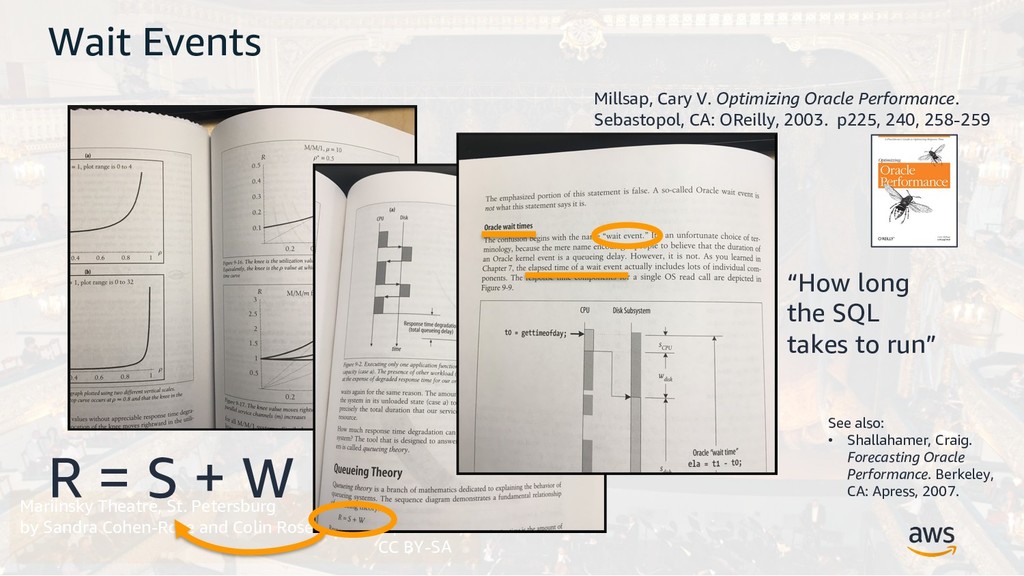
    (Montreal, Canada) CC BY-SA Wait Events Millsap, Cary V. Optimizing Oracle Performance. Sebastopol, CA: OReilly, 2003. p225, 240, 258-259 R = S + W “How long the SQL takes to run” See also: • Shallahamer, Craig. Forecasting Oracle Performance. Berkeley, CA: Apress, 2007.
  10. Mariinsky Theatre, St. Petersburg by Sandra Cohen-Rose and Colin Rose

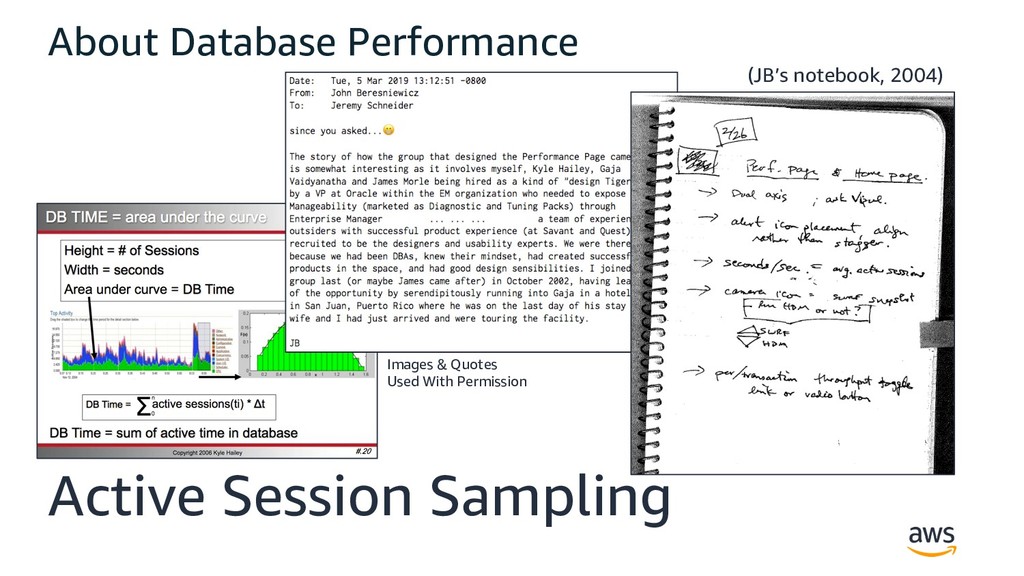
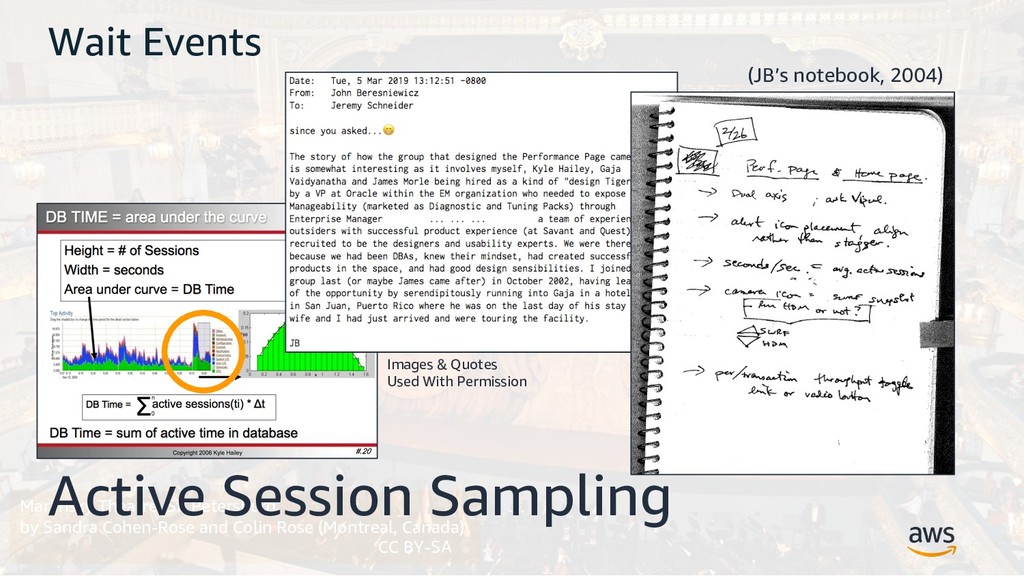
    (Montreal, Canada) CC BY-SA Wait Events Active Session Sampling (JB’s notebook, 2004) Images & Quotes Used With Permission
  11. Mariinsky Theatre, St. Petersburg by Sandra Cohen-Rose and Colin Rose

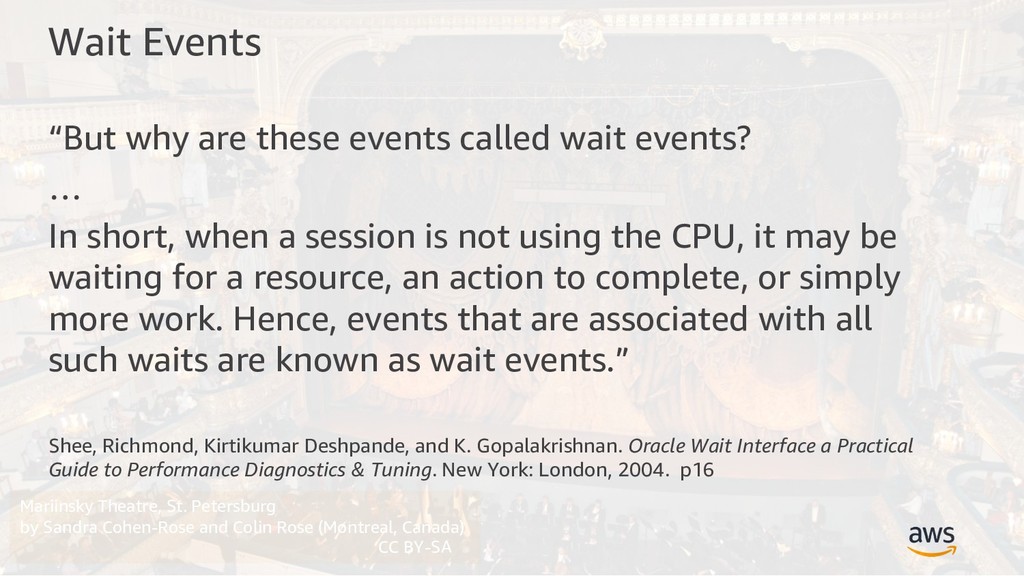
    (Montreal, Canada) CC BY-SA Wait Events “But why are these events called wait events? … In short, when a session is not using the CPU, it may be waiting for a resource, an action to complete, or simply more work. Hence, events that are associated with all such waits are known as wait events.” Shee, Richmond, Kirtikumar Deshpande, and K. Gopalakrishnan. Oracle Wait Interface a Practical Guide to Performance Diagnostics & Tuning. New York: London, 2004. p16
  12. Mariinsky Theatre, St. Petersburg by Sandra Cohen-Rose and Colin Rose

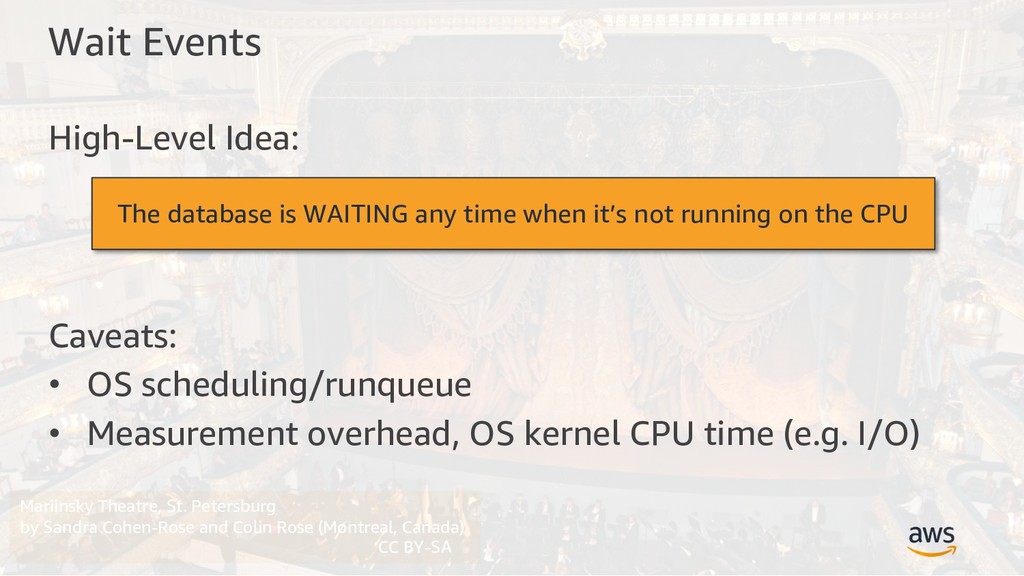
    (Montreal, Canada) CC BY-SA Wait Events High-Level Idea: Caveats: • OS scheduling/runqueue • Measurement overhead, OS kernel CPU time (e.g. I/O) The database is WAITING any time when it’s not running on the CPU
  13. Mariinsky Theatre, St. Petersburg by Sandra Cohen-Rose and Colin Rose

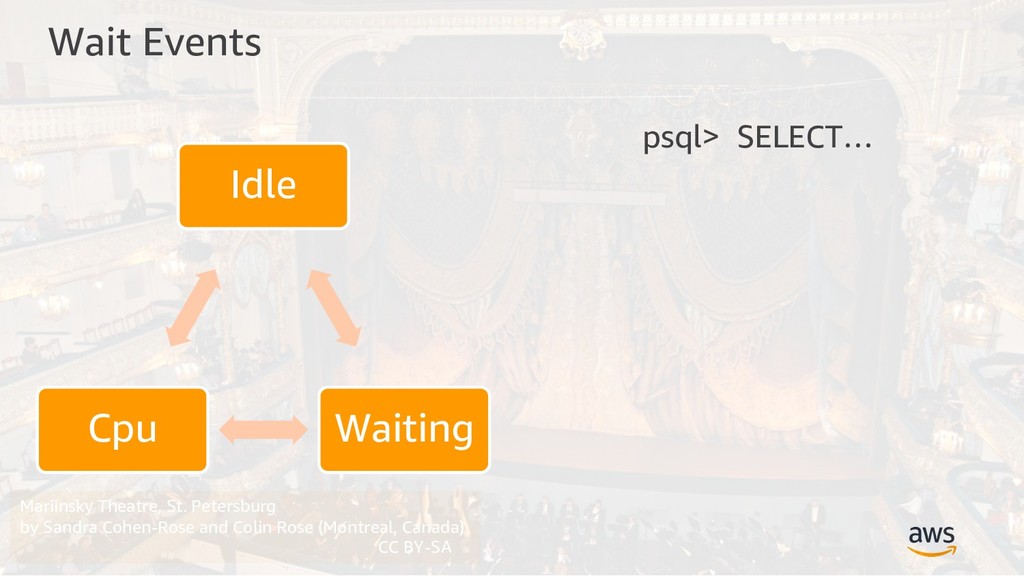
    (Montreal, Canada) CC BY-SA Wait Events psql> SELECT… Idle Waiting Cpu
  14. Mariinsky Theatre, St. Petersburg by Sandra Cohen-Rose and Colin Rose

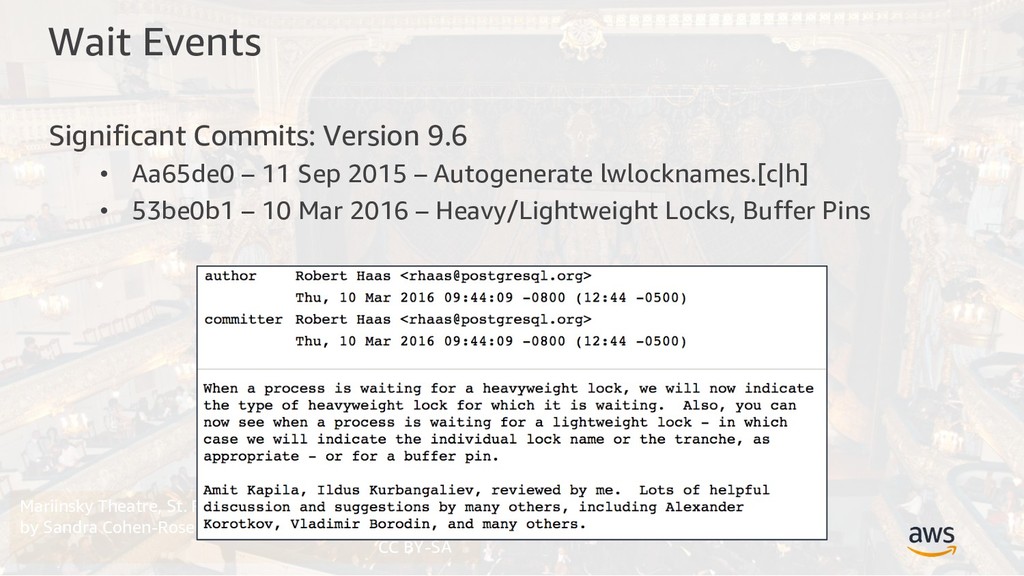
    (Montreal, Canada) CC BY-SA Wait Events Significant Commits: Version 9.6 • Aa65de0 – 11 Sep 2015 – Autogenerate lwlocknames.[c|h] • 53be0b1 – 10 Mar 2016 – Heavy/Lightweight Locks, Buffer Pins
  15. Mariinsky Theatre, St. Petersburg by Sandra Cohen-Rose and Colin Rose

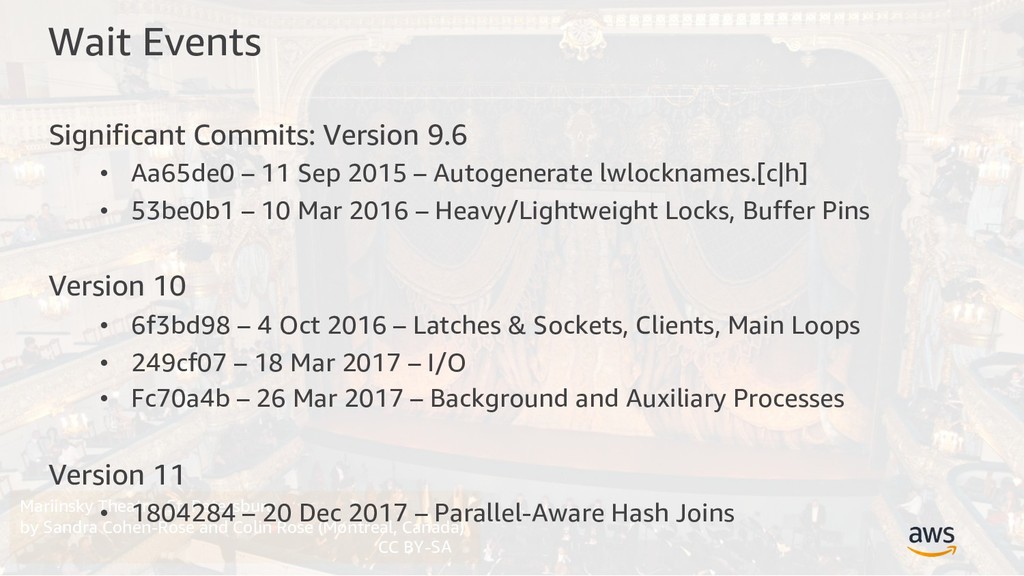
    (Montreal, Canada) CC BY-SA Wait Events Significant Commits: Version 9.6 • Aa65de0 – 11 Sep 2015 – Autogenerate lwlocknames.[c|h] • 53be0b1 – 10 Mar 2016 – Heavy/Lightweight Locks, Buffer Pins Version 10 • 6f3bd98 – 4 Oct 2016 – Latches & Sockets, Clients, Main Loops • 249cf07 – 18 Mar 2017 – I/O • Fc70a4b – 26 Mar 2017 – Background and Auxiliary Processes Version 11 • 1804284 – 20 Dec 2017 – Parallel-Aware Hash Joins
  16. Mariinsky Theatre, St. Petersburg by Sandra Cohen-Rose and Colin Rose

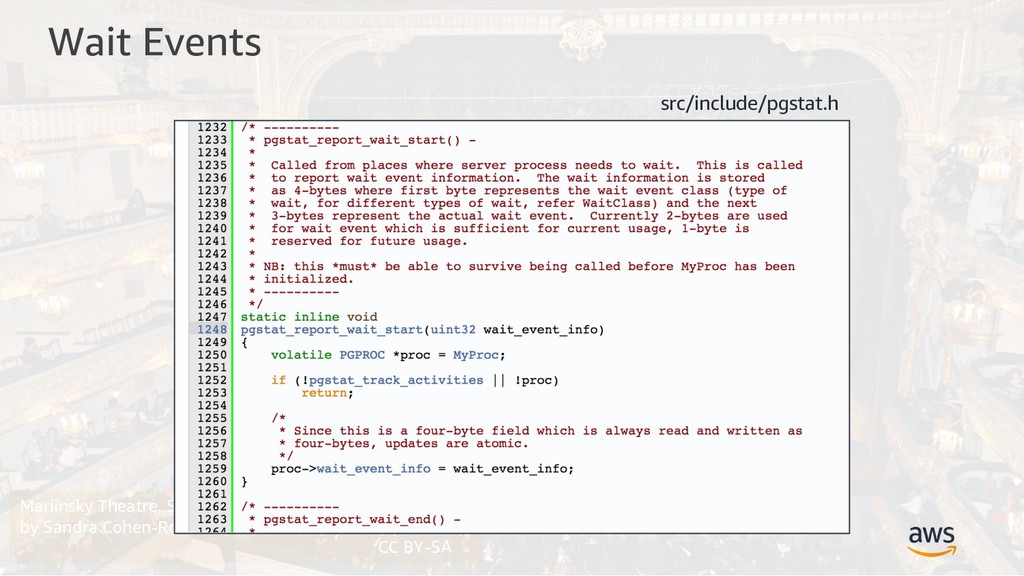
    (Montreal, Canada) CC BY-SA Wait Events src/include/pgstat.h
  17. Mariinsky Theatre, St. Petersburg by Sandra Cohen-Rose and Colin Rose

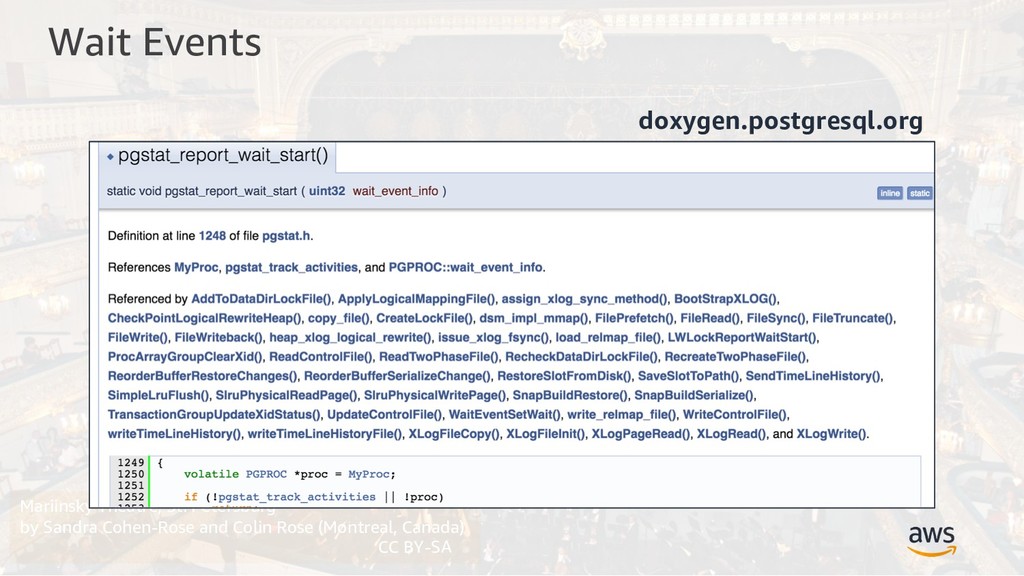
    (Montreal, Canada) CC BY-SA Wait Events doxygen.postgresql.org
  18. Mariinsky Theatre, St. Petersburg by Sandra Cohen-Rose and Colin Rose

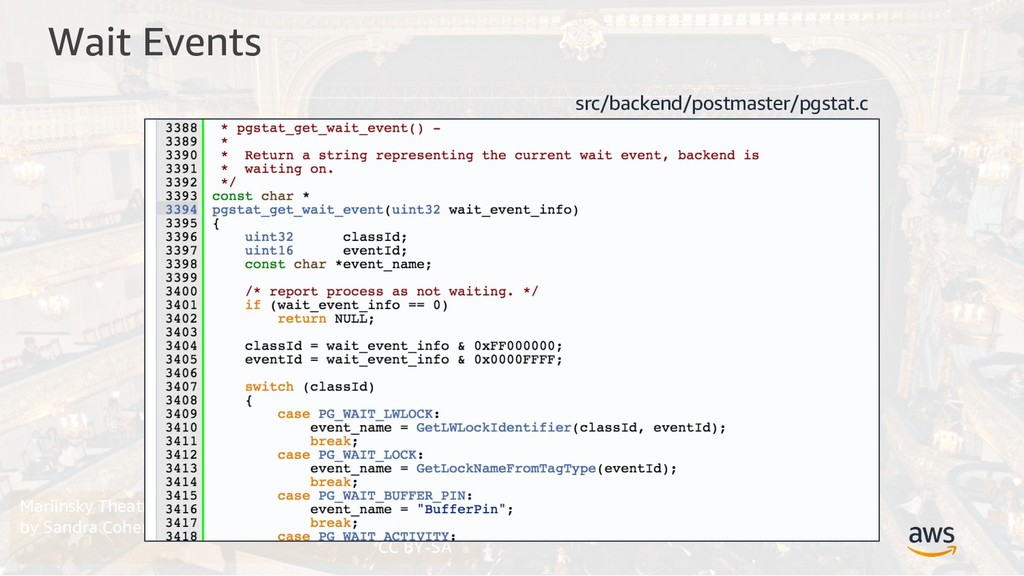
    (Montreal, Canada) CC BY-SA Wait Events src/backend/postmaster/pgstat.c
  19. Mariinsky Theatre, St. Petersburg by Sandra Cohen-Rose and Colin Rose

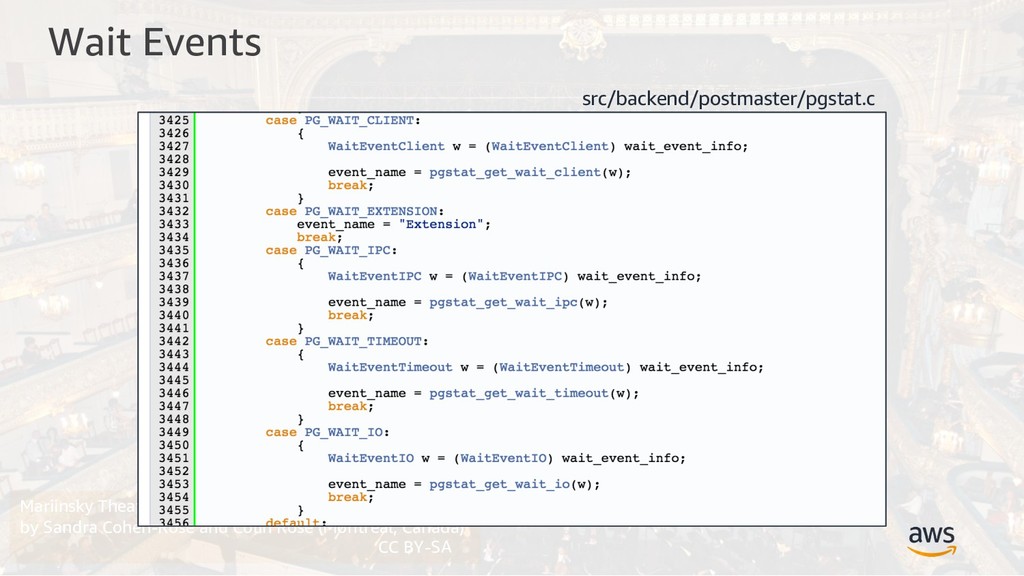
    (Montreal, Canada) CC BY-SA Wait Events src/backend/postmaster/pgstat.c
  20. Mariinsky Theatre, St. Petersburg by Sandra Cohen-Rose and Colin Rose

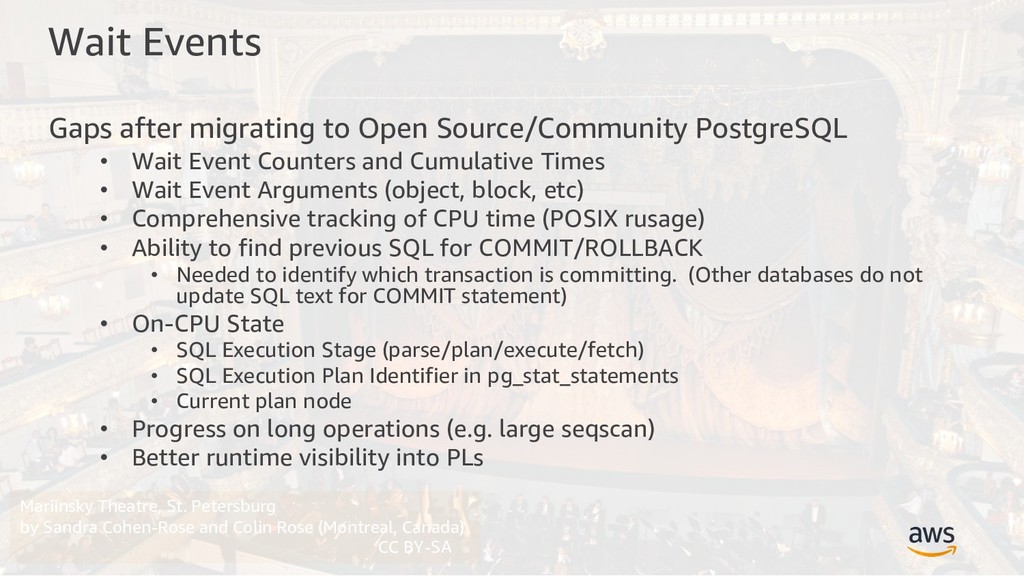
    (Montreal, Canada) CC BY-SA Wait Events Gaps after migrating to Open Source/Community PostgreSQL • Wait Event Counters and Cumulative Times • Wait Event Arguments (object, block, etc) • Comprehensive tracking of CPU time (POSIX rusage) • Ability to find previous SQL for COMMIT/ROLLBACK • Needed to identify which transaction is committing. (Other databases do not update SQL text for COMMIT statement) • On-CPU State • SQL Execution Stage (parse/plan/execute/fetch) • SQL Execution Plan Identifier in pg_stat_statements • Current plan node • Progress on long operations (e.g. large seqscan) • Better runtime visibility into PLs
  21. I can haz Wait Events? Solving Problems with Wait Events

    in PostgreSQL By Antony Griffiths (Flickr), CC BY
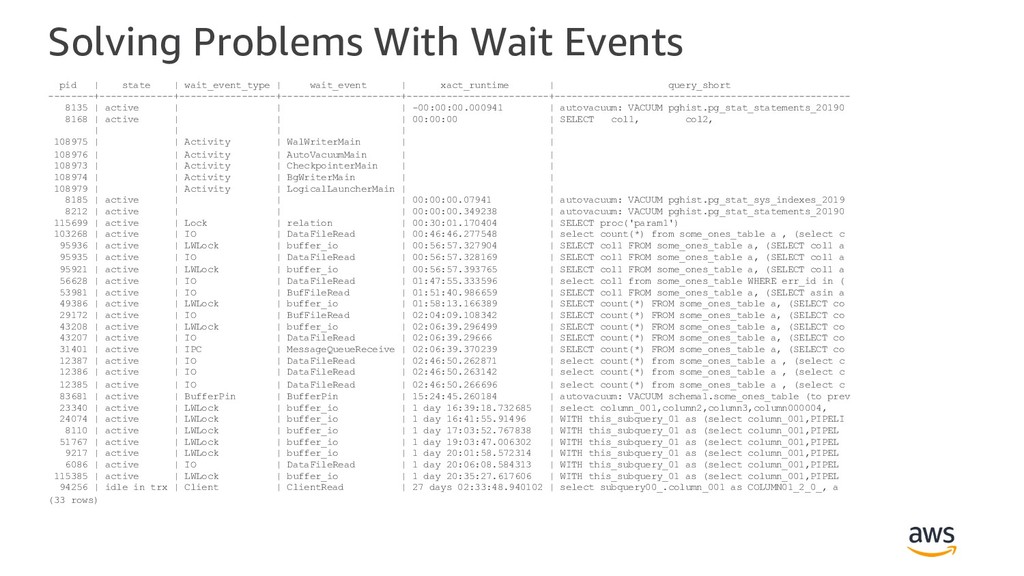
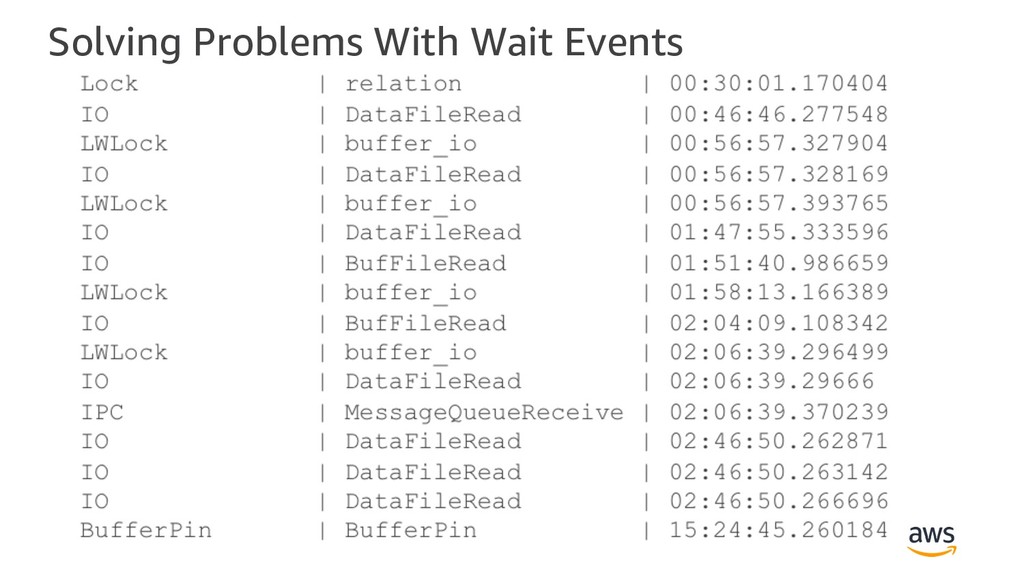
  22. Solving Problems With Wait Events pid | state | wait_event_type

    | wait_event | xact_runtime | query_short --------+-------------+-----------------+---------------------+-------------------------+---------------------------------------------------- 8135 | active | | | -00:00:00.000941 | autovacuum: VACUUM pghist.pg_stat_statements_20190 8168 | active | | | 00:00:00 | SELECT col1, col2, | | | | | 108975 | | Activity | WalWriterMain | | 108976 | | Activity | AutoVacuumMain | | 108973 | | Activity | CheckpointerMain | | 108974 | | Activity | BgWriterMain | | 108979 | | Activity | LogicalLauncherMain | | 8185 | active | | | 00:00:00.07941 | autovacuum: VACUUM pghist.pg_stat_sys_indexes_2019 8212 | active | | | 00:00:00.349238 | autovacuum: VACUUM pghist.pg_stat_statements_20190 115699 | active | Lock | relation | 00:30:01.170404 | SELECT proc('param1') 103268 | active | IO | DataFileRead | 00:46:46.277548 | select count(*) from some_ones_table a , (select c 95936 | active | LWLock | buffer_io | 00:56:57.327904 | SELECT col1 FROM some_ones_table a, (SELECT col1 a 95935 | active | IO | DataFileRead | 00:56:57.328169 | SELECT col1 FROM some_ones_table a, (SELECT col1 a 95921 | active | LWLock | buffer_io | 00:56:57.393765 | SELECT col1 FROM some_ones_table a, (SELECT col1 a 56628 | active | IO | DataFileRead | 01:47:55.333596 | select col1 from some_ones_table WHERE err_id in ( 53981 | active | IO | BufFileRead | 01:51:40.986659 | SELECT col1 FROM some_ones_table a, (SELECT asin a 49386 | active | LWLock | buffer_io | 01:58:13.166389 | SELECT count(*) FROM some_ones_table a, (SELECT co 29172 | active | IO | BufFileRead | 02:04:09.108342 | SELECT count(*) FROM some_ones_table a, (SELECT co 43208 | active | LWLock | buffer_io | 02:06:39.296499 | SELECT count(*) FROM some_ones_table a, (SELECT co 43207 | active | IO | DataFileRead | 02:06:39.29666 | SELECT count(*) FROM some_ones_table a, (SELECT co 31401 | active | IPC | MessageQueueReceive | 02:06:39.370239 | SELECT count(*) FROM some_ones_table a, (SELECT co 12387 | active | IO | DataFileRead | 02:46:50.262871 | select count(*) from some_ones_table a , (select c 12386 | active | IO | DataFileRead | 02:46:50.263142 | select count(*) from some_ones_table a , (select c 12385 | active | IO | DataFileRead | 02:46:50.266696 | select count(*) from some_ones_table a , (select c 83681 | active | BufferPin | BufferPin | 15:24:45.260184 | autovacuum: VACUUM schema1.some_ones_table (to prev 23340 | active | LWLock | buffer_io | 1 day 16:39:18.732685 | select column_001,column2,column3,column000004, 24074 | active | LWLock | buffer_io | 1 day 16:41:55.91496 | WITH this_subquery_01 as (select column_001,PIPELI 8110 | active | LWLock | buffer_io | 1 day 17:03:52.767838 | WITH this_subquery_01 as (select column_001,PIPEL 51767 | active | LWLock | buffer_io | 1 day 19:03:47.006302 | WITH this_subquery_01 as (select column_001,PIPEL 9217 | active | LWLock | buffer_io | 1 day 20:01:58.572314 | WITH this_subquery_01 as (select column_001,PIPEL 6086 | active | IO | DataFileRead | 1 day 20:06:08.584313 | WITH this_subquery_01 as (select column_001,PIPEL 115385 | active | LWLock | buffer_io | 1 day 20:35:27.617606 | WITH this_subquery_01 as (select column_001,PIPEL 94256 | idle in trx | Client | ClientRead | 27 days 02:33:48.940102 | select subquery00_.column_001 as COLUMN01_2_0_, a (33 rows)
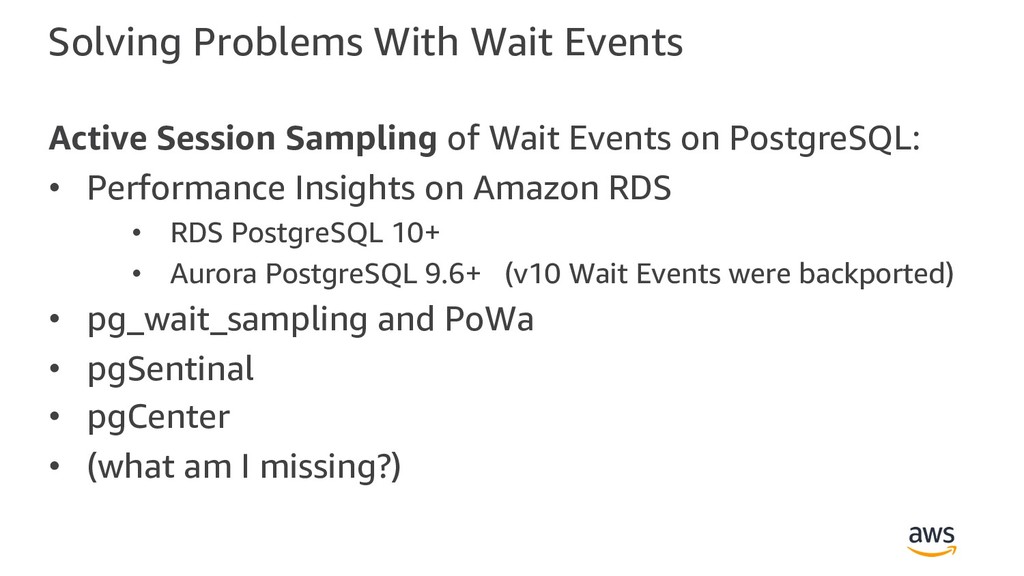
  23. Solving Problems With Wait Events Active Session Sampling of Wait

    Events on PostgreSQL: • Performance Insights on Amazon RDS • RDS PostgreSQL 10+ • Aurora PostgreSQL 9.6+ (v10 Wait Events were backported) • pg_wait_sampling and PoWa • pgSentinal • pgCenter • (what am I missing?)
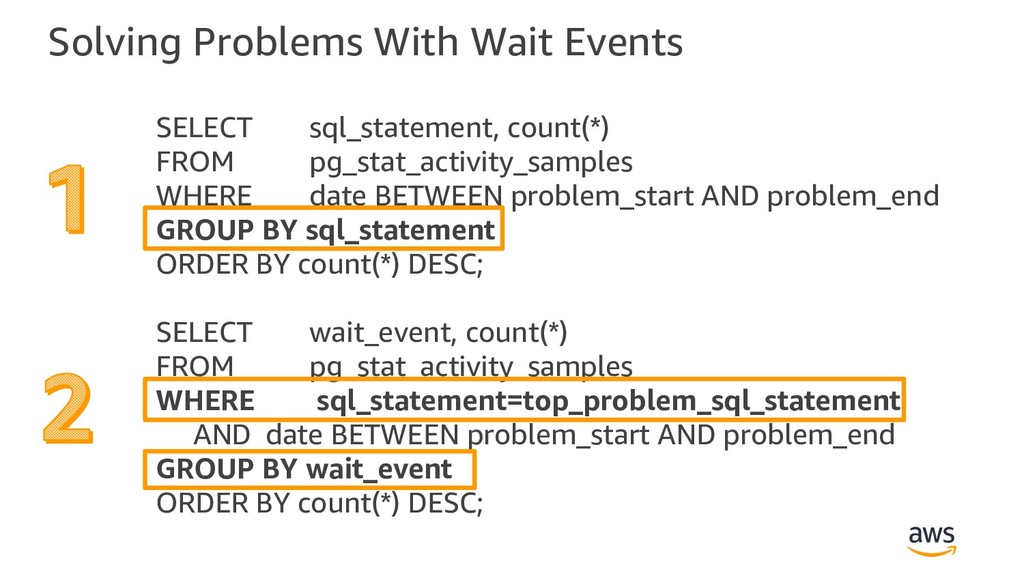
  24. Solving Problems With Wait Events SELECT sql_statement, count(*) FROM pg_stat_activity_samples

    WHERE date BETWEEN problem_start AND problem_end GROUP BY sql_statement ORDER BY count(*) DESC; SELECT wait_event, count(*) FROM pg_stat_activity_samples WHERE sql_statement=top_problem_sql_statement AND date BETWEEN problem_start AND problem_end GROUP BY wait_event ORDER BY count(*) DESC;
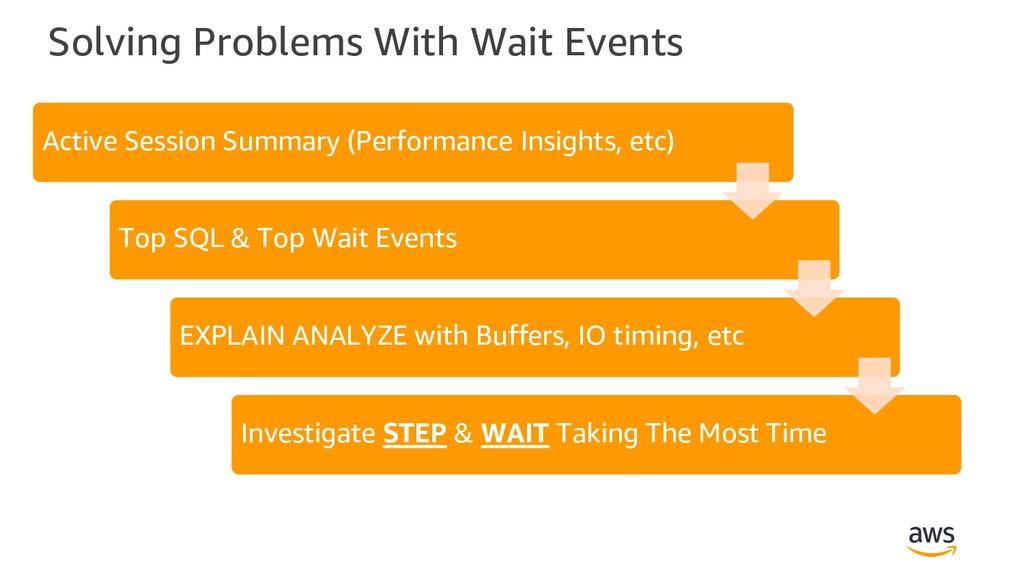
  25. Solving Problems With Wait Events Active Session Summary (Performance Insights,

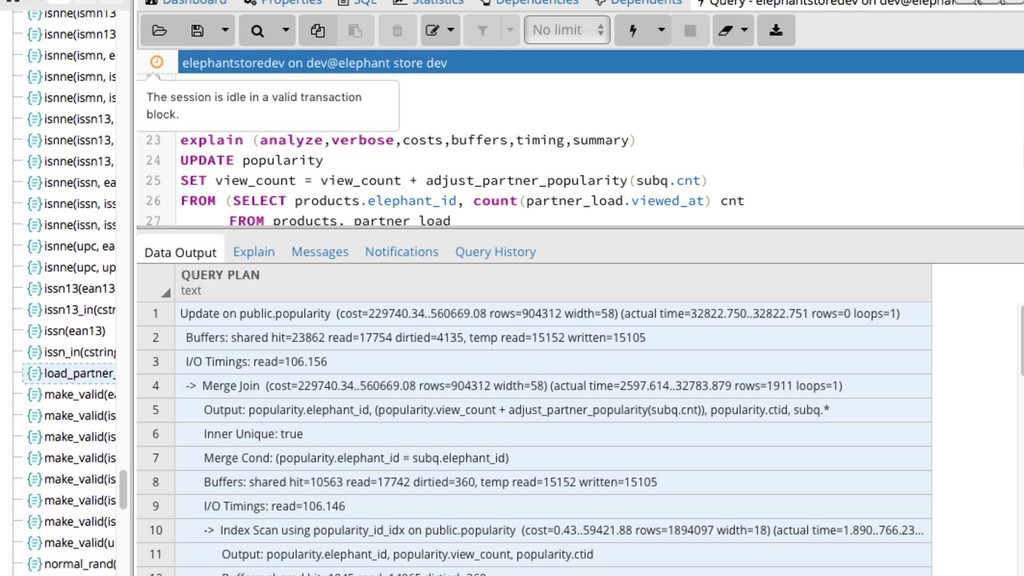
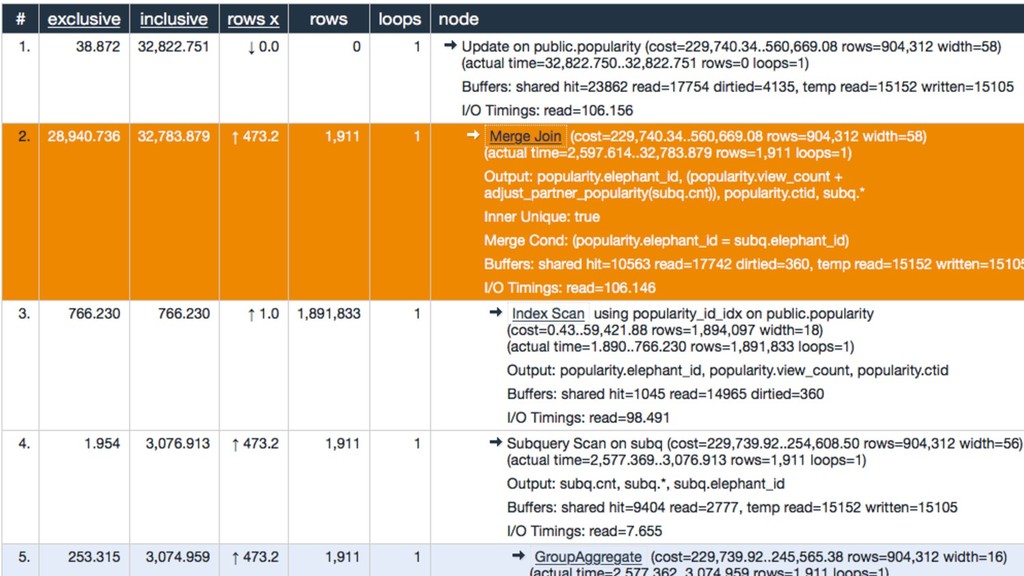
    etc) Top SQL & Top Wait Events EXPLAIN ANALYZE with Buffers, IO timing, etc Investigate STEP & WAIT Taking The Most Time
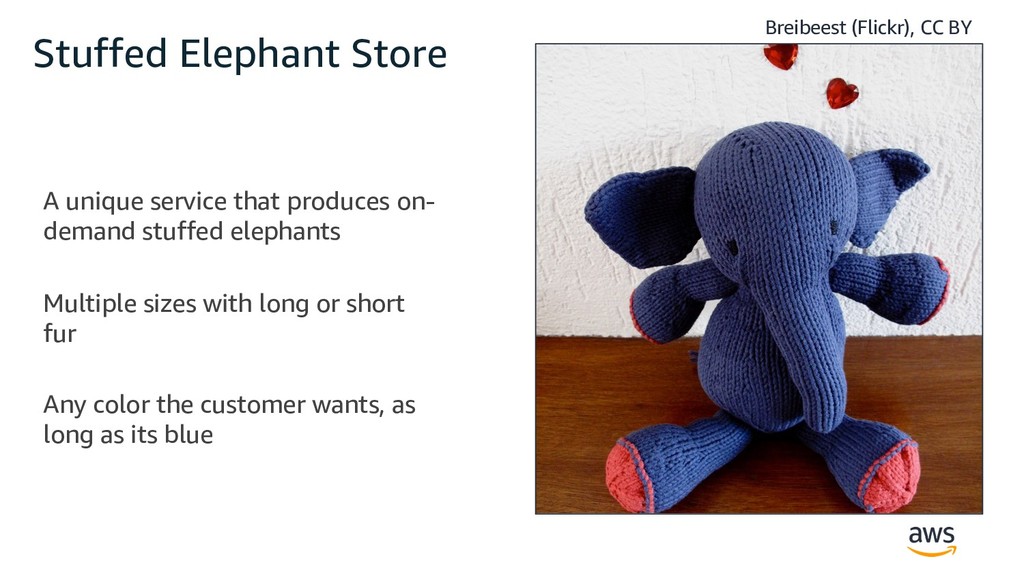
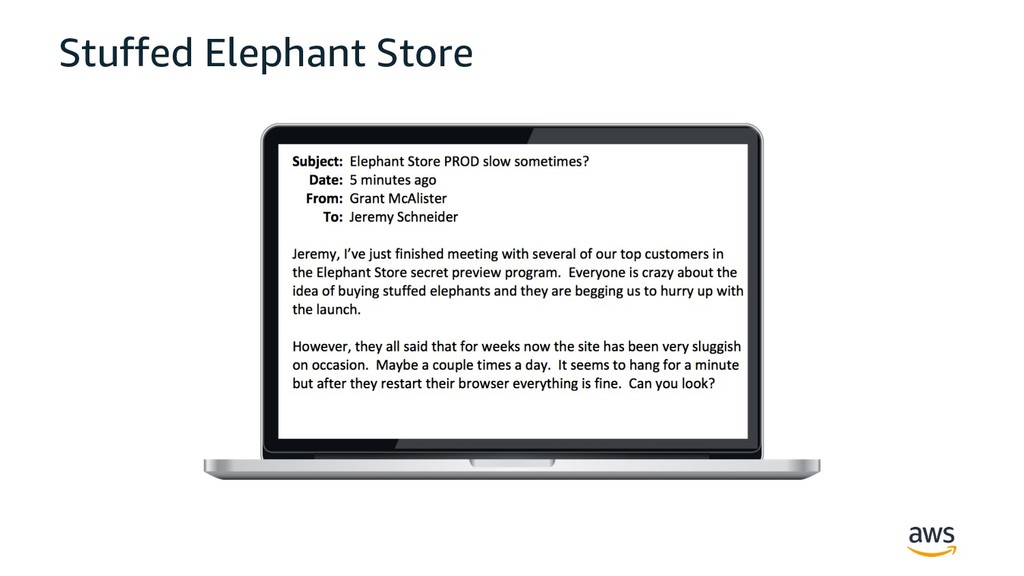
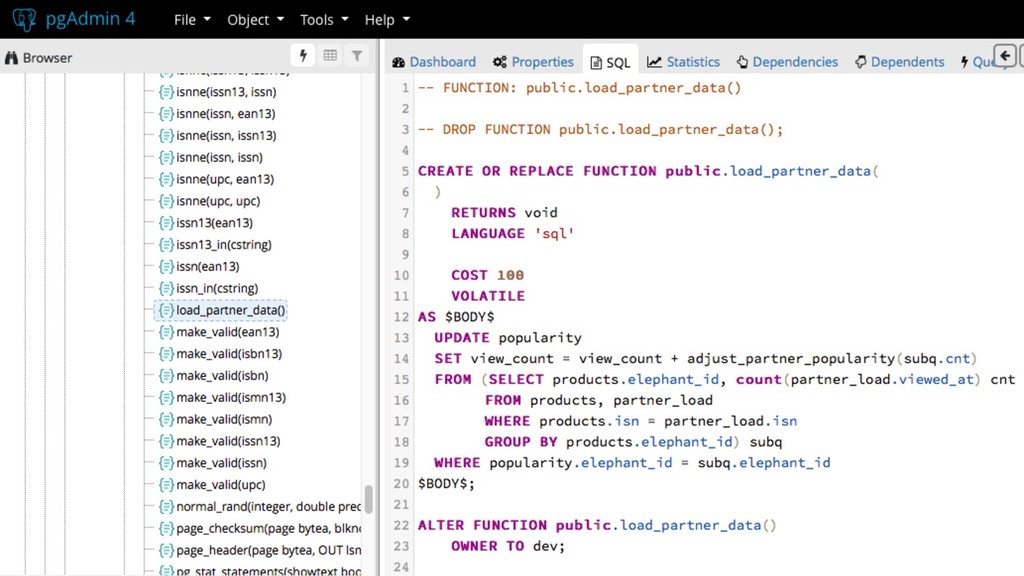
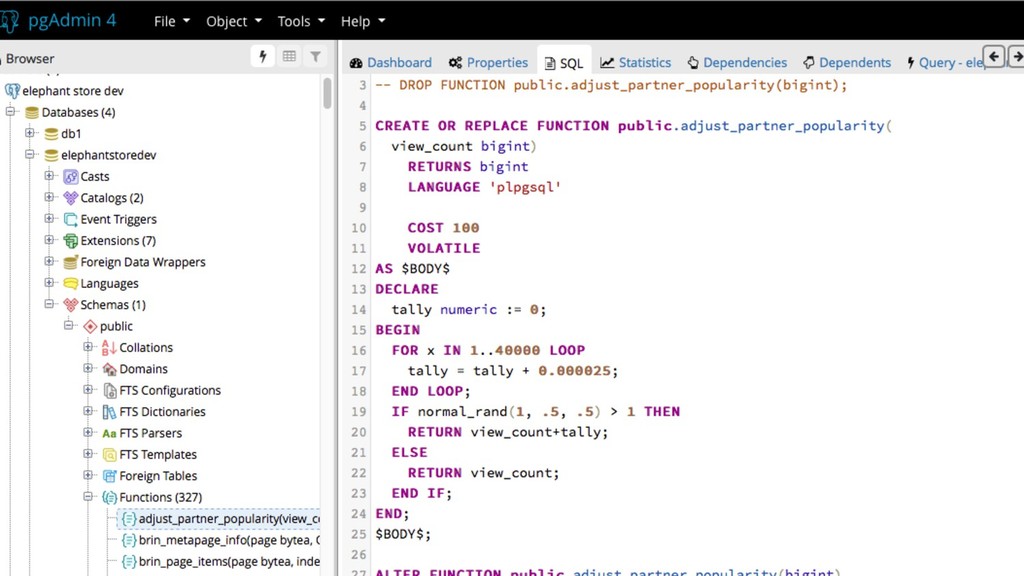
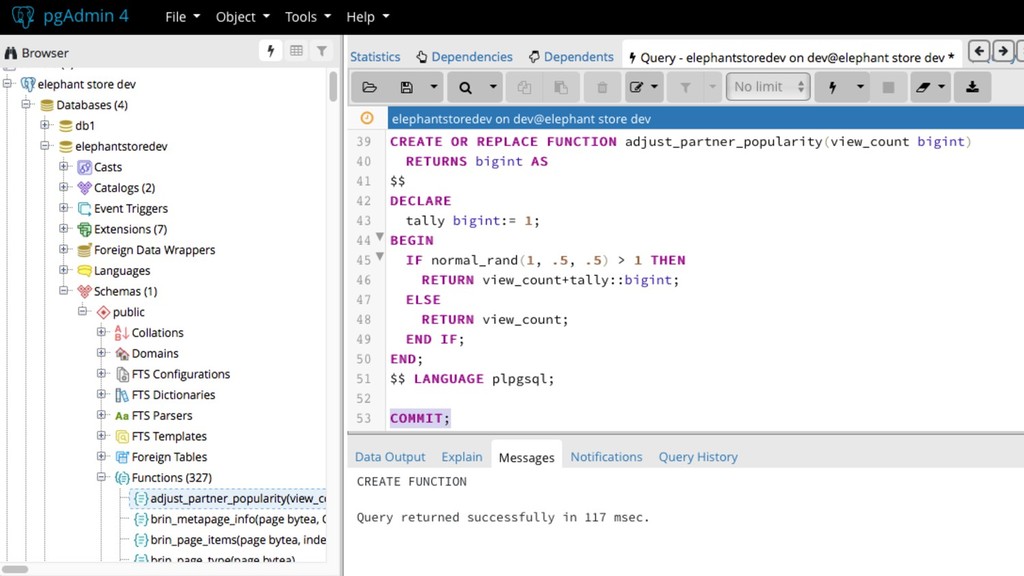
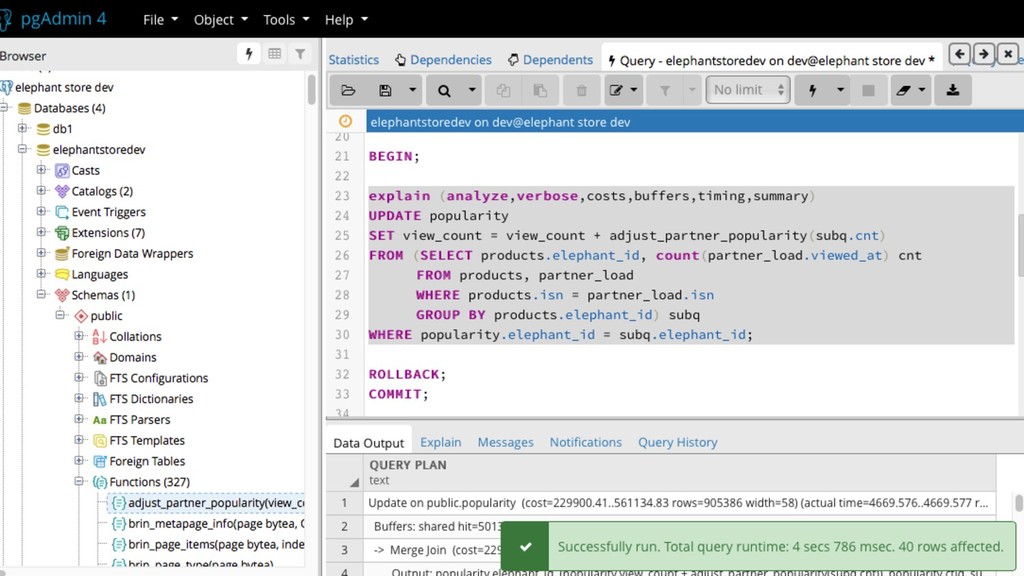
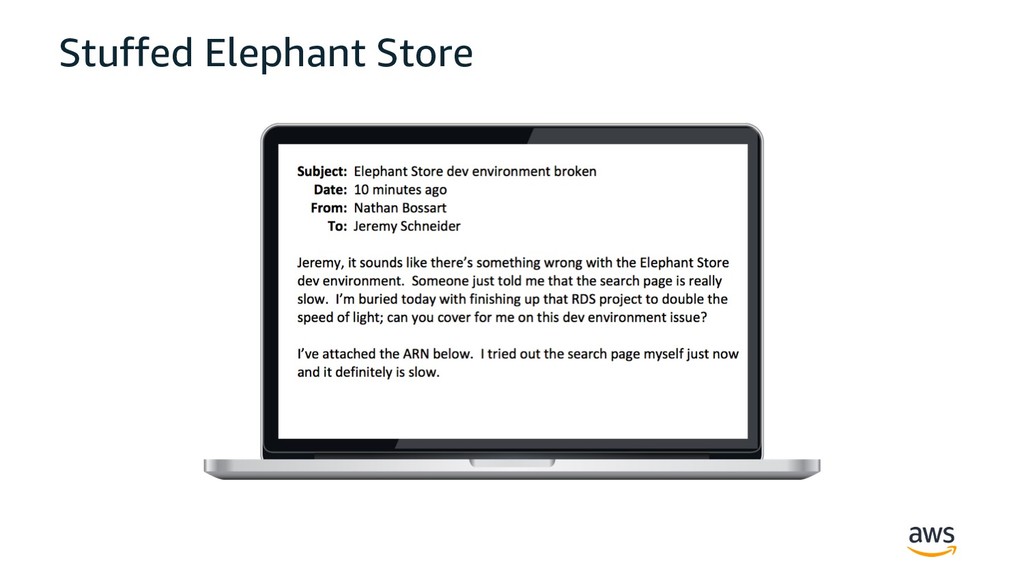
  26. Stuffed Elephant Store A unique service that produces on- demand

    stuffed elephants Multiple sizes with long or short fur Any color the customer wants, as long as its blue Breibeest (Flickr), CC BY
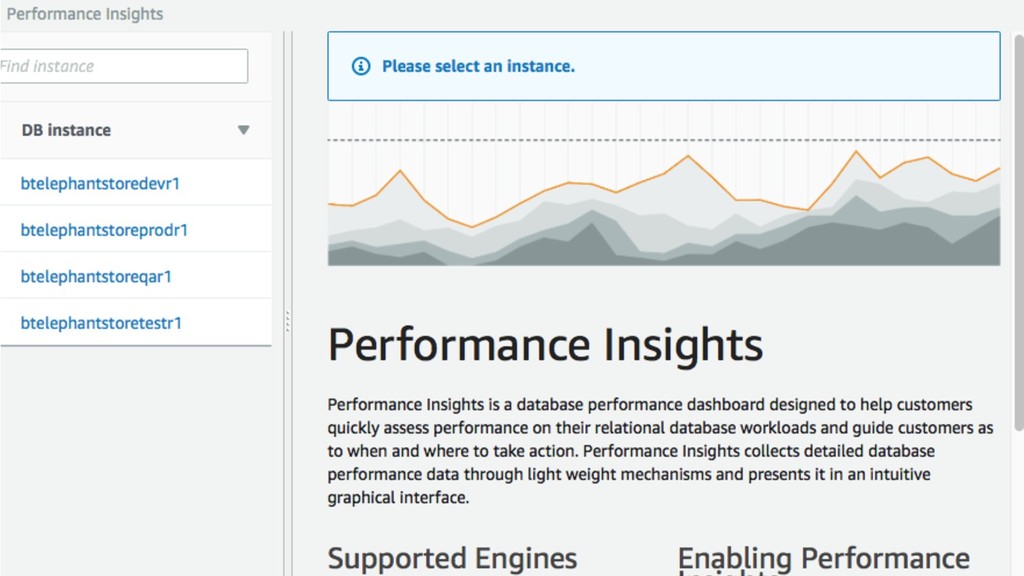
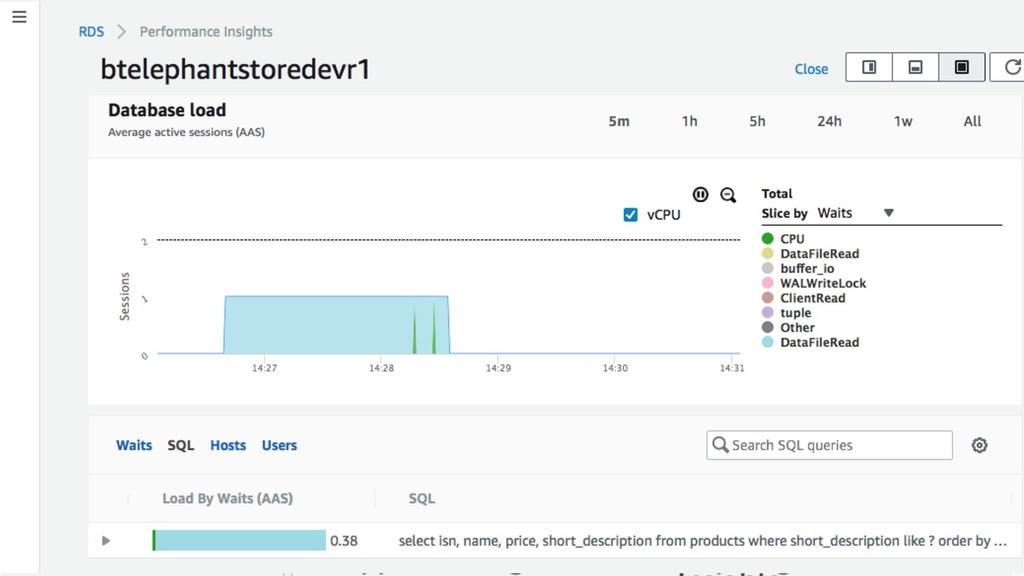
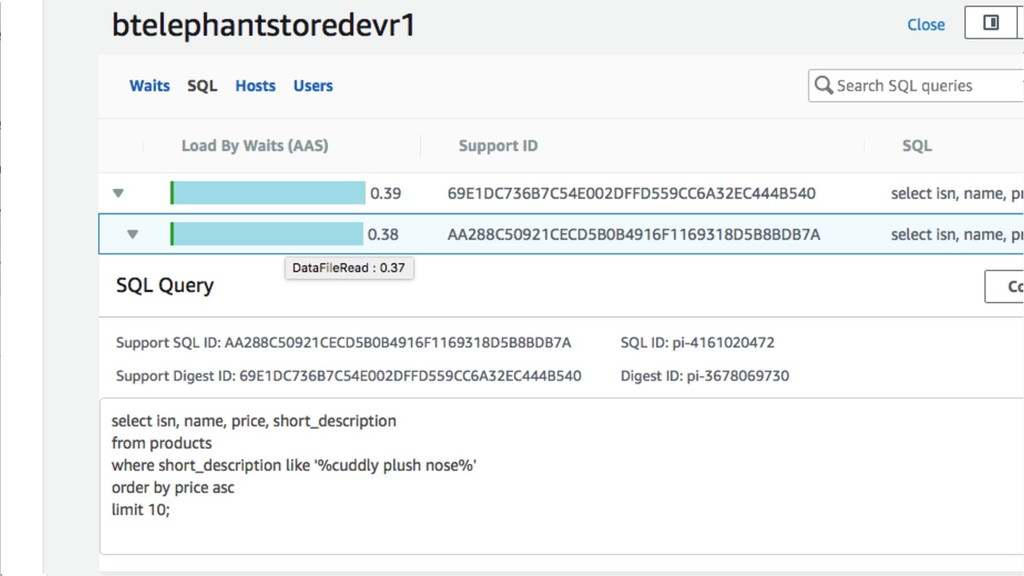
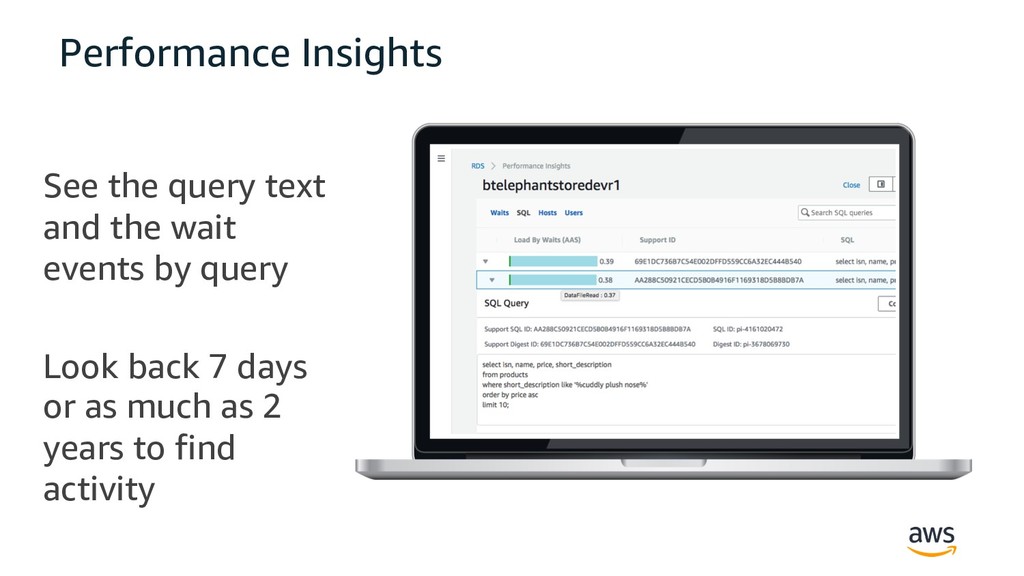
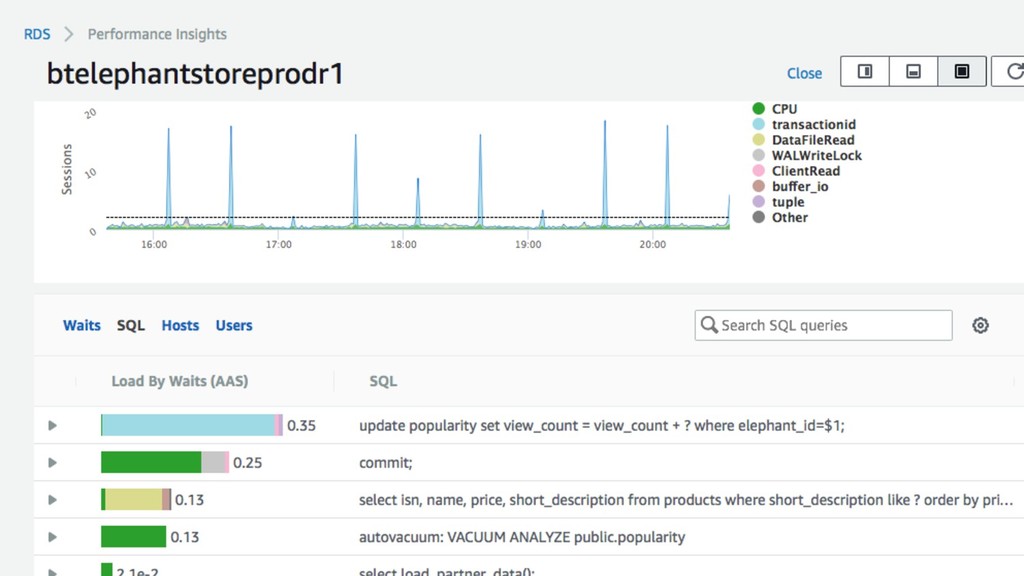
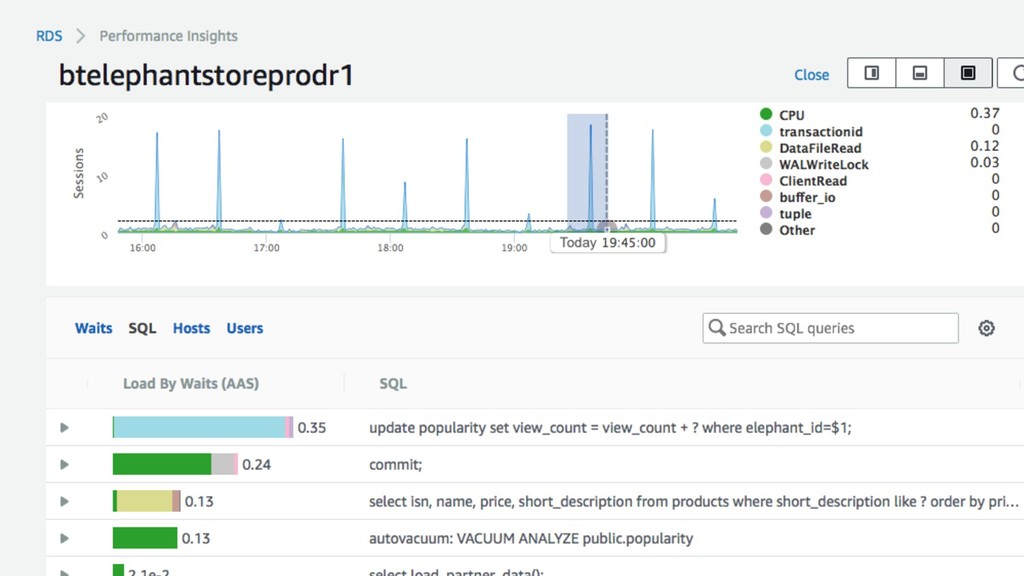
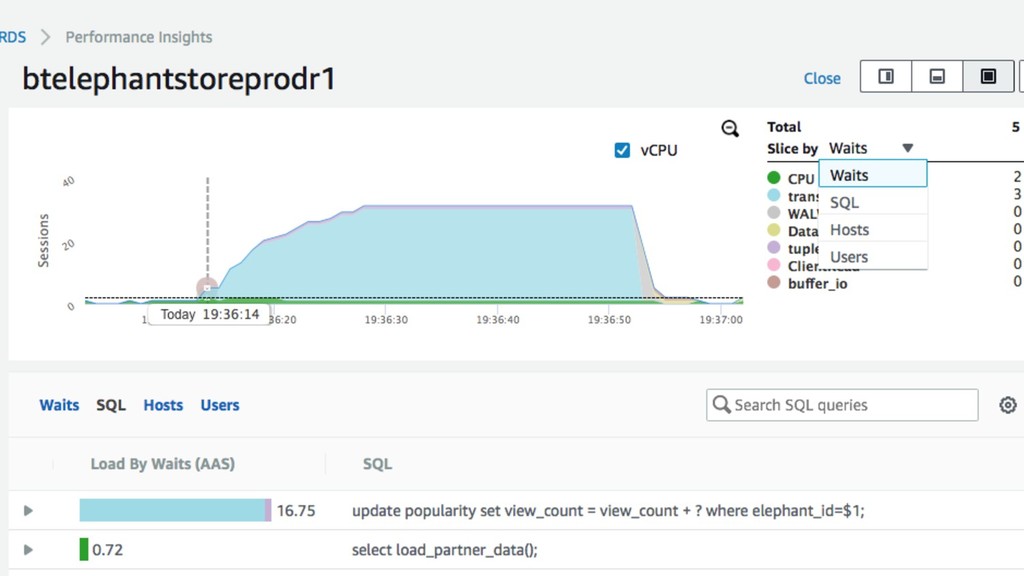
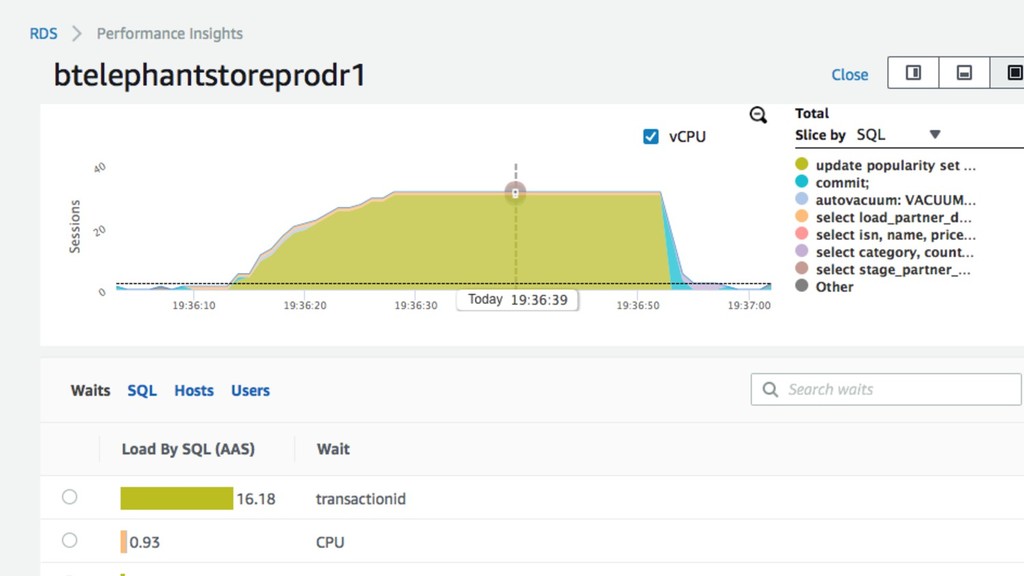
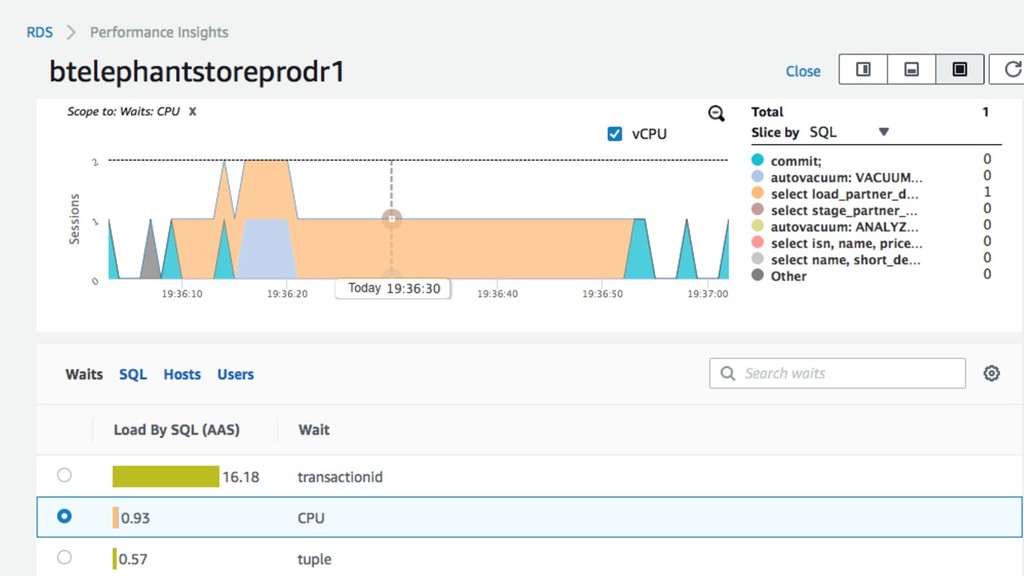
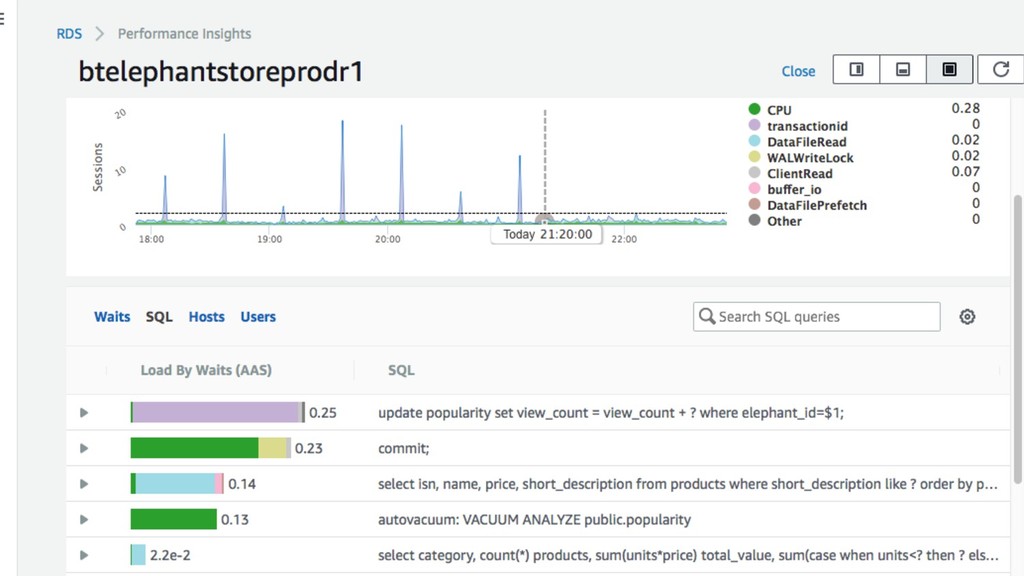
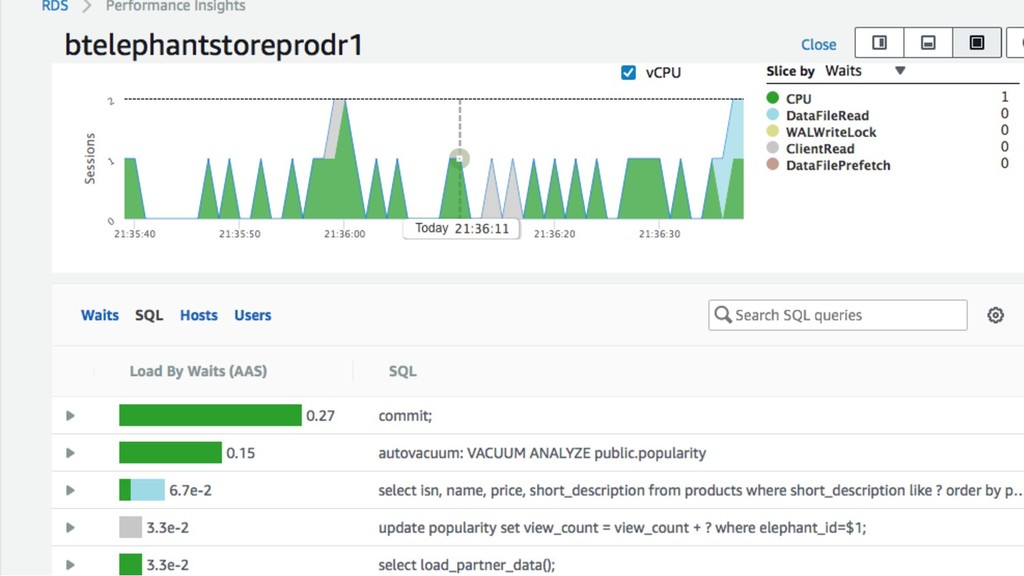
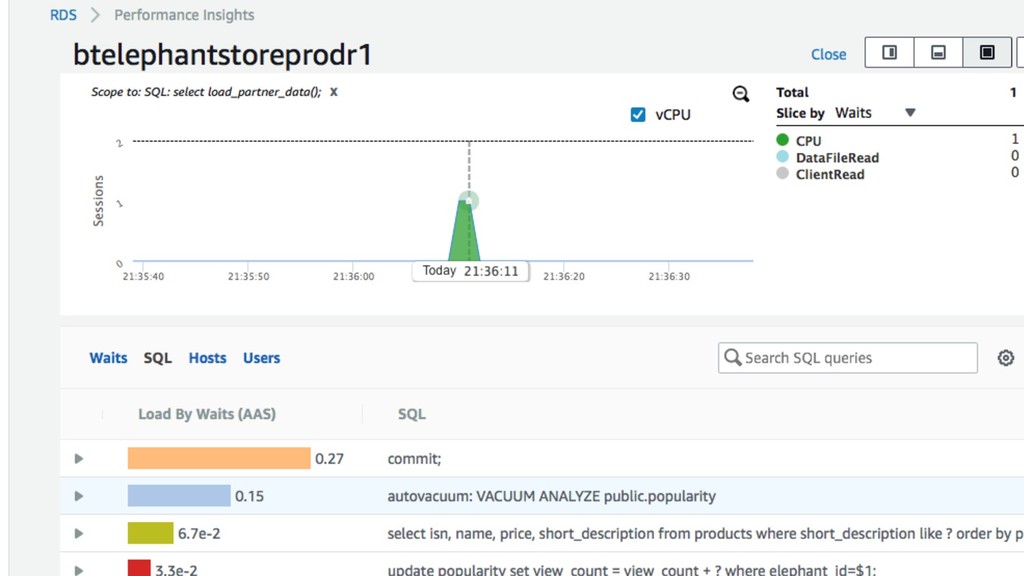
  27. Performance Insights See the query text and the wait events

    by query Look back 7 days or as much as 2 years to find activity
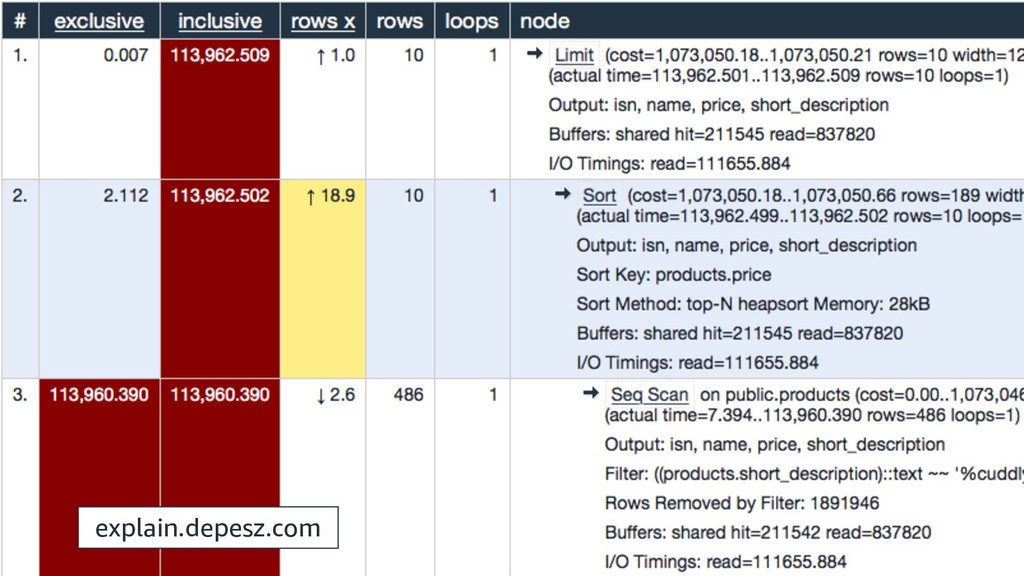
  28. © 2019, Amazon Web Services, Inc. or its Affiliates. All

    rights reserved. explain.depesz.com
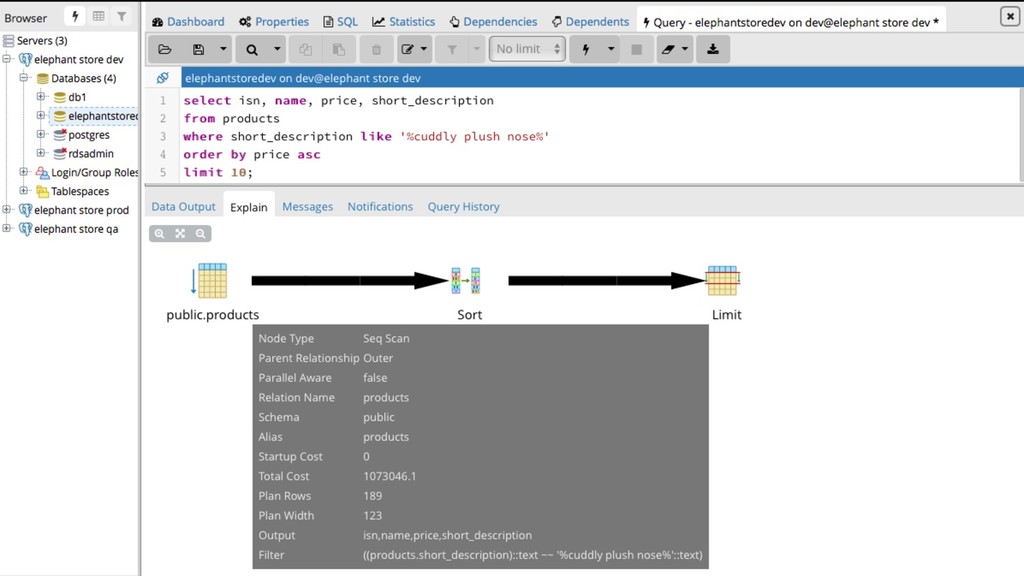
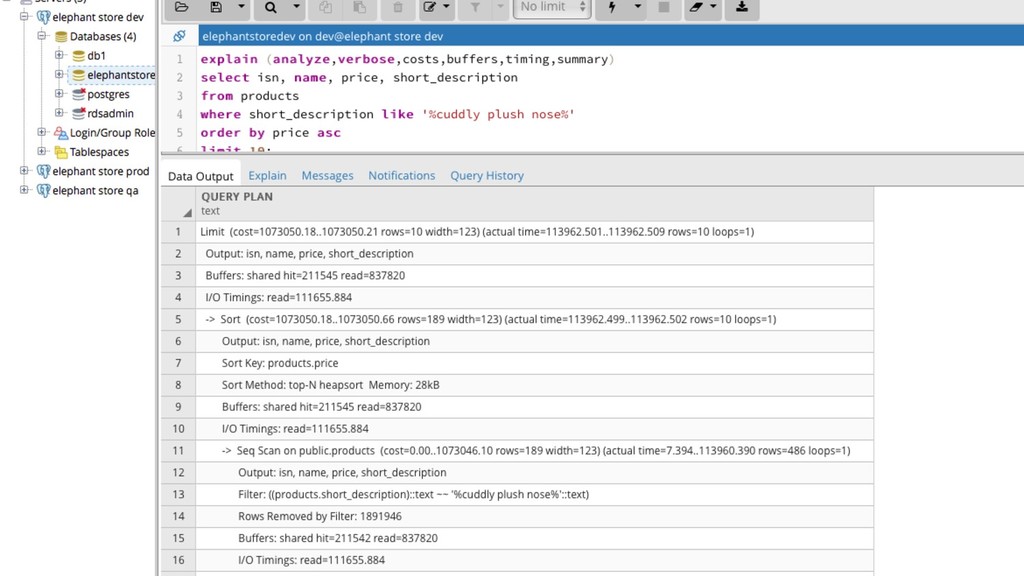
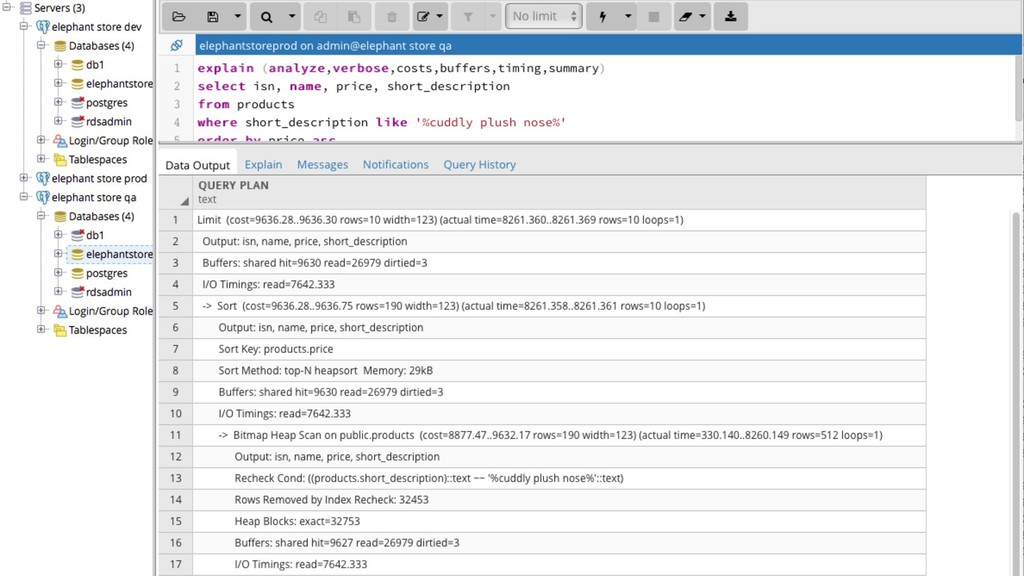
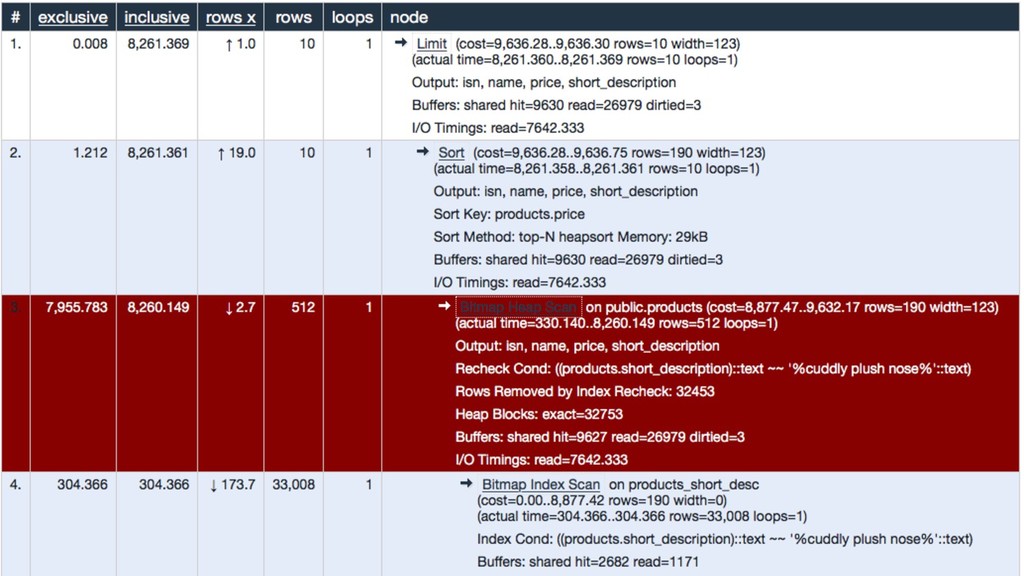
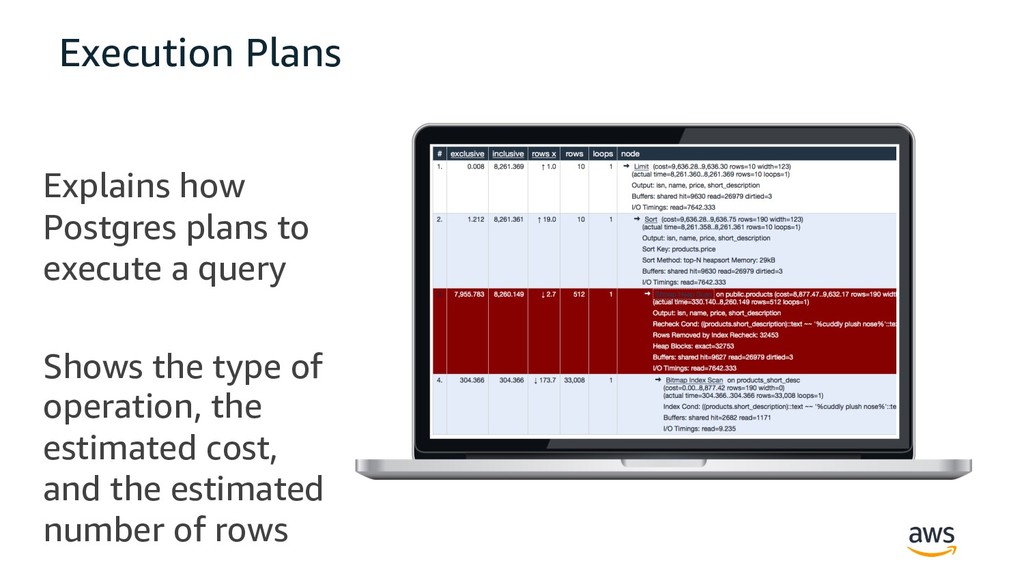
  29. Execution Plans Explains how Postgres plans to execute a query

    Shows the type of operation, the estimated cost, and the estimated number of rows
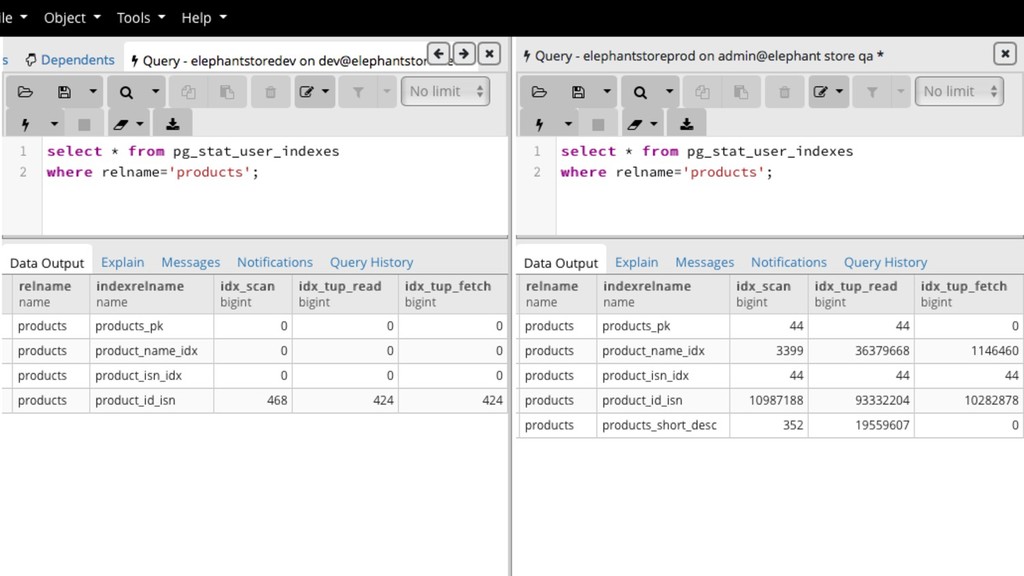
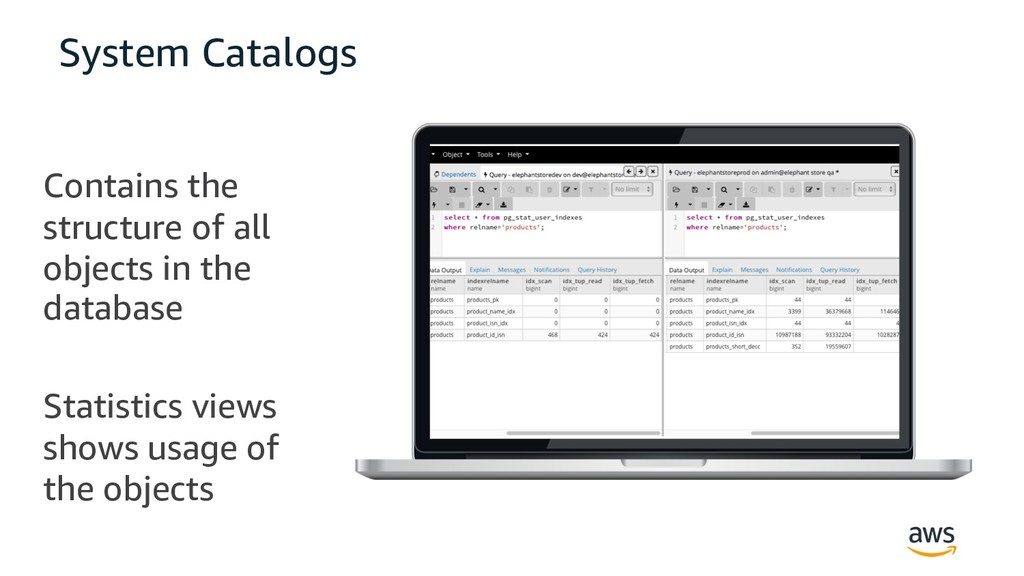
  30. System Catalogs Contains the structure of all objects in the

    database Statistics views shows usage of the objects
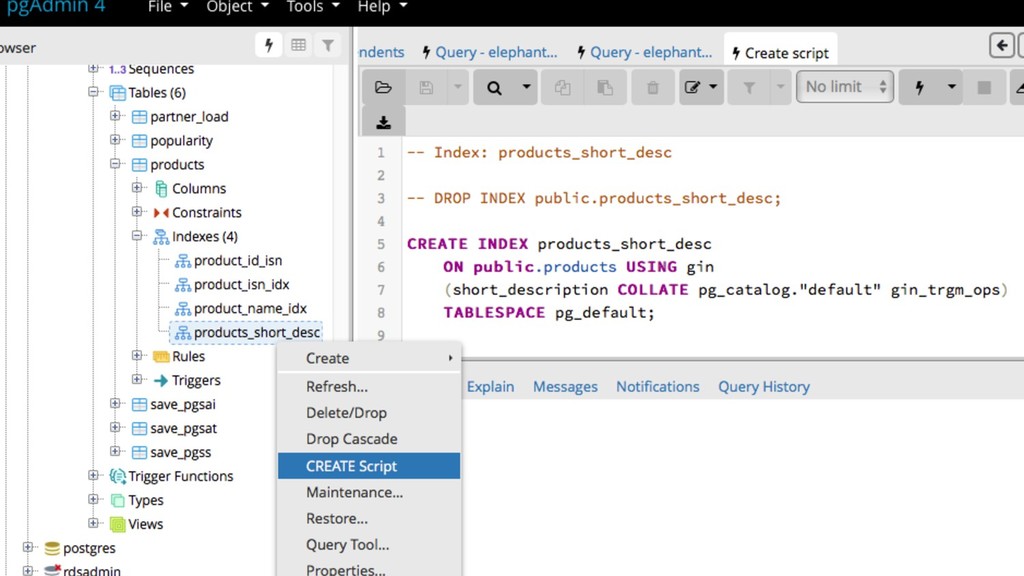
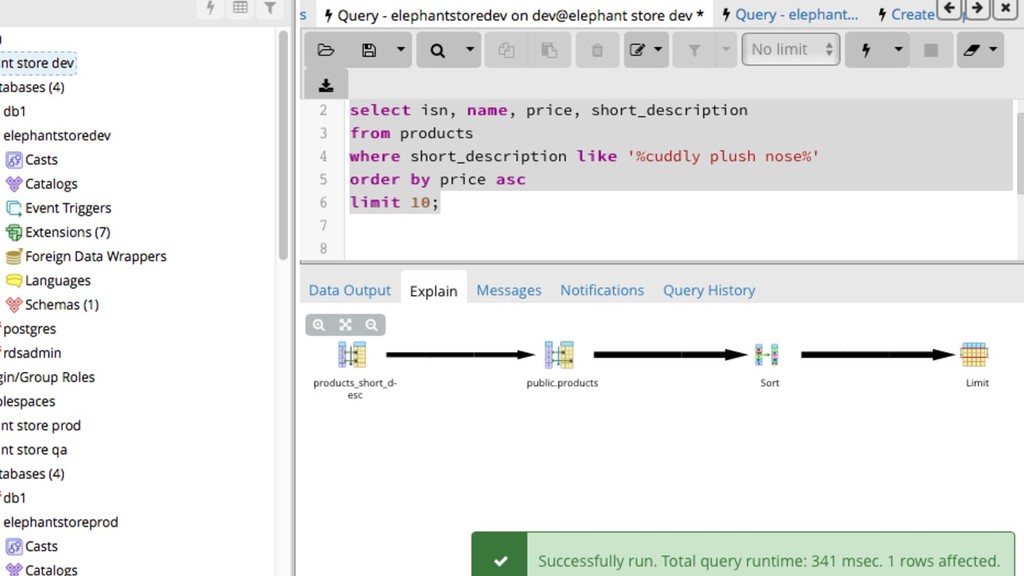
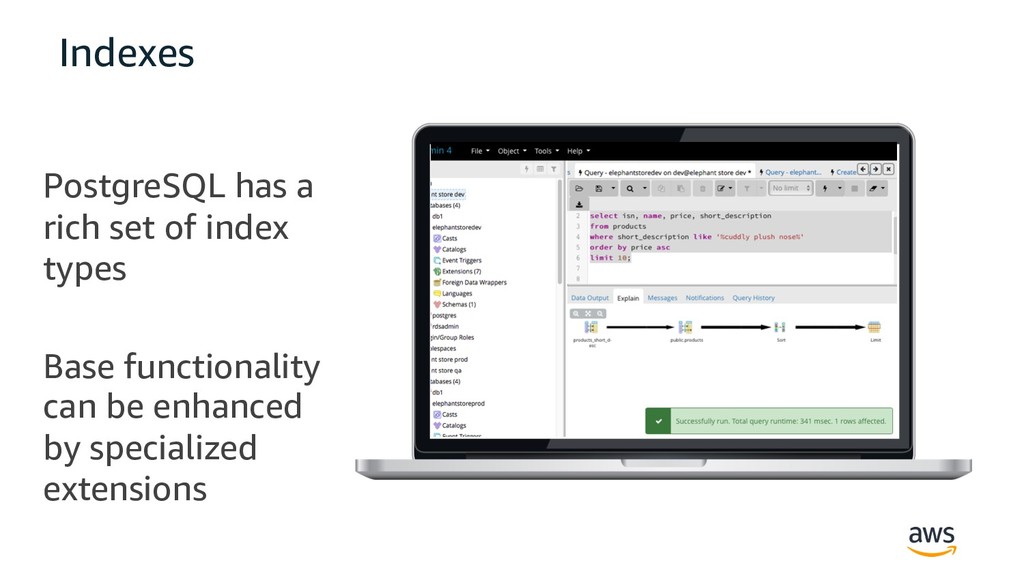
  31. Indexes PostgreSQL has a rich set of index types Base

    functionality can be enhanced by specialized extensions
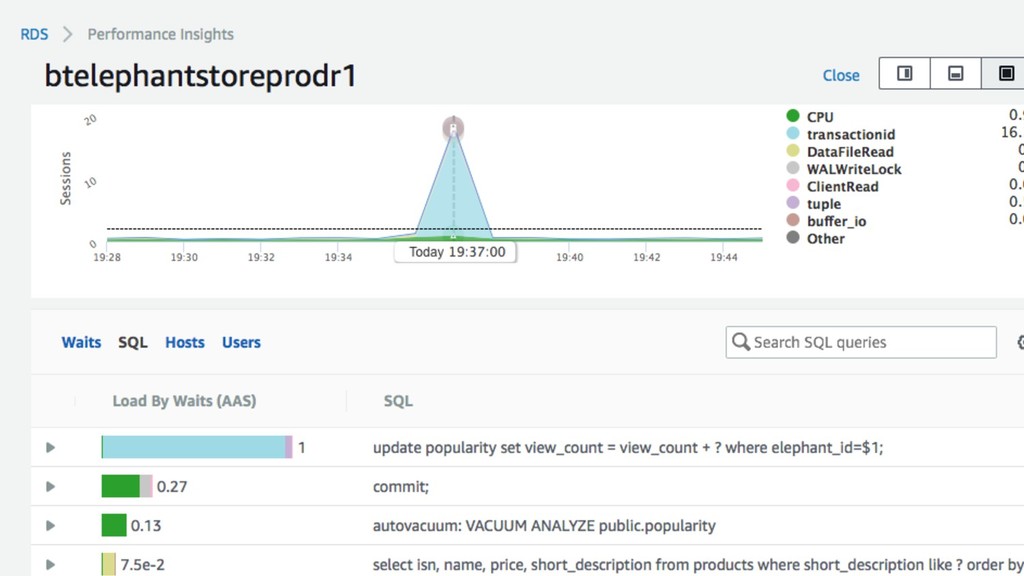
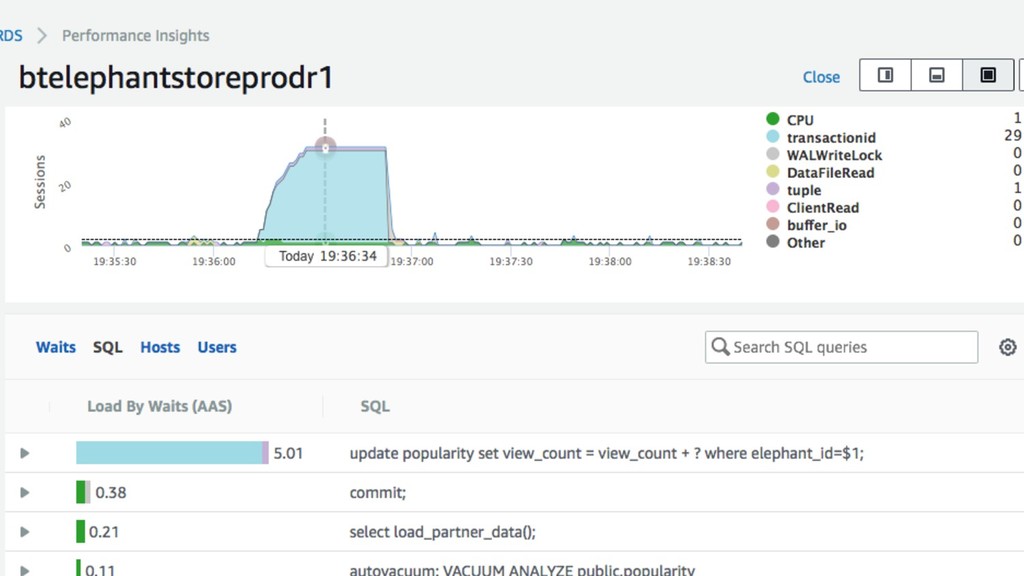
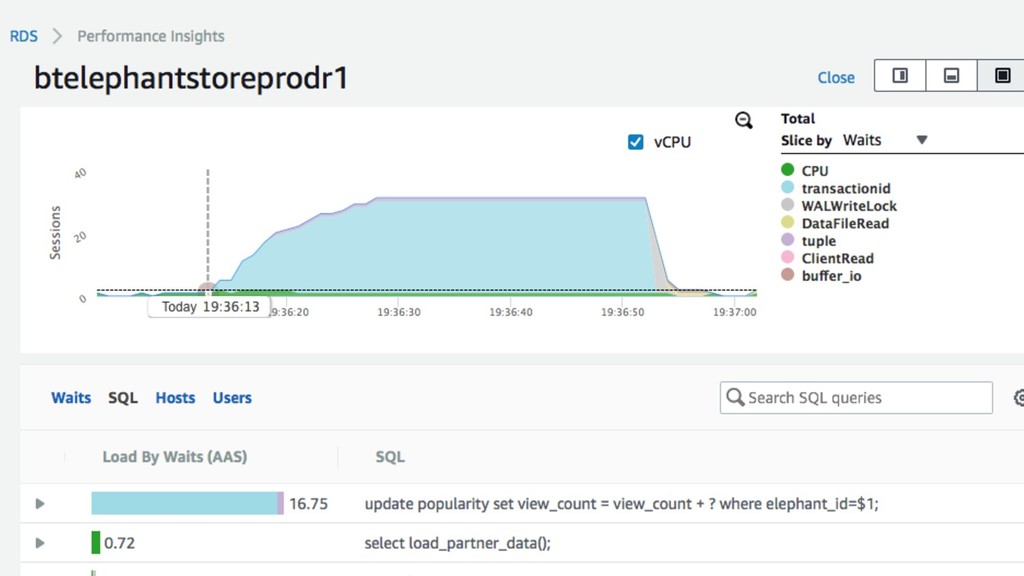
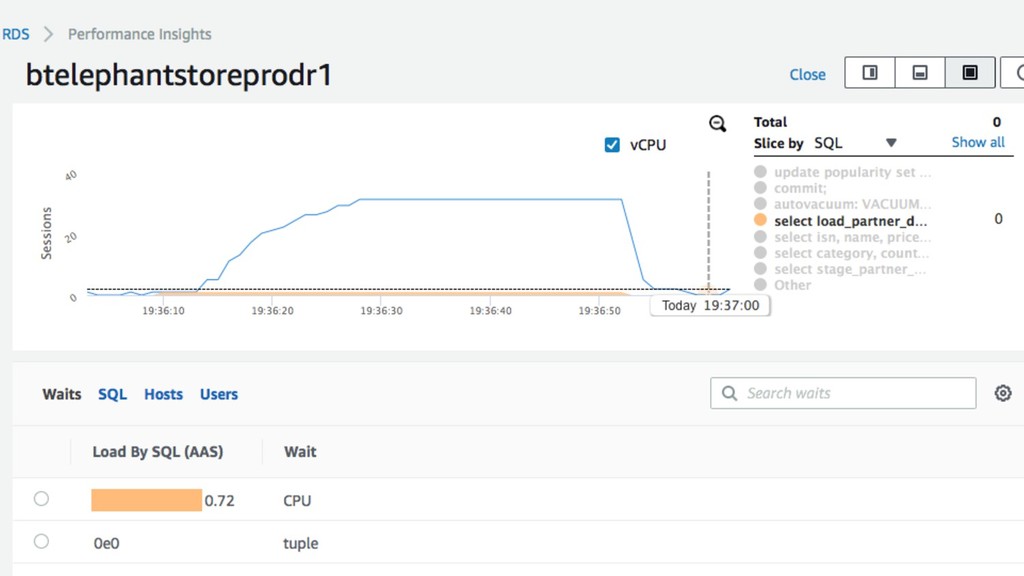
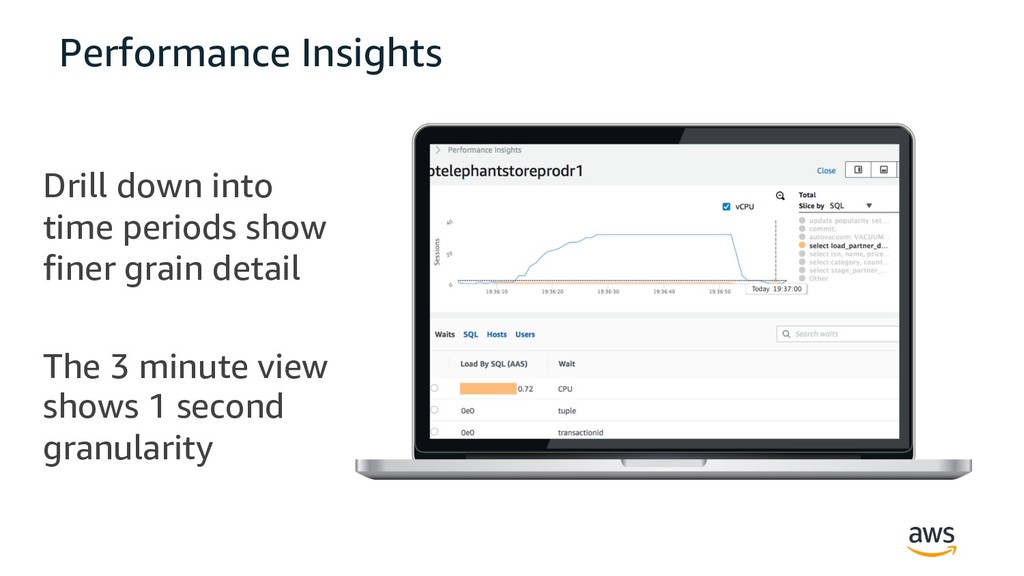
  32. Performance Insights Drill down into time periods show finer grain

    detail The 3 minute view shows 1 second granularity
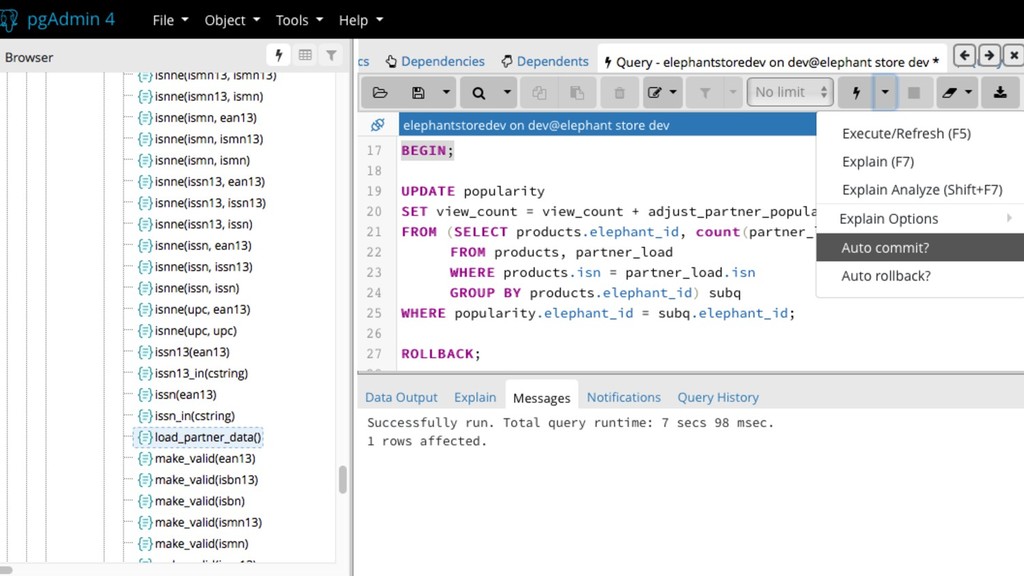
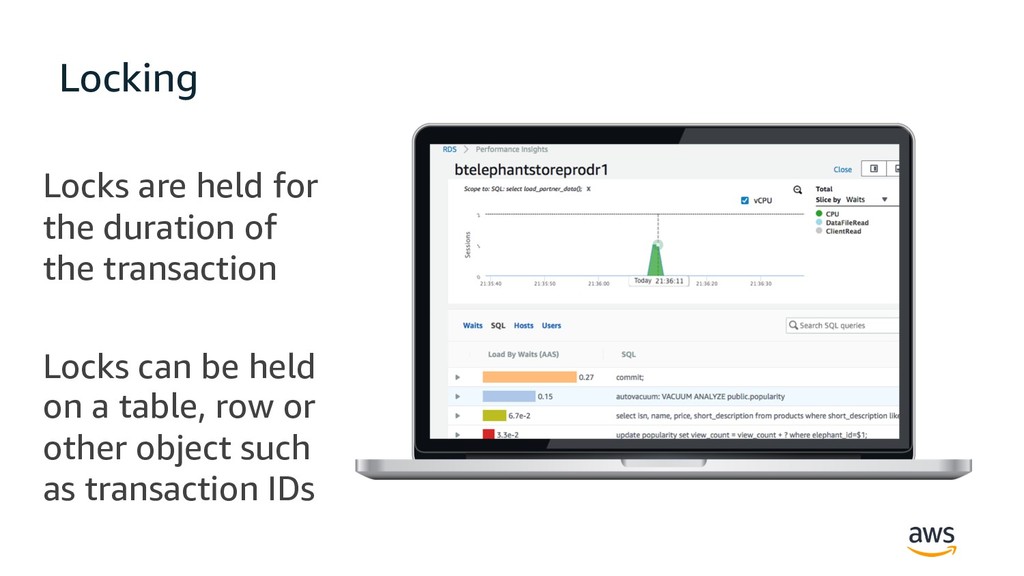
  33. Locking Locks are held for the duration of the transaction

    Locks can be held on a table, row or other object such as transaction IDs
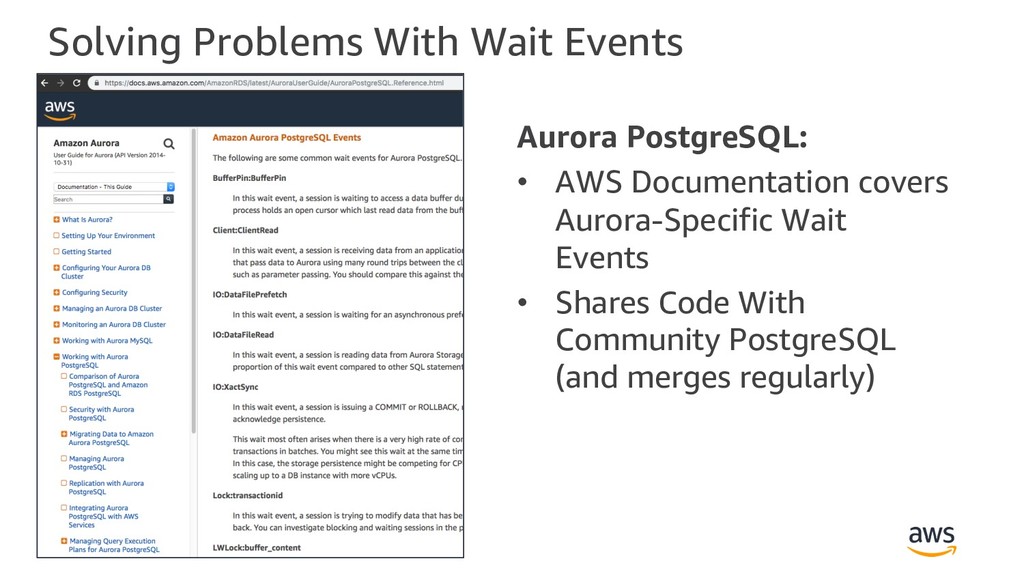
  34. Solving Problems With Wait Events Aurora PostgreSQL: • AWS Documentation

    covers Aurora-Specific Wait Events • Shares Code With Community PostgreSQL (and merges regularly)
  35. Solving Problems With Wait Events DataFileRead, buffer_io • I/O Read

    Path: Check SQL execution plans, optimize for fewer block reads. XactSync, WALWrite • I/O Write Path: Check commit rate, volume of change. transactionid, relation, etc. • Application Design: check pg_locks during contention. buffer_content • Hot Block in Memory: check foreign keys, optimize contention (e.g. schema redesign, fillfactor, etc).
  36. © 2019, Amazon Web Services, Inc. or its Affiliates. All

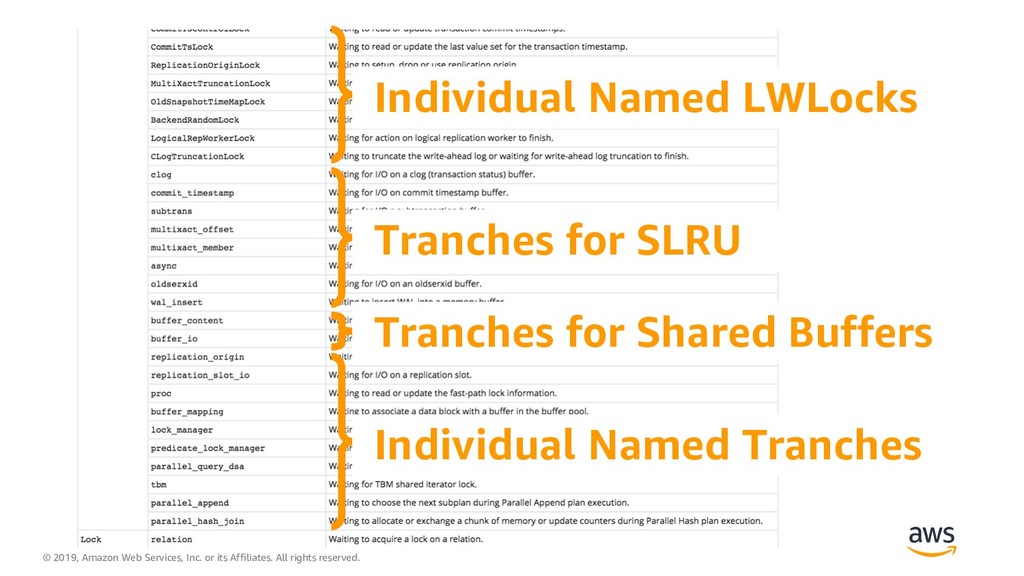
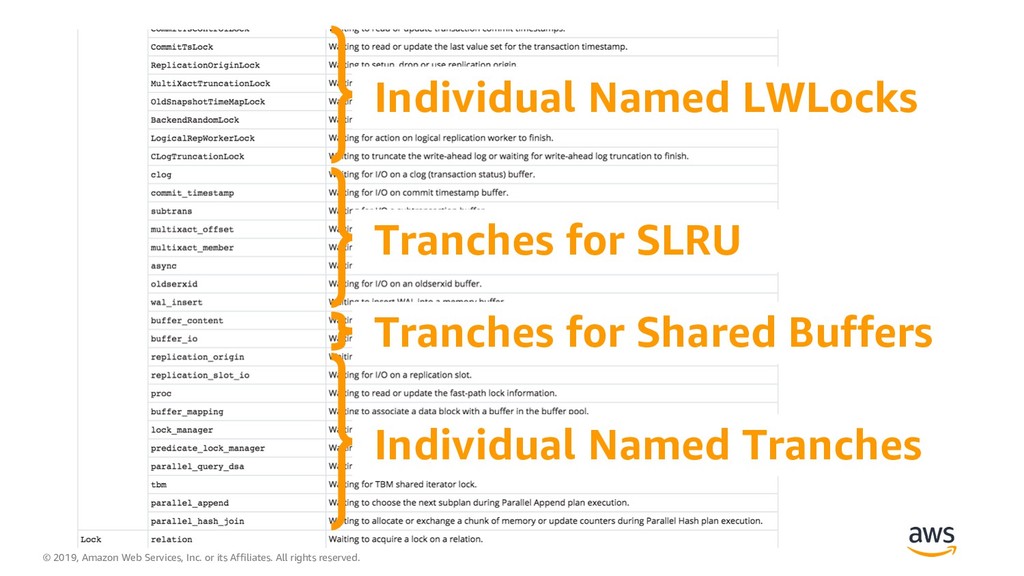
    rights reserved. Individual Named LWLocks Tranches for SLRU Tranches for Shared Buffers Individual Named Tranches
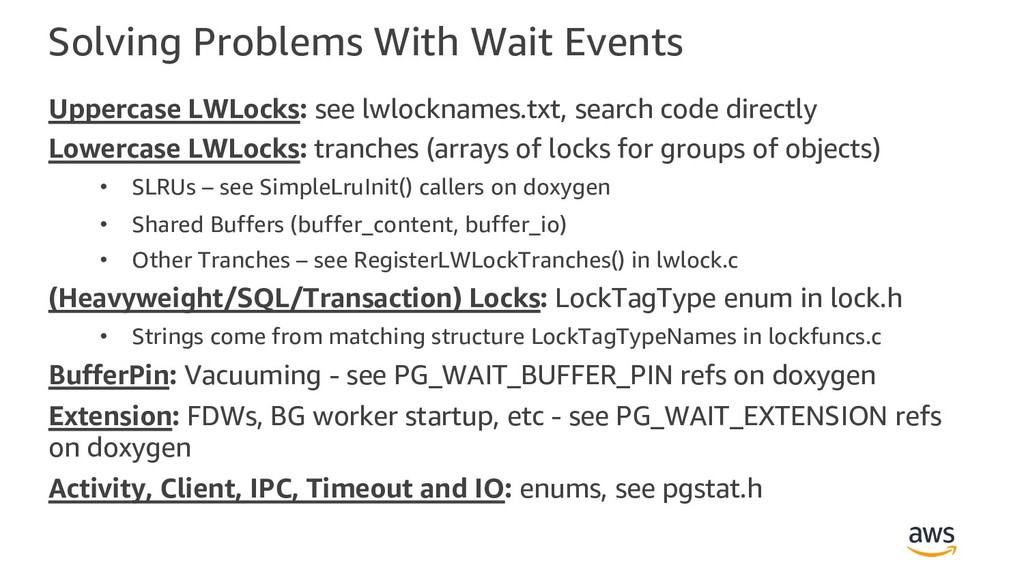
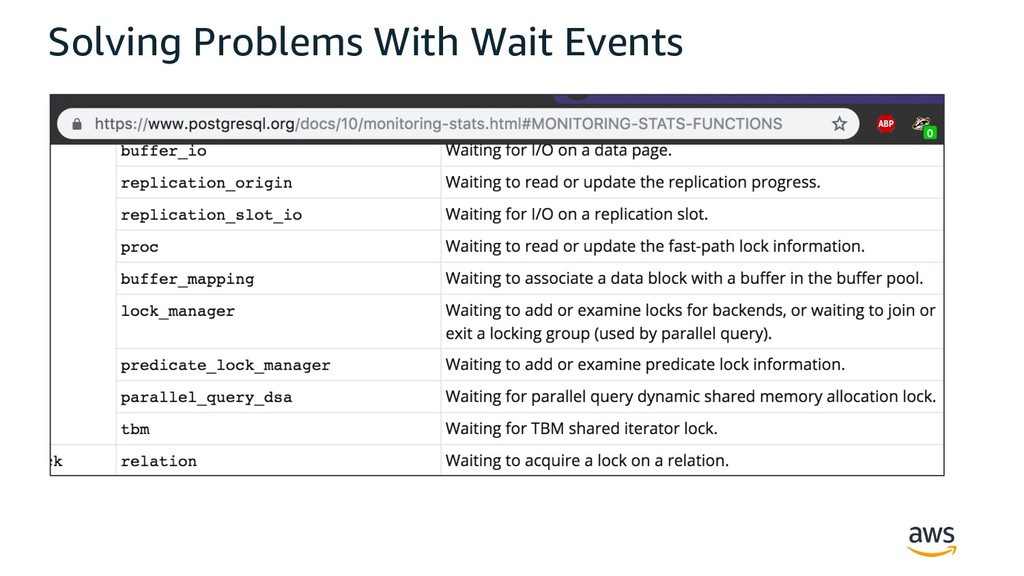
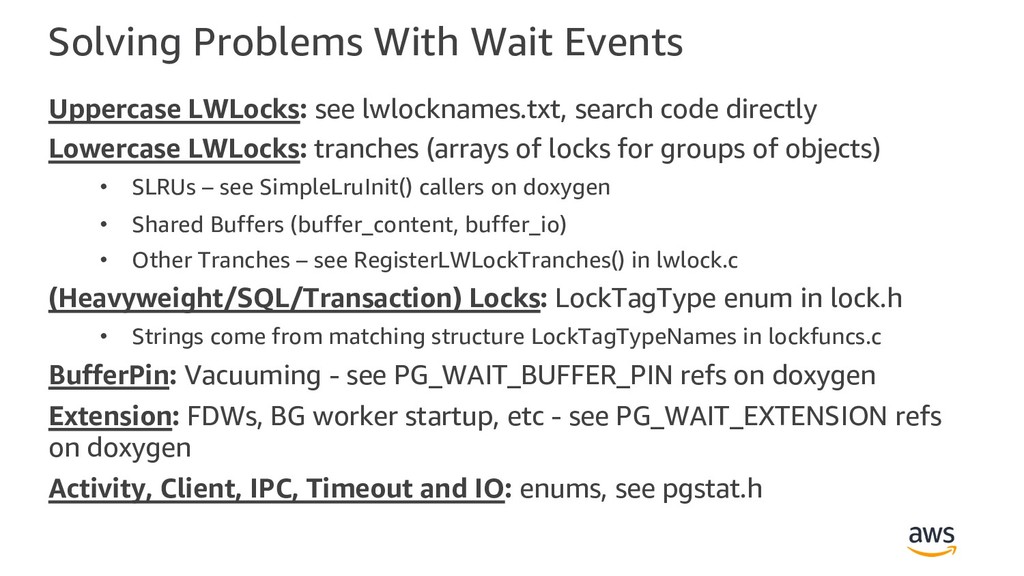
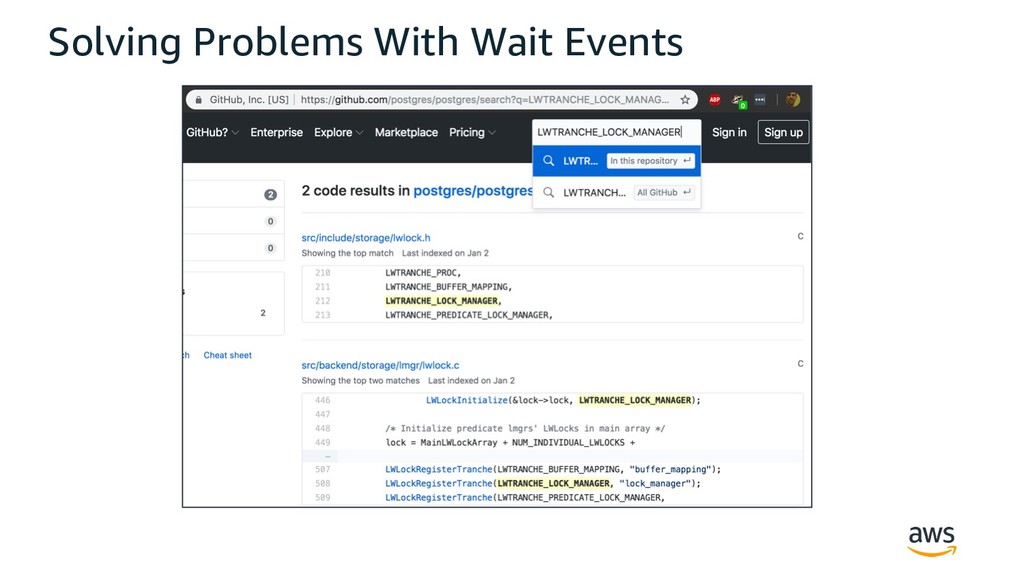
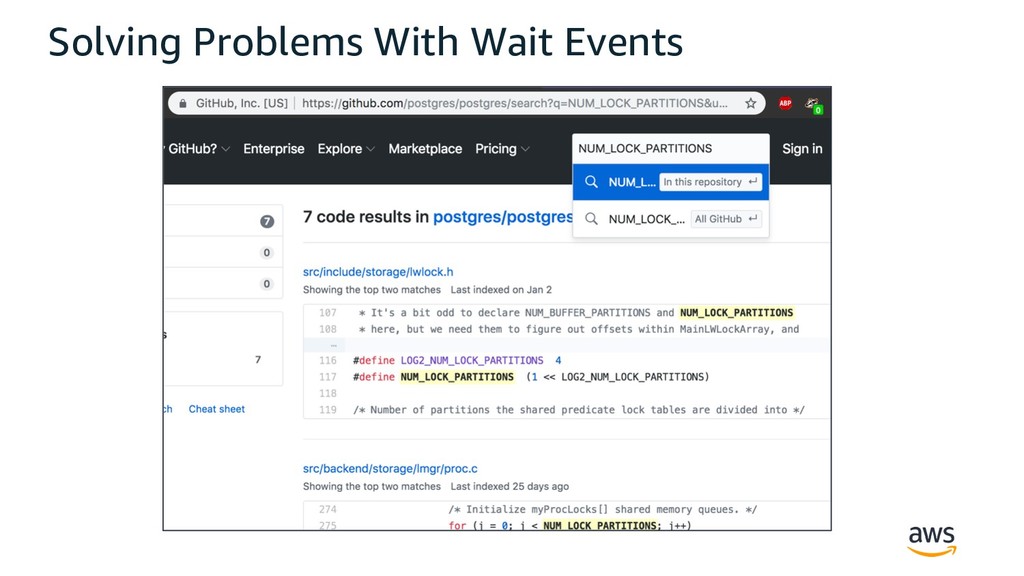
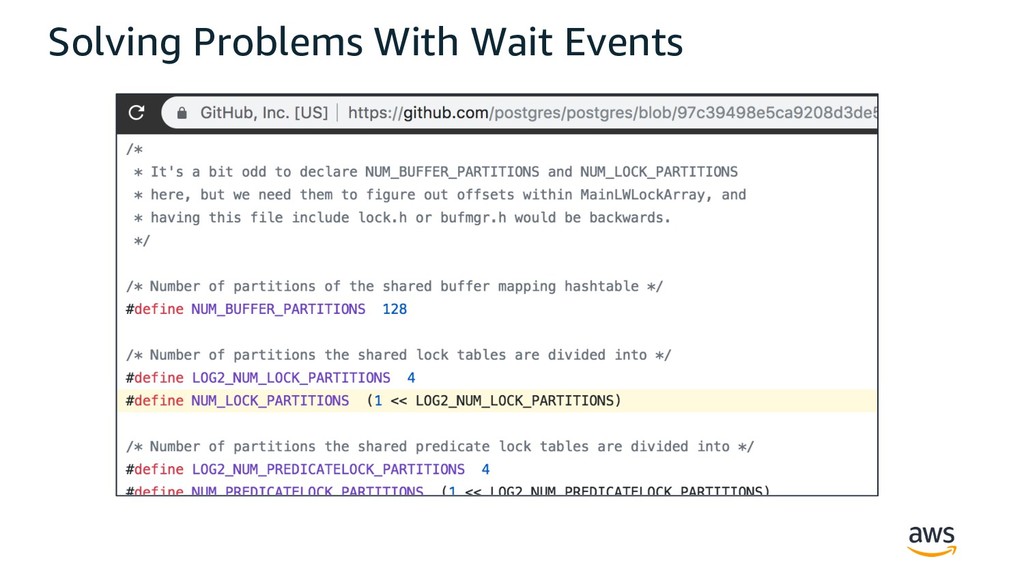
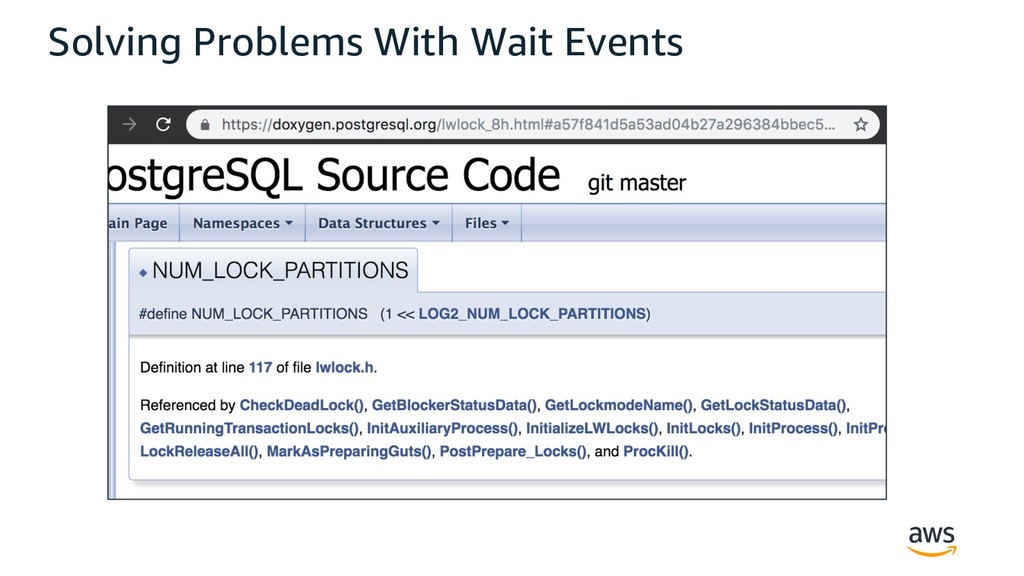
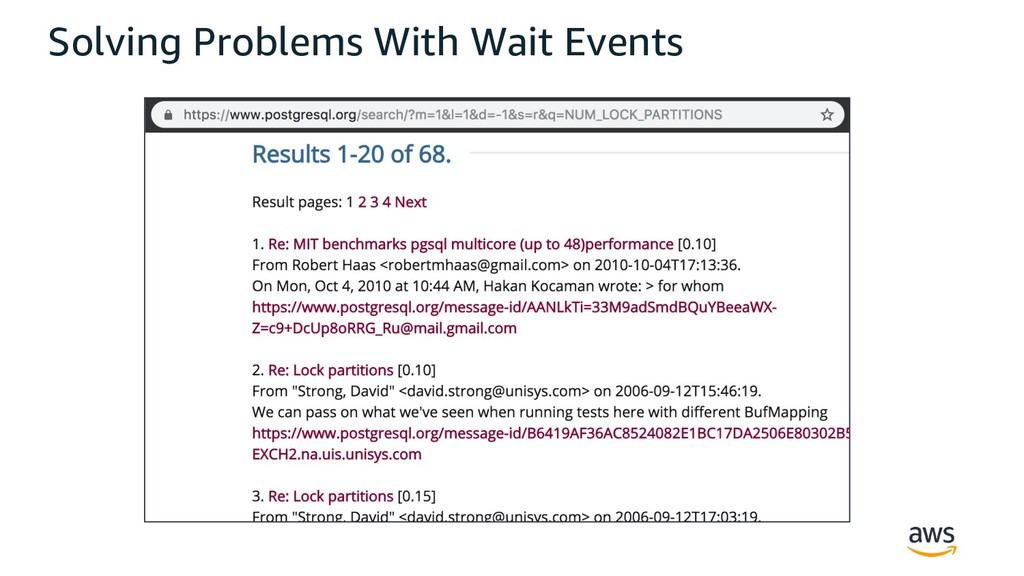
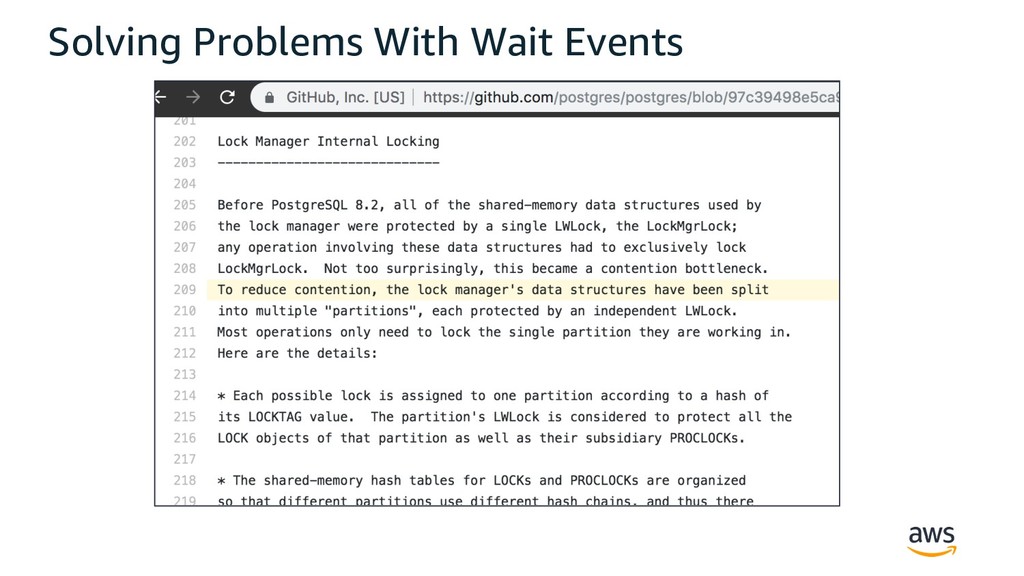
  37. Solving Problems With Wait Events Uppercase LWLocks: see lwlocknames.txt, search

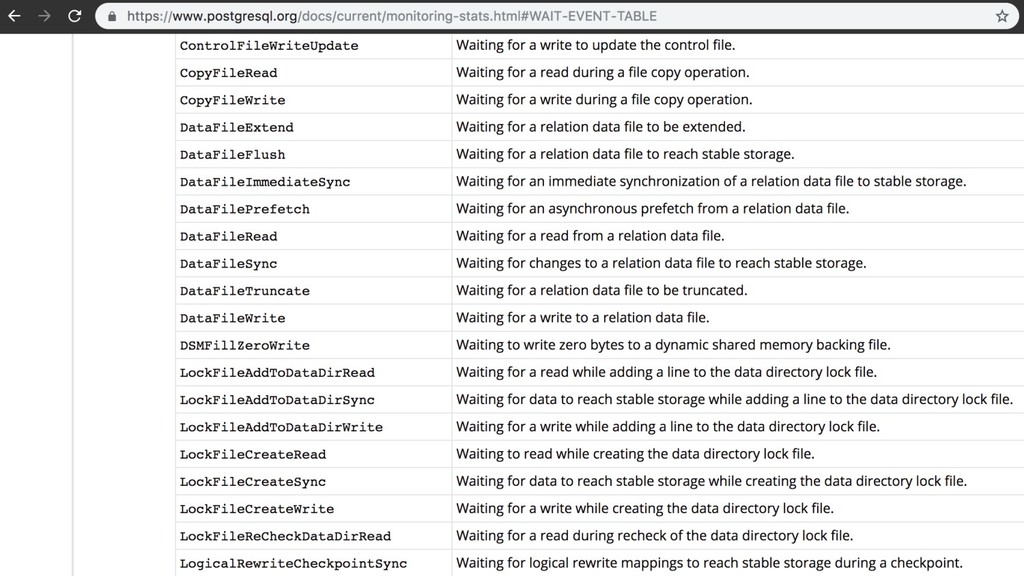
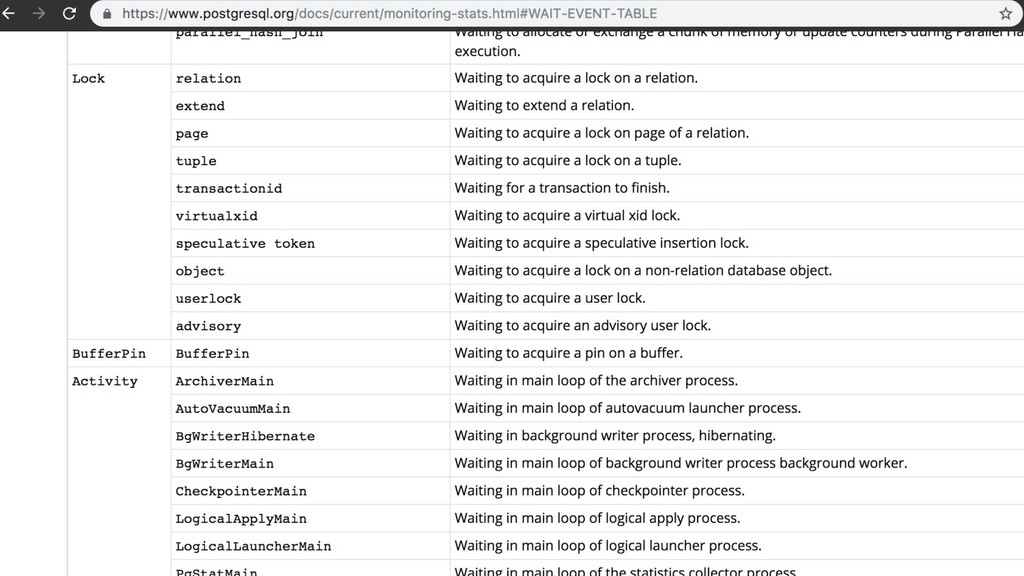
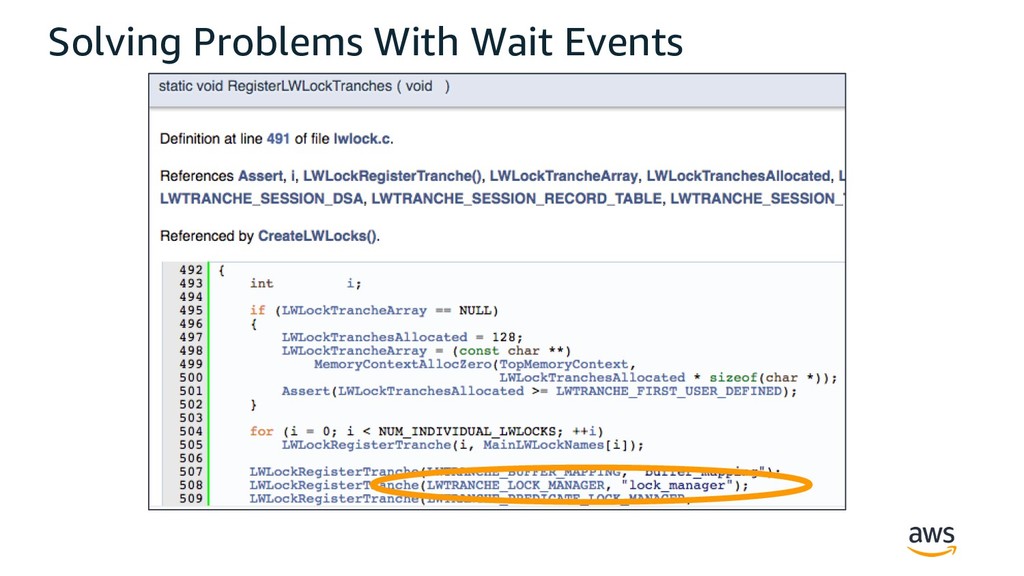
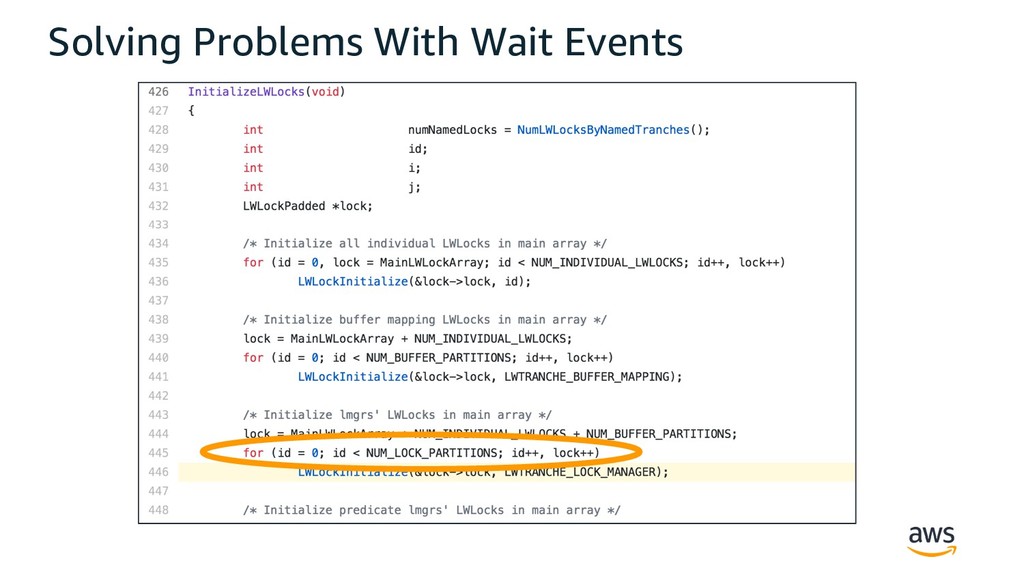
    code directly Lowercase LWLocks: tranches (arrays of locks for groups of objects) • SLRUs – see SimpleLruInit() callers on doxygen • Shared Buffers (buffer_content, buffer_io) • Other Tranches – see RegisterLWLockTranches() in lwlock.c (Heavyweight/SQL/Transaction) Locks: LockTagType enum in lock.h • Strings come from matching structure LockTagTypeNames in lockfuncs.c BufferPin: Vacuuming - see PG_WAIT_BUFFER_PIN refs on doxygen Extension: FDWs, BG worker startup, etc - see PG_WAIT_EXTENSION refs on doxygen Activity, Client, IPC, Timeout and IO: enums, see pgstat.h
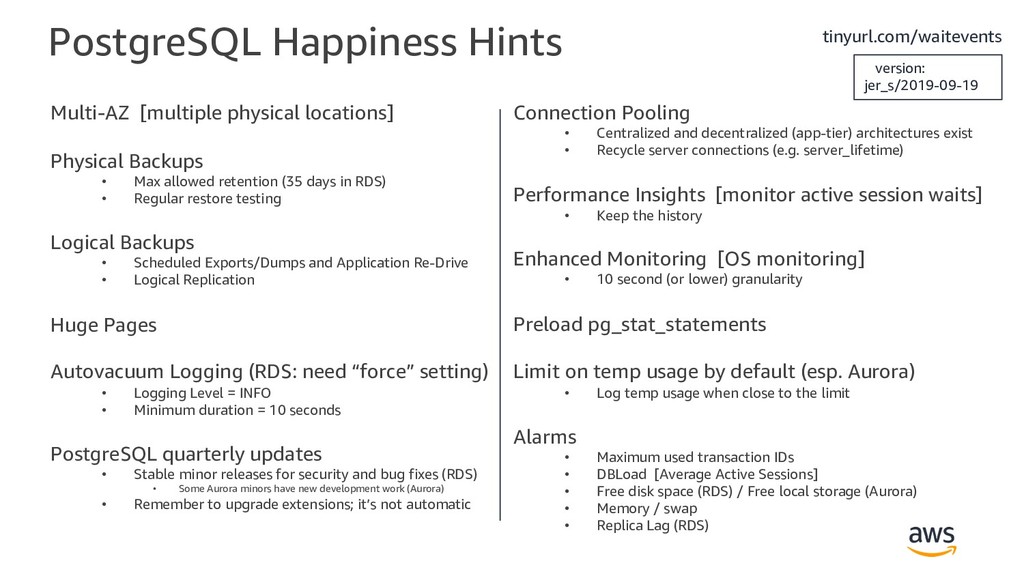
  38. Multi-AZ [multiple physical locations] Physical Backups • Max allowed retention

    (35 days in RDS) • Regular restore testing Logical Backups • Scheduled Exports/Dumps and Application Re-Drive • Logical Replication Huge Pages Autovacuum Logging (RDS: need “force” setting) • Logging Level = INFO • Minimum duration = 10 seconds PostgreSQL quarterly updates • Stable minor releases for security and bug fixes (RDS) • Some Aurora minors have new development work (Aurora) • Remember to upgrade extensions; it’s not automatic Connection Pooling • Centralized and decentralized (app-tier) architectures exist • Recycle server connections (e.g. server_lifetime) Performance Insights [monitor active session waits] • Keep the history Enhanced Monitoring [OS monitoring] • 10 second (or lower) granularity Preload pg_stat_statements Limit on temp usage by default (esp. Aurora) • Log temp usage when close to the limit Alarms • Maximum used transaction IDs • DBLoad [Average Active Sessions] • Free disk space (RDS) / Free local storage (Aurora) • Memory / swap • Replica Lag (RDS) PostgreSQL Happiness Hints version: jer_s/2019-09-19 tinyurl.com/waitevents
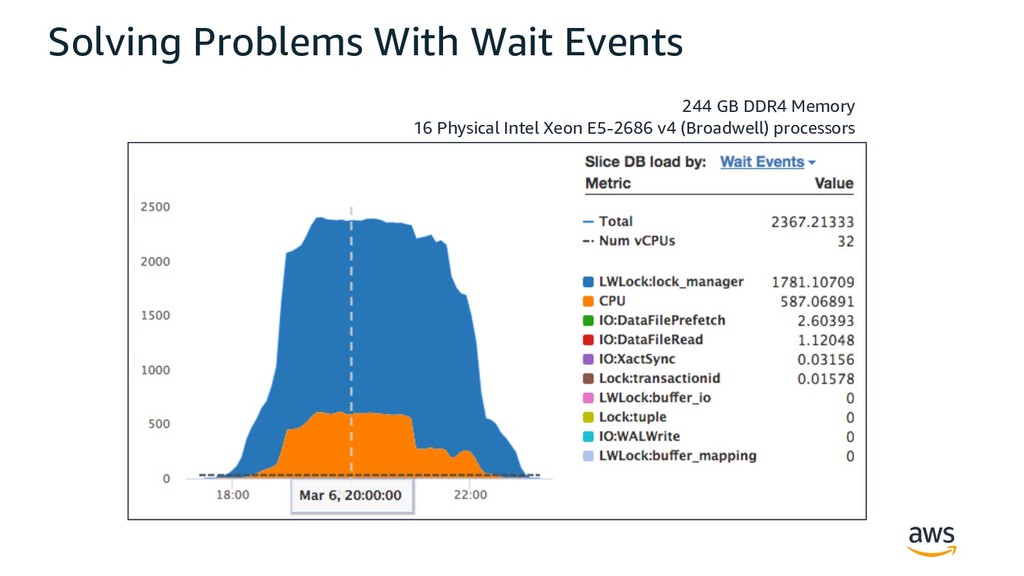
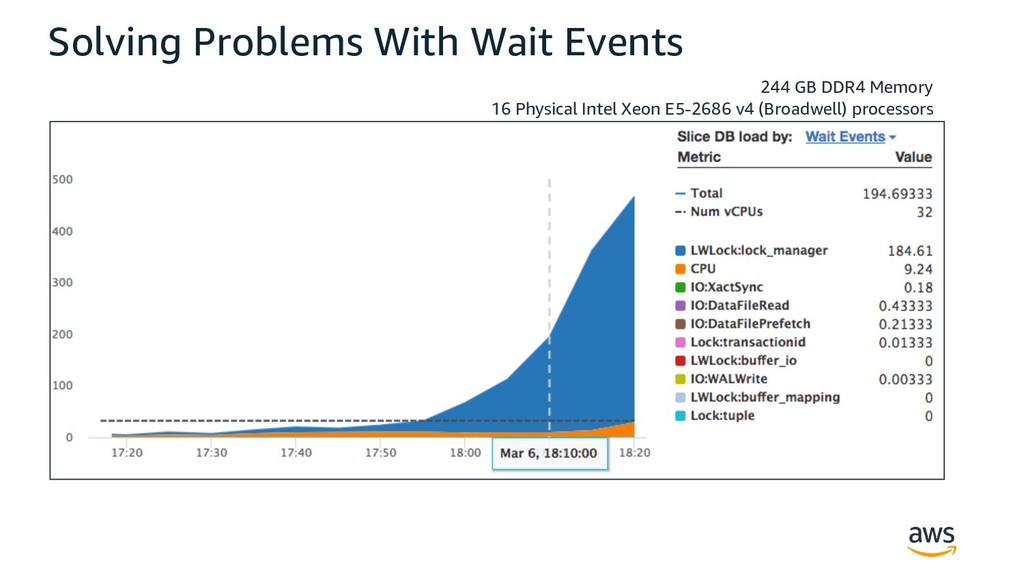
  39. Solving Problems With Wait Events 244 GB DDR4 Memory 16

    Physical Intel Xeon E5-2686 v4 (Broadwell) processors
  40. Solving Problems With Wait Events 244 GB DDR4 Memory 16

    Physical Intel Xeon E5-2686 v4 (Broadwell) processors
  41. © 2019, Amazon Web Services, Inc. or its Affiliates. All

    rights reserved. Individual Named LWLocks Tranches for SLRU Tranches for Shared Buffers Individual Named Tranches
  42. Solving Problems With Wait Events Uppercase LWLocks: see lwlocknames.txt, search

    code directly Lowercase LWLocks: tranches (arrays of locks for groups of objects) • SLRUs – see SimpleLruInit() callers on doxygen • Shared Buffers (buffer_content, buffer_io) • Other Tranches – see RegisterLWLockTranches() in lwlock.c (Heavyweight/SQL/Transaction) Locks: LockTagType enum in lock.h • Strings come from matching structure LockTagTypeNames in lockfuncs.c BufferPin: Vacuuming - see PG_WAIT_BUFFER_PIN refs on doxygen Extension: FDWs, BG worker startup, etc - see PG_WAIT_EXTENSION refs on doxygen Activity, Client, IPC, Timeout and IO: enums, see pgstat.h