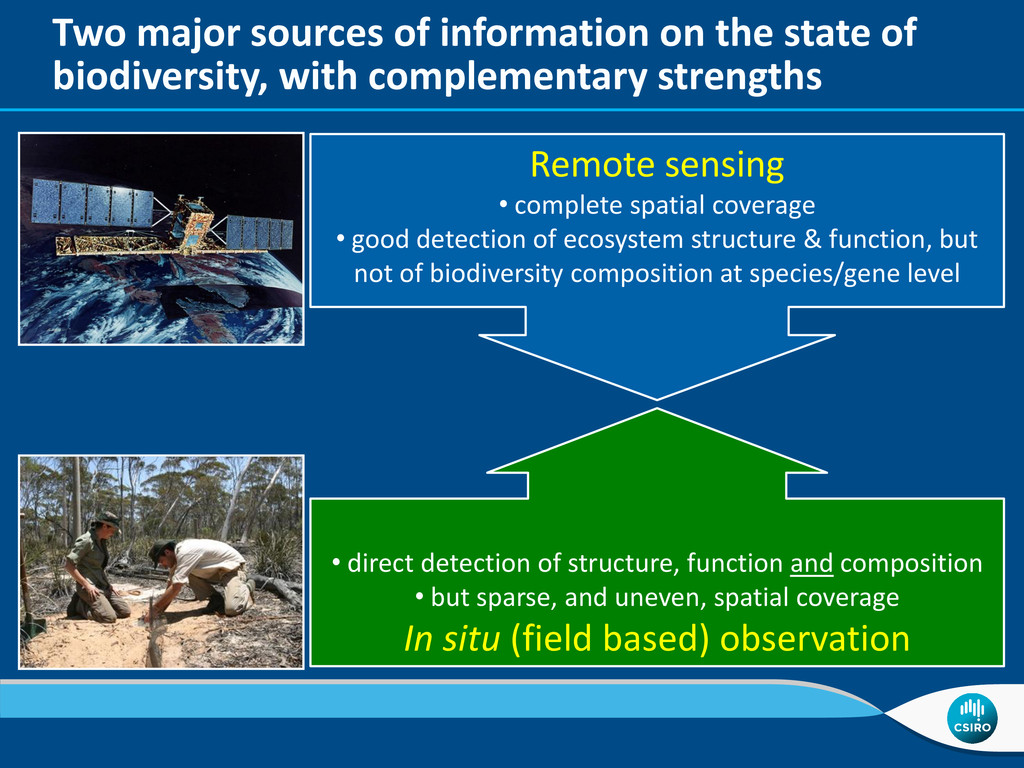
with complementary strengths • direct detection of structure, function and composition • but sparse, and uneven, spatial coverage In situ (field based) observation Remote sensing • complete spatial coverage • good detection of ecosystem structure & function, but not of biodiversity composition at species/gene level
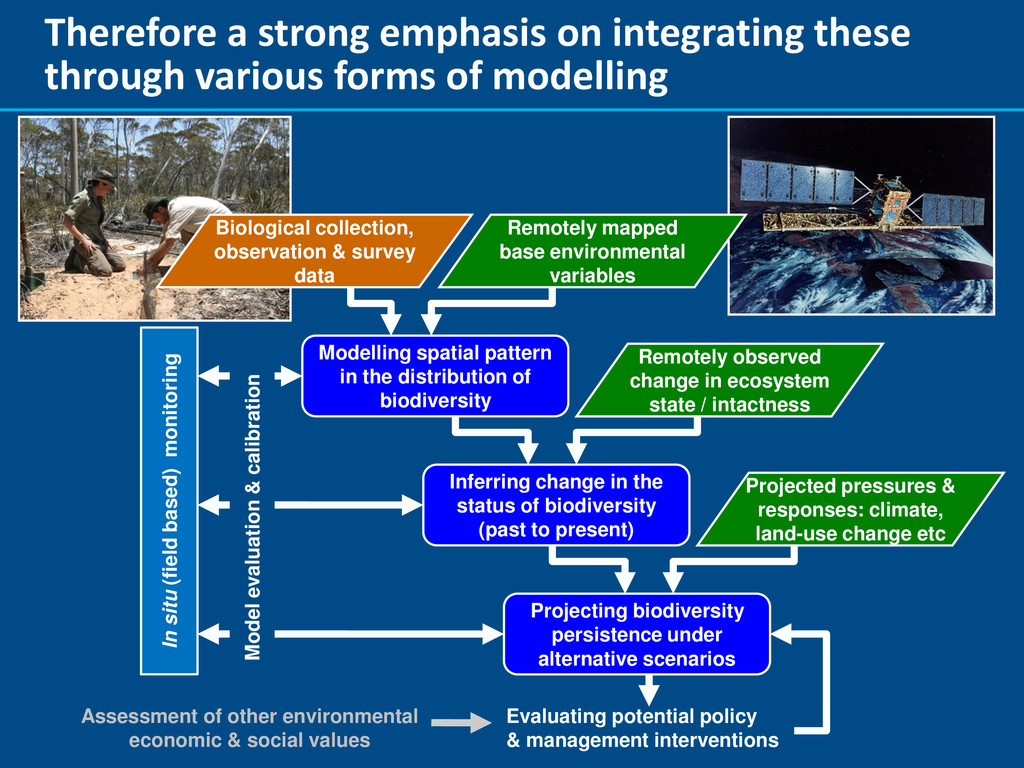
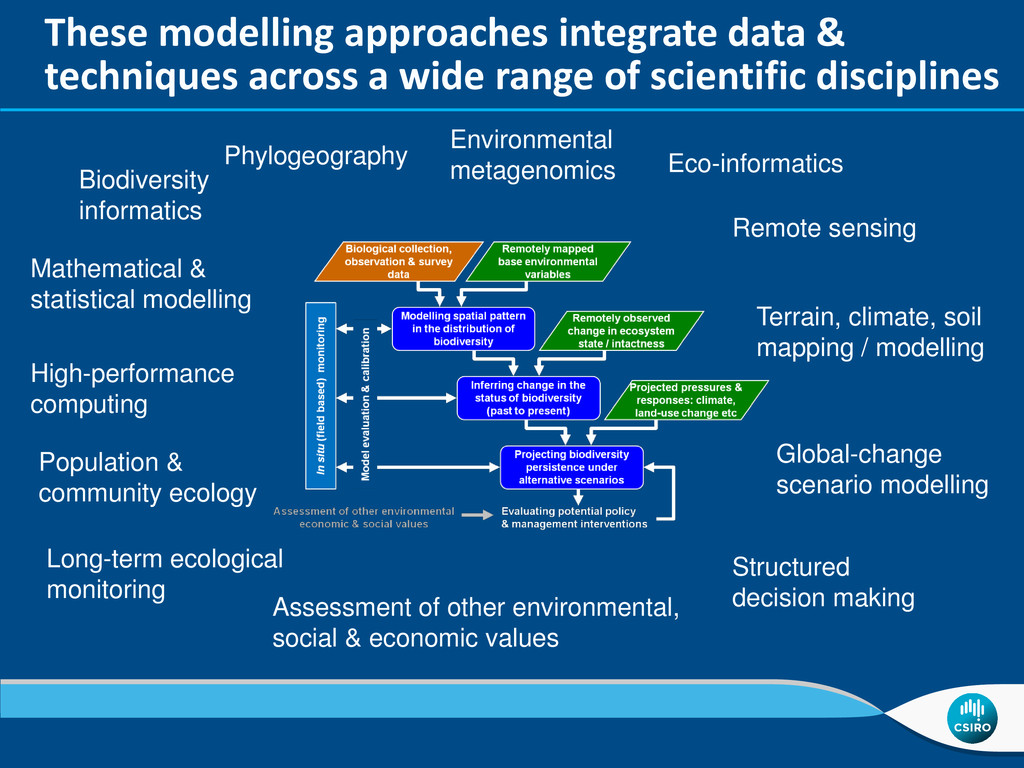
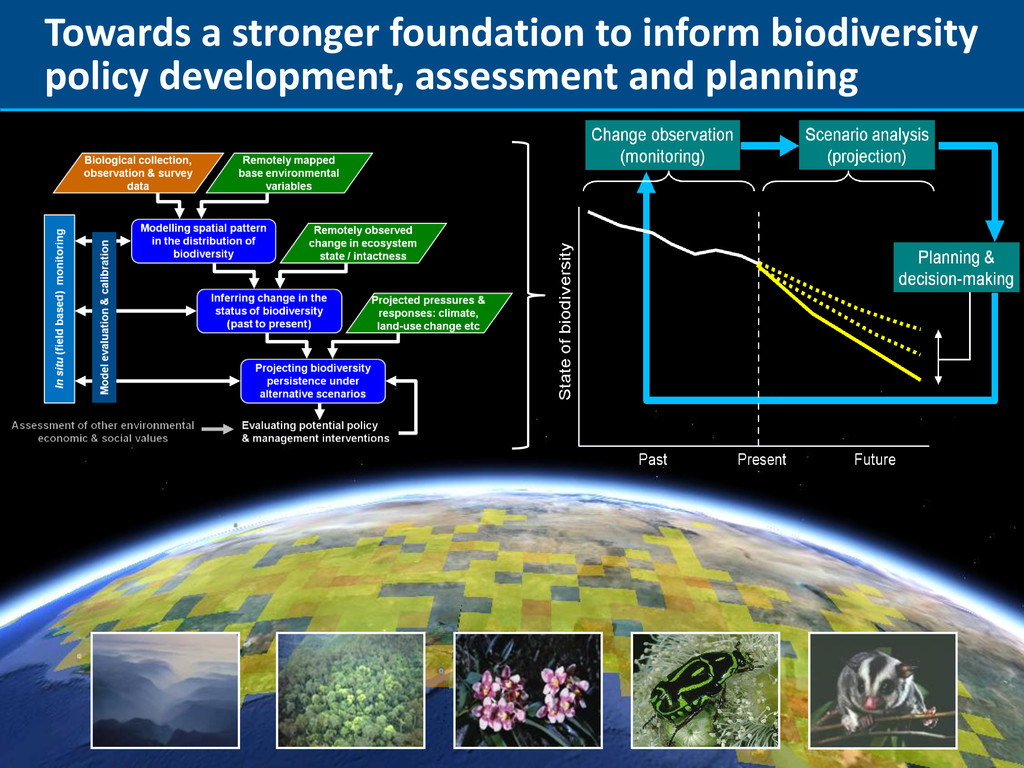
of modelling Remotely observed change in ecosystem state / intactness Projected pressures & responses: climate, land-use change etc Remotely mapped base environmental variables Modelling spatial pattern in the distribution of biodiversity Inferring change in the status of biodiversity (past to present) Projecting biodiversity persistence under alternative scenarios Biological collection, observation & survey data In situ (field based) monitoring Evaluating potential policy & management interventions Model evaluation & calibration Assessment of other environmental economic & social values
of Applied Ecology Individual species distribution (niche) modelling Simultaneous multi-response modelling of multiple species “Assemble first, predict later” techniques Macroecological modelling of collective biodiversity properties (richness, compositional turnover etc) • interested in individual species of particular concern • reasonable number of records per species • interested in biodiversity as a whole • huge number of species, each with few (or no) records “Predict first, assemble later” techniques
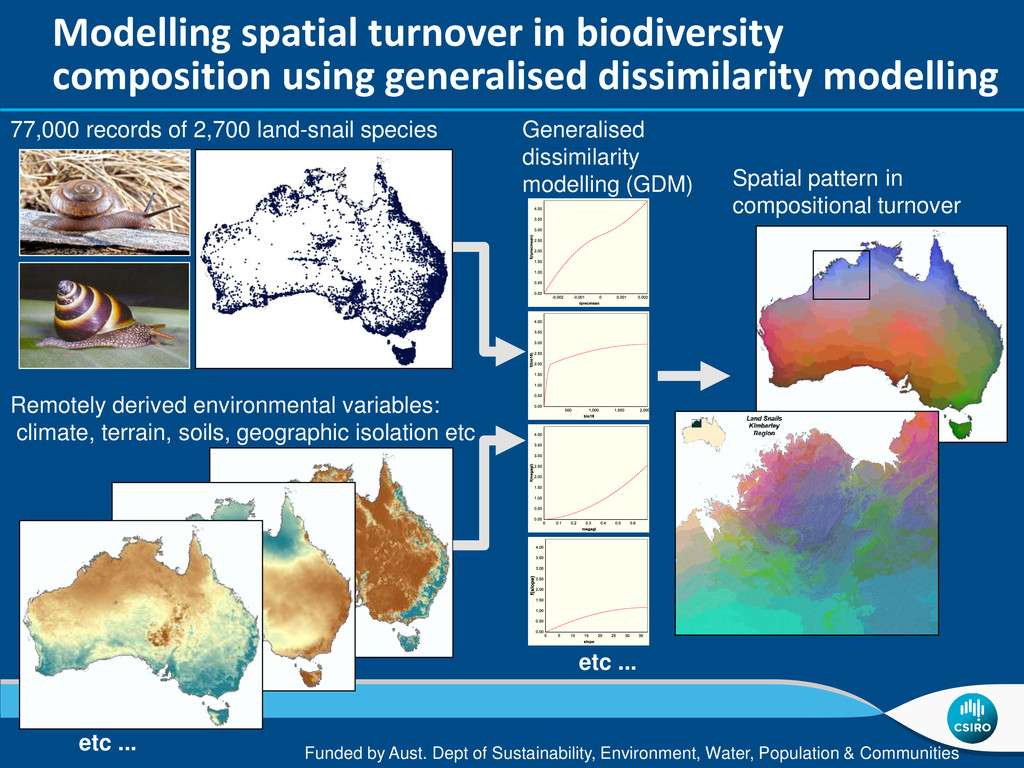
77,000 records of 2,700 land-snail species Spatial pattern in compositional turnover Funded by Aust. Dept of Sustainability, Environment, Water, Population & Communities Generalised dissimilarity modelling (GDM) Modelling spatial turnover in biodiversity composition using generalised dissimilarity modelling etc ... etc ...
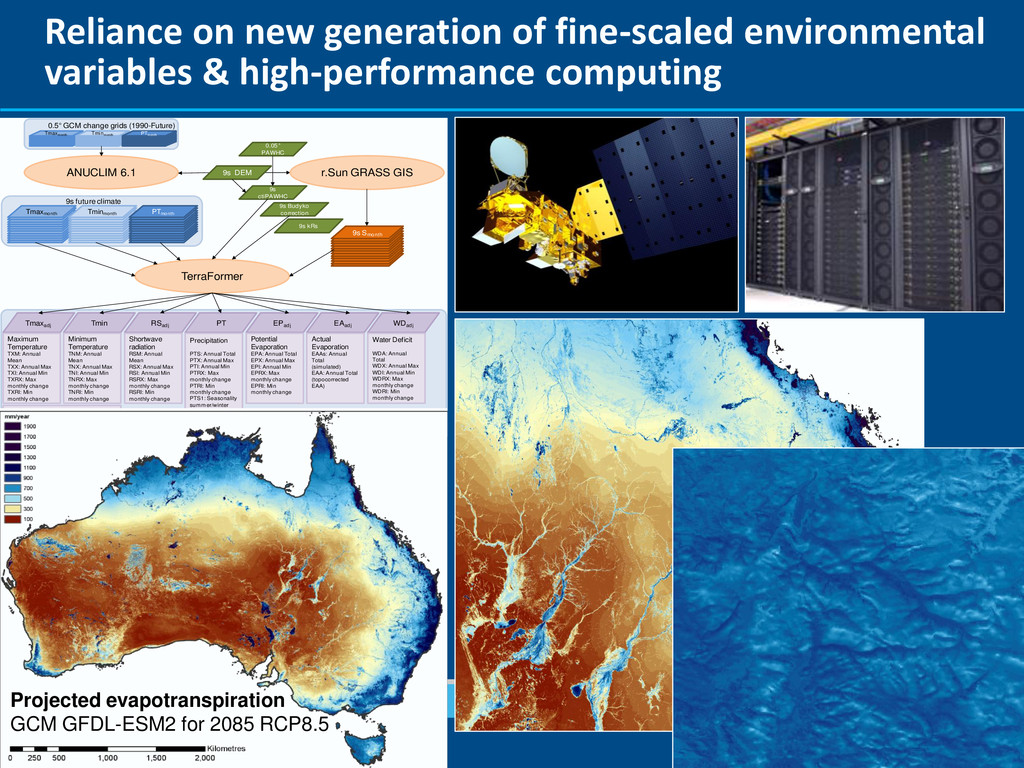
computing Tmaxadj Tmaxmonth Tminmonth PTmonth 0.5 GCM change grids (1990-Future) ANUCLIM 6.1 TerraFormer Tmaxmonth Tminmonth PTmonth 9s future climate 9s ctiPAWHC 0.05 PAWHC 9s Budyko correction 9s DEM 9s kRs r.Sun GRASS GIS 9s Smonth Tmin RSadj PT EPadj EAadj Minimum Temperature TNM: Annual Mean TNX: Annual Max TNI: Annual Min TNRX: Max monthly change TNRI: Min monthly change Maximum Temperature TXM: Annual Mean TXX: Annual Max TXI: Annual Min TXRX: Max monthly change TXRI: Min monthly change Shortwave radiation RSM: Annual Mean RSX: Annual Max RSI: Annual Min RSRX: Max monthly change RSRI: Min monthly change Precipitation PTS: Annual Total PTX: Annual Max PTI: Annual Min PTRX: Max monthly change PTRI: Min monthly change PTS1: Seasonality summer/winter PTS2: Seasonality spring/autumn Potential Evaporation EPA: Annual Total EPX: Annual Max EPI: Annual Min EPRX: Max monthly change EPRI: Min monthly change Actual Evaporation EAAs: Annual Total (simulated) EAA: Annual Total (topocorrected EAA) WDadj Water Deficit WDA: Annual Total WDX: Annual Max WDI: Annual Min WDRX: Max monthly change WDRI: Min monthly change Temperature Range TRA: Annual Range TRX: Annual Max TRI: Annual Min 9s Terrain Adjusted Climate Projected evapotranspiration GCM GFDL-ESM2 for 2085 RCP8.5
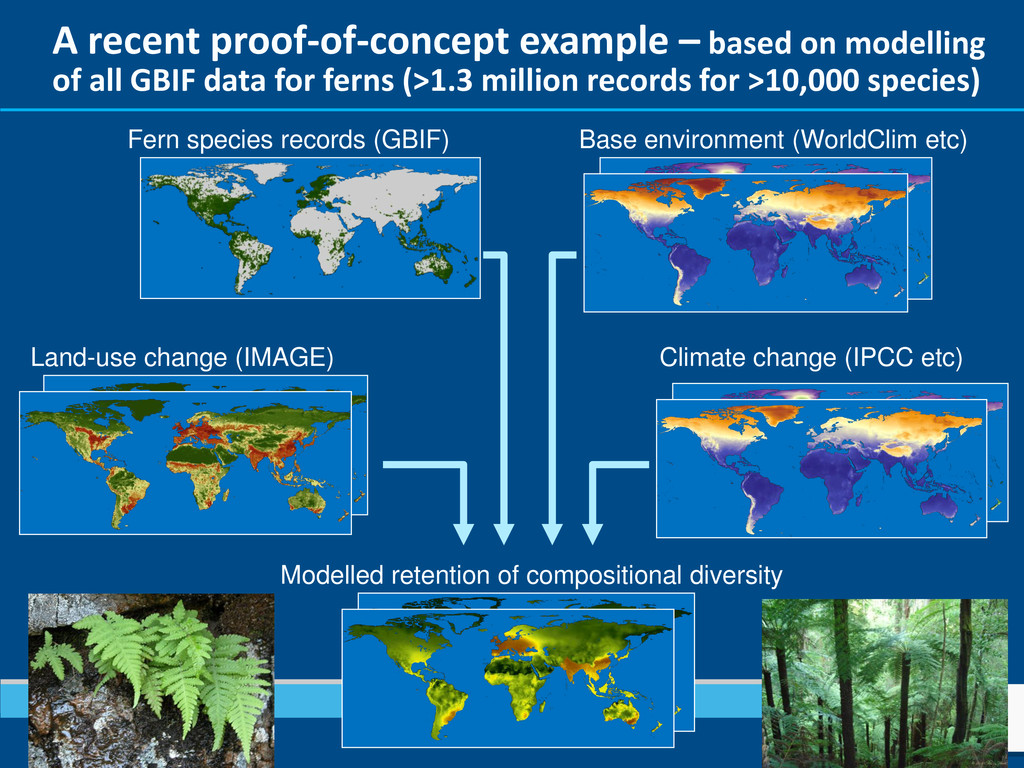
GBIF data for ferns (>1.3 million records for >10,000 species) Land-use change (IMAGE) Climate change (IPCC etc) Fern species records (GBIF) Base environment (WorldClim etc) Modelled retention of compositional diversity