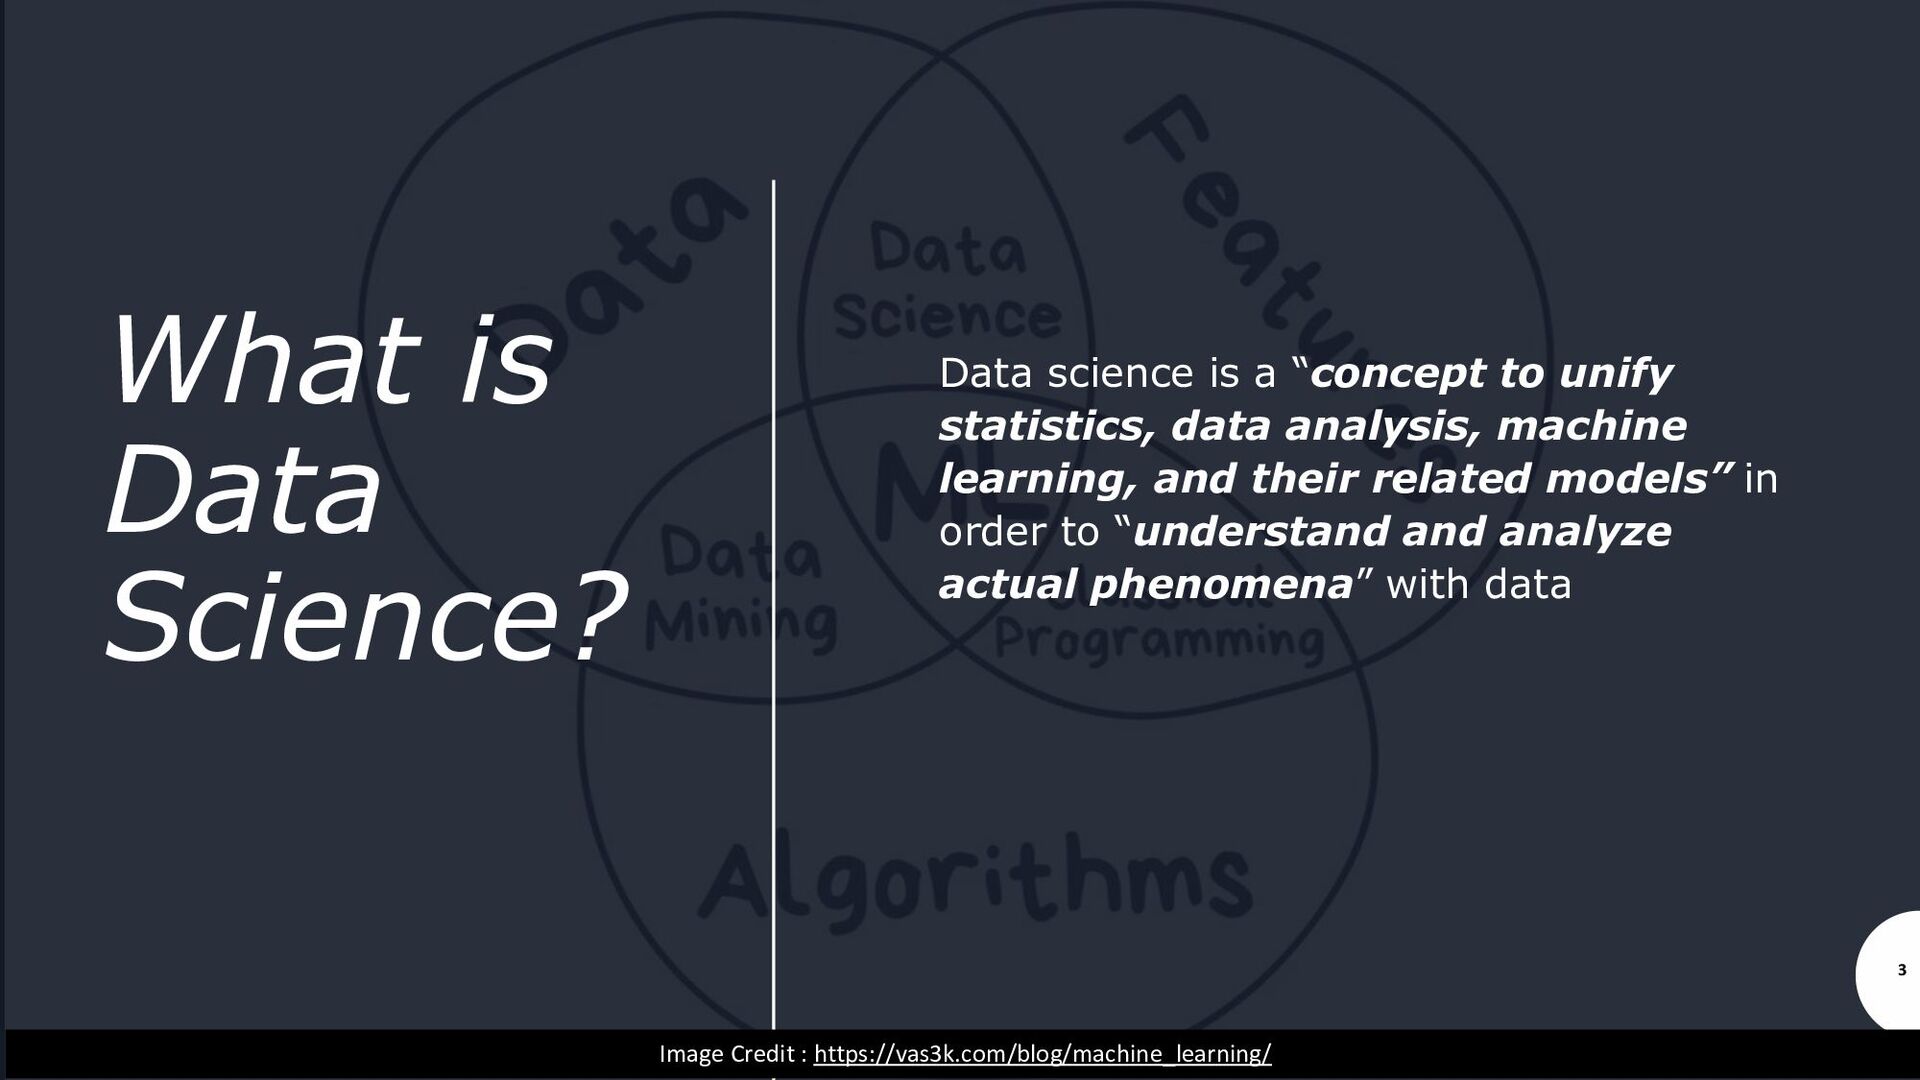
unify statistics, data analysis, machine learning, and their related models” in order to “understand and analyze actual phenomena” with data 3 Image Credit : https://vas3k.com/blog/machine_learning/
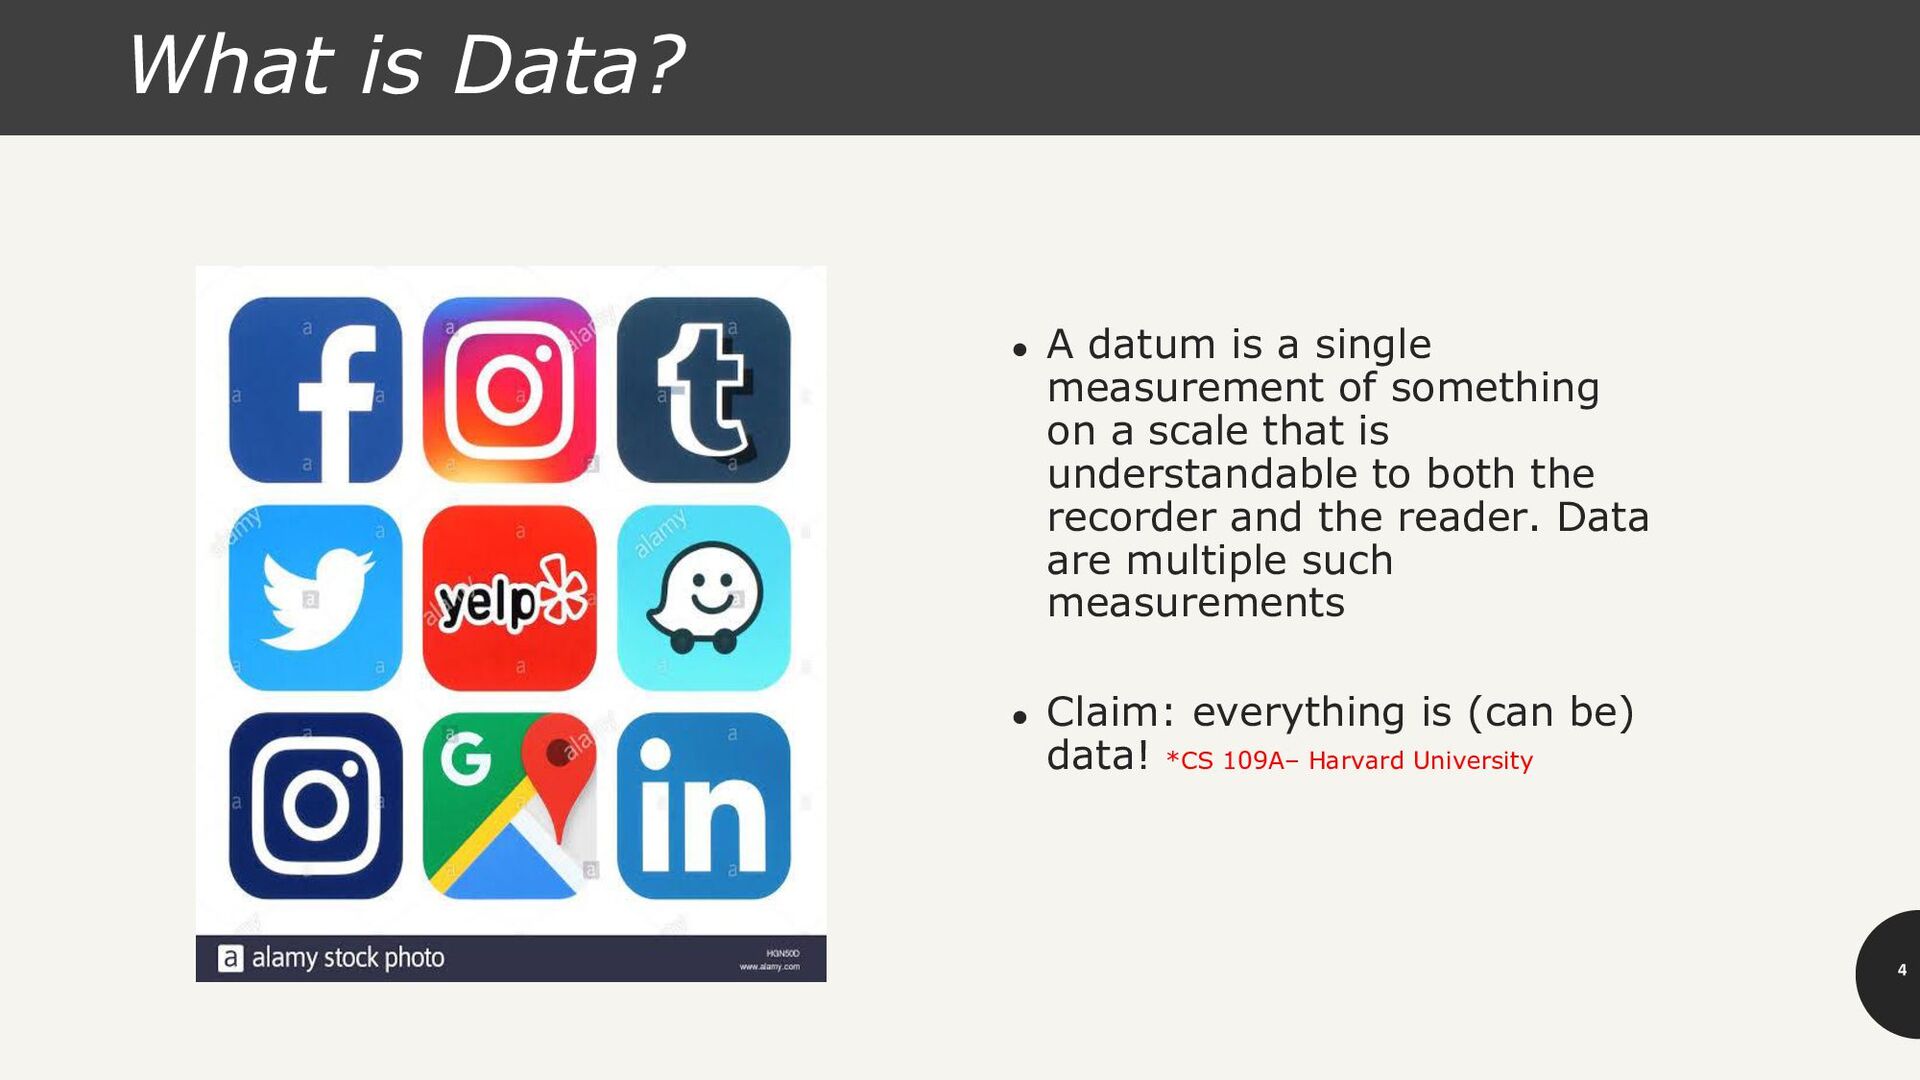
measurement of something on a scale that is understandable to both the recorder and the reader. Data are multiple such measurements • Claim: everything is (can be) data! *CS 109A– Harvard University
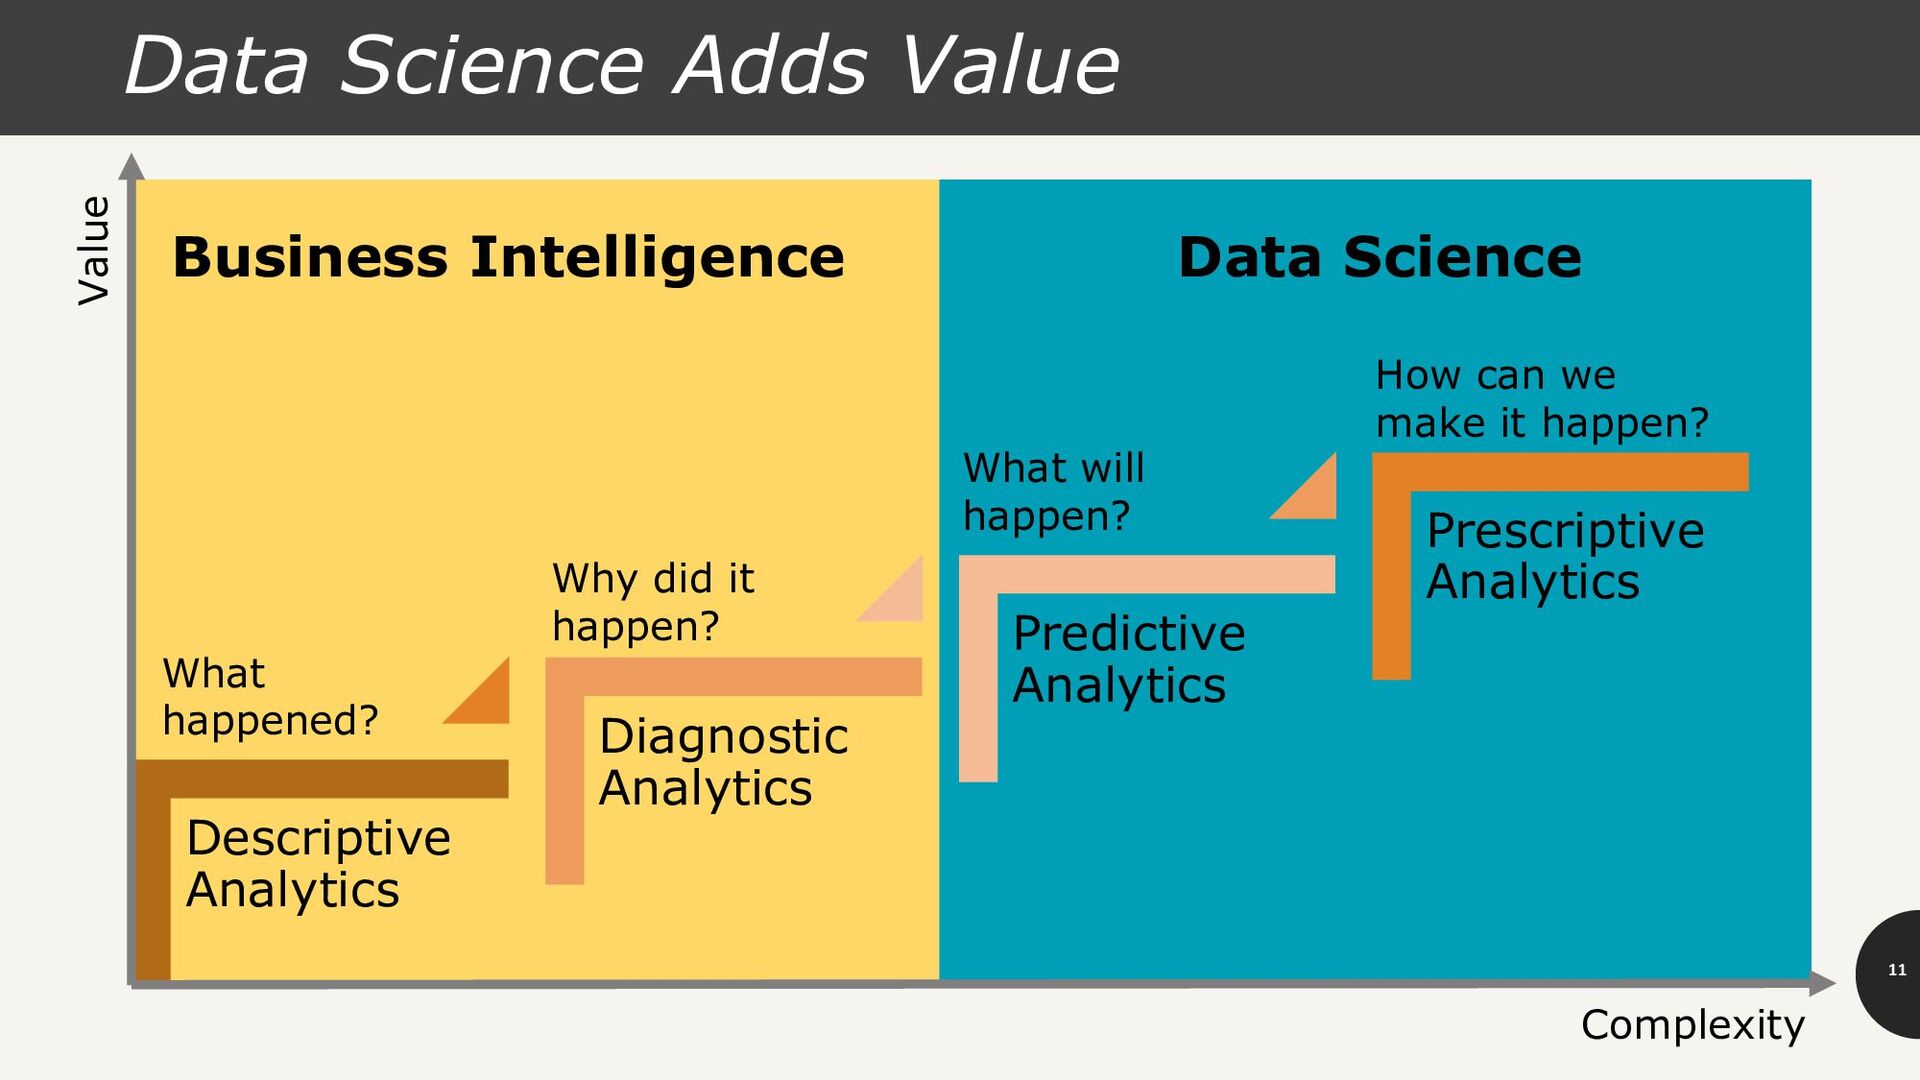
Analytics Prescriptive Analytics Business Intelligence Data Science What happened? Why did it happen? What will happen? How can we make it happen? Value Complexity
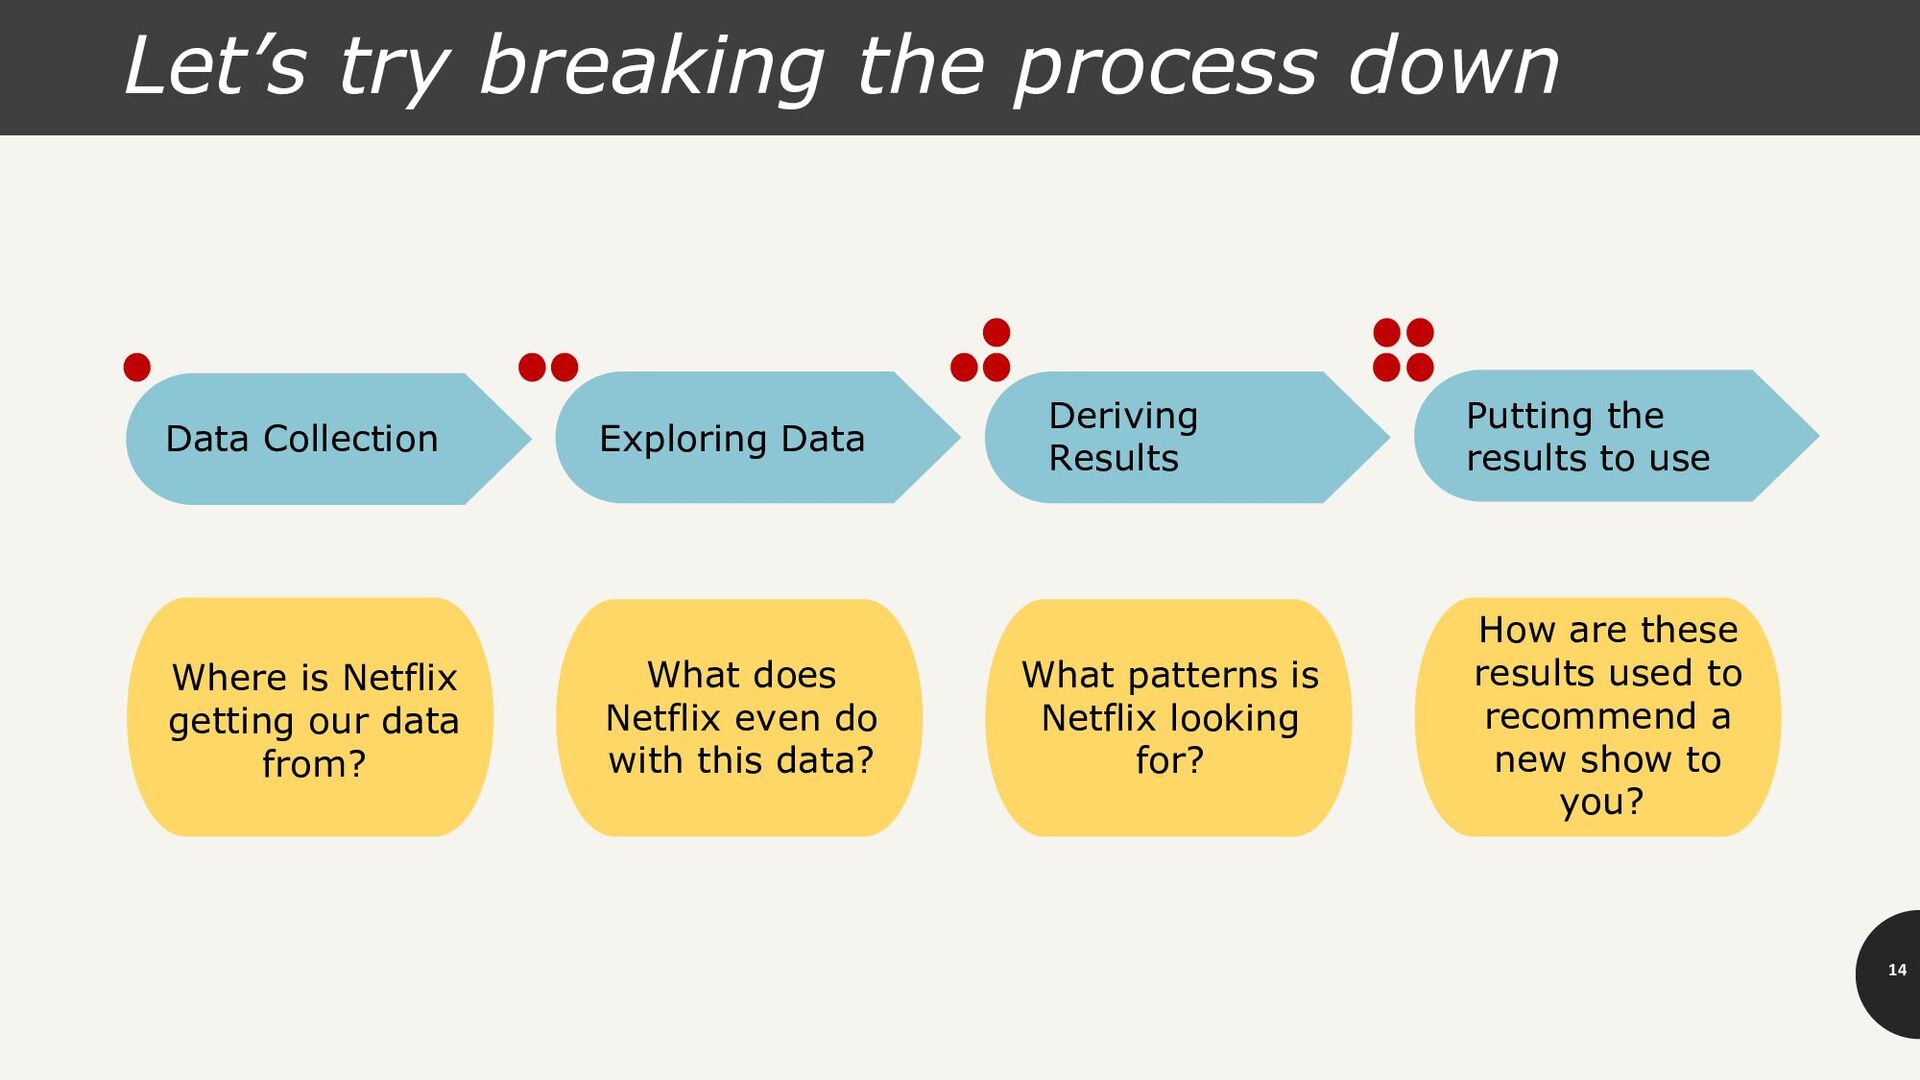
getting our data from? Data Collection Exploring Data What does Netflix even do with this data? Deriving Results Putting the results to use What patterns is Netflix looking for? How are these results used to recommend a new show to you?
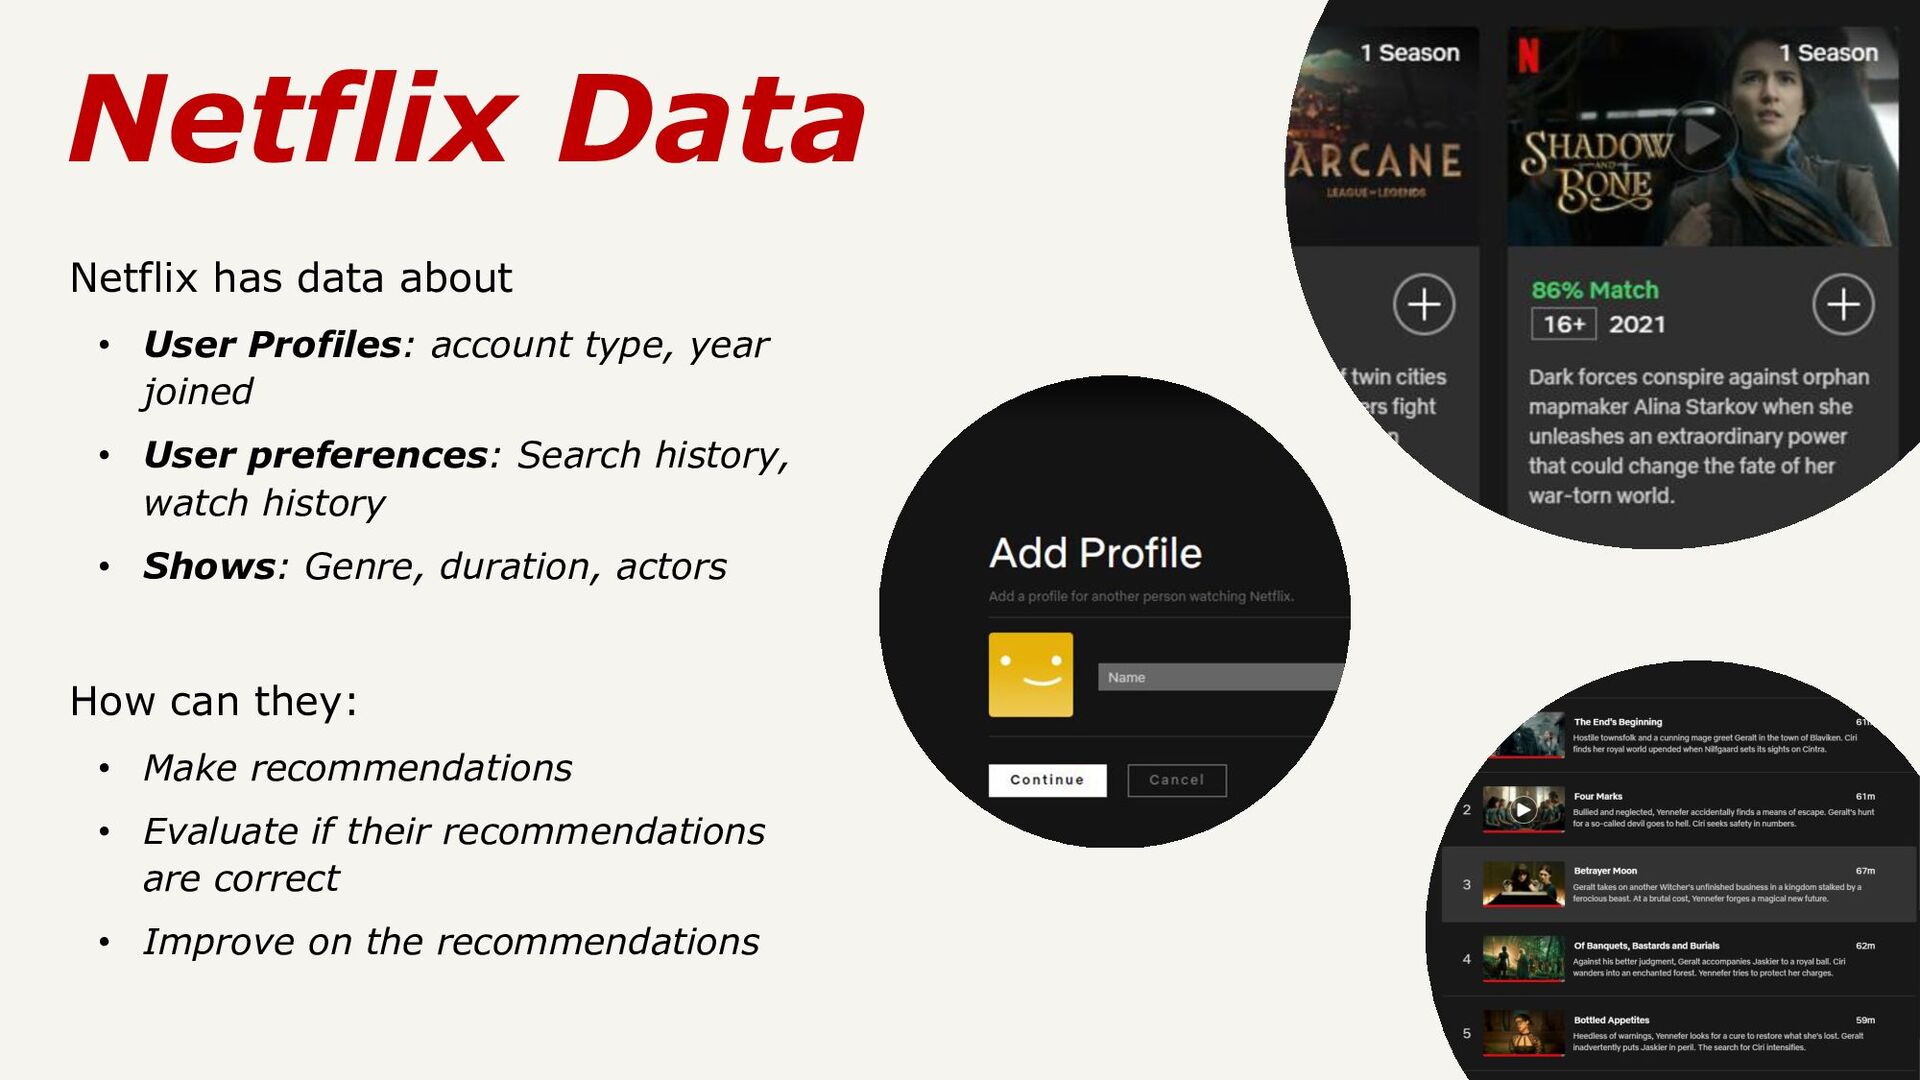
type, year joined • User preferences: Search history, watch history • Shows: Genre, duration, actors How can they: • Make recommendations • Evaluate if their recommendations are correct • Improve on the recommendations
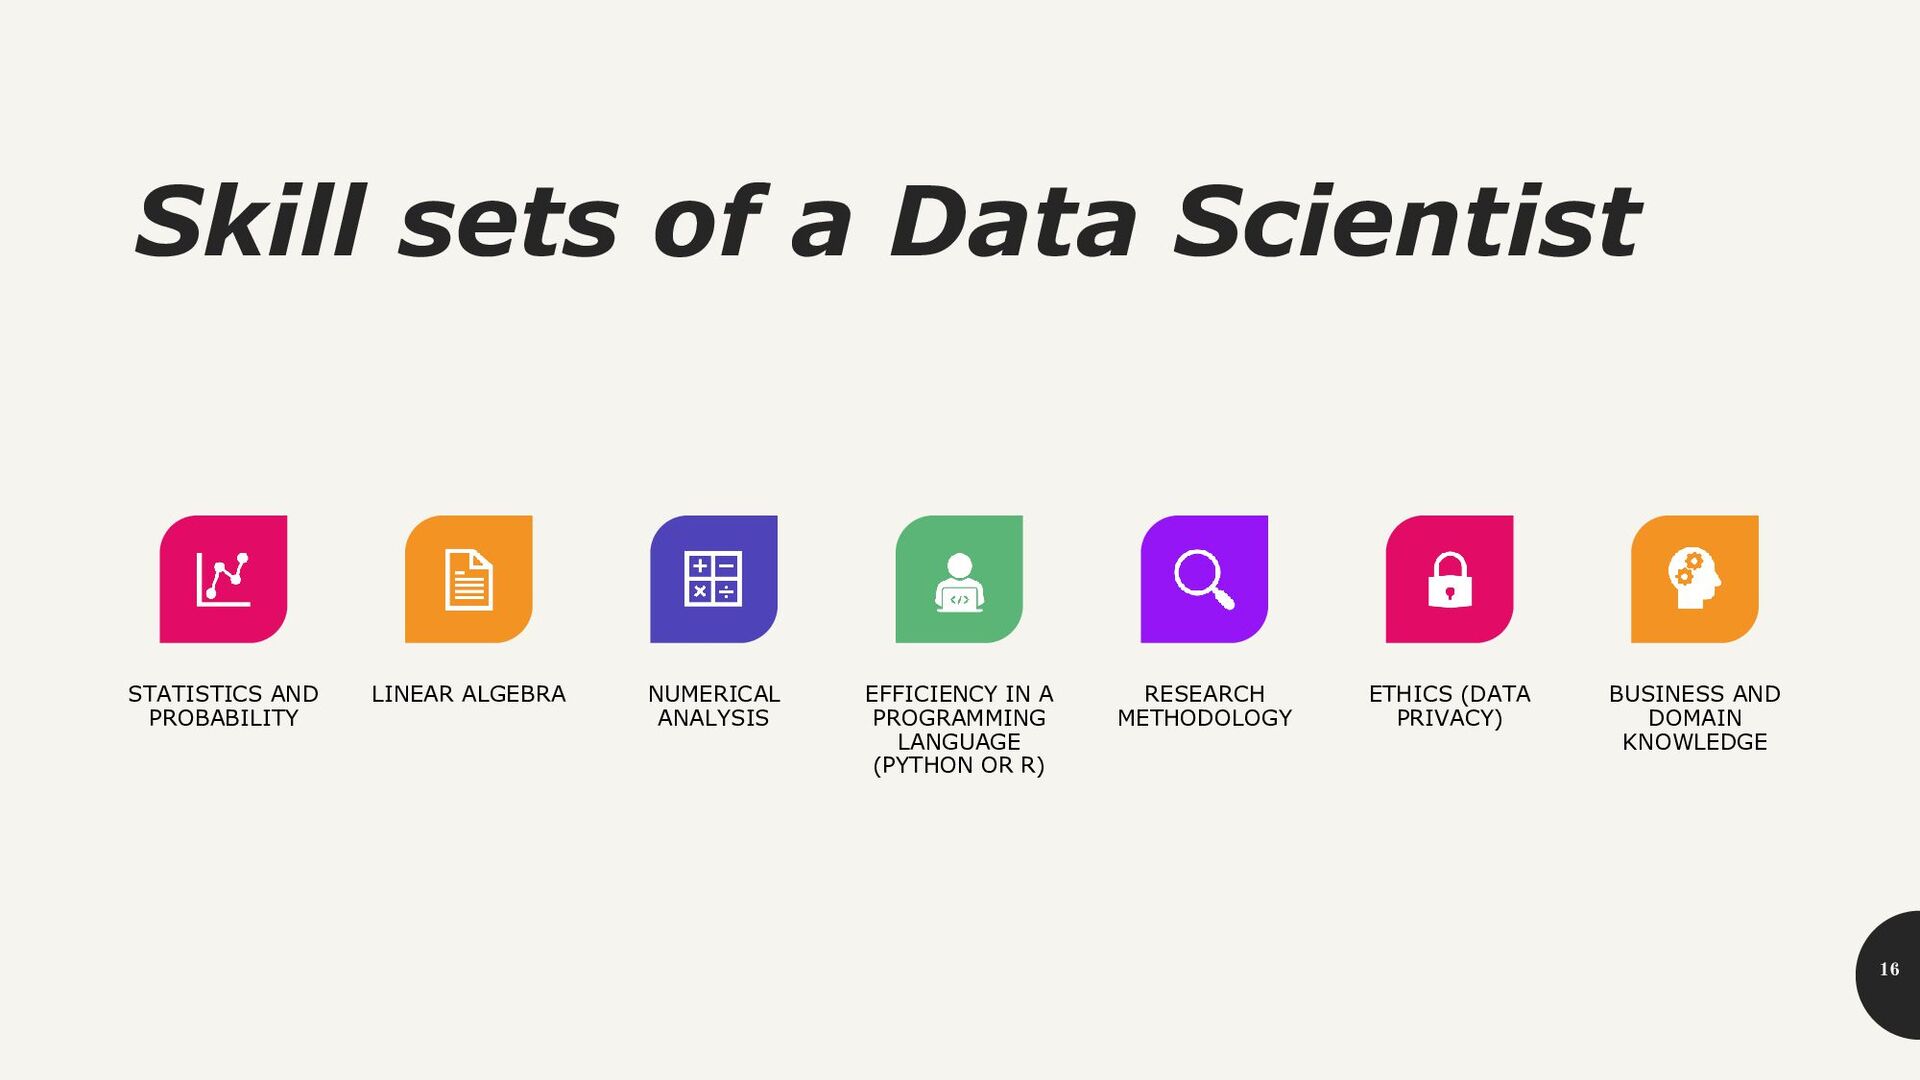
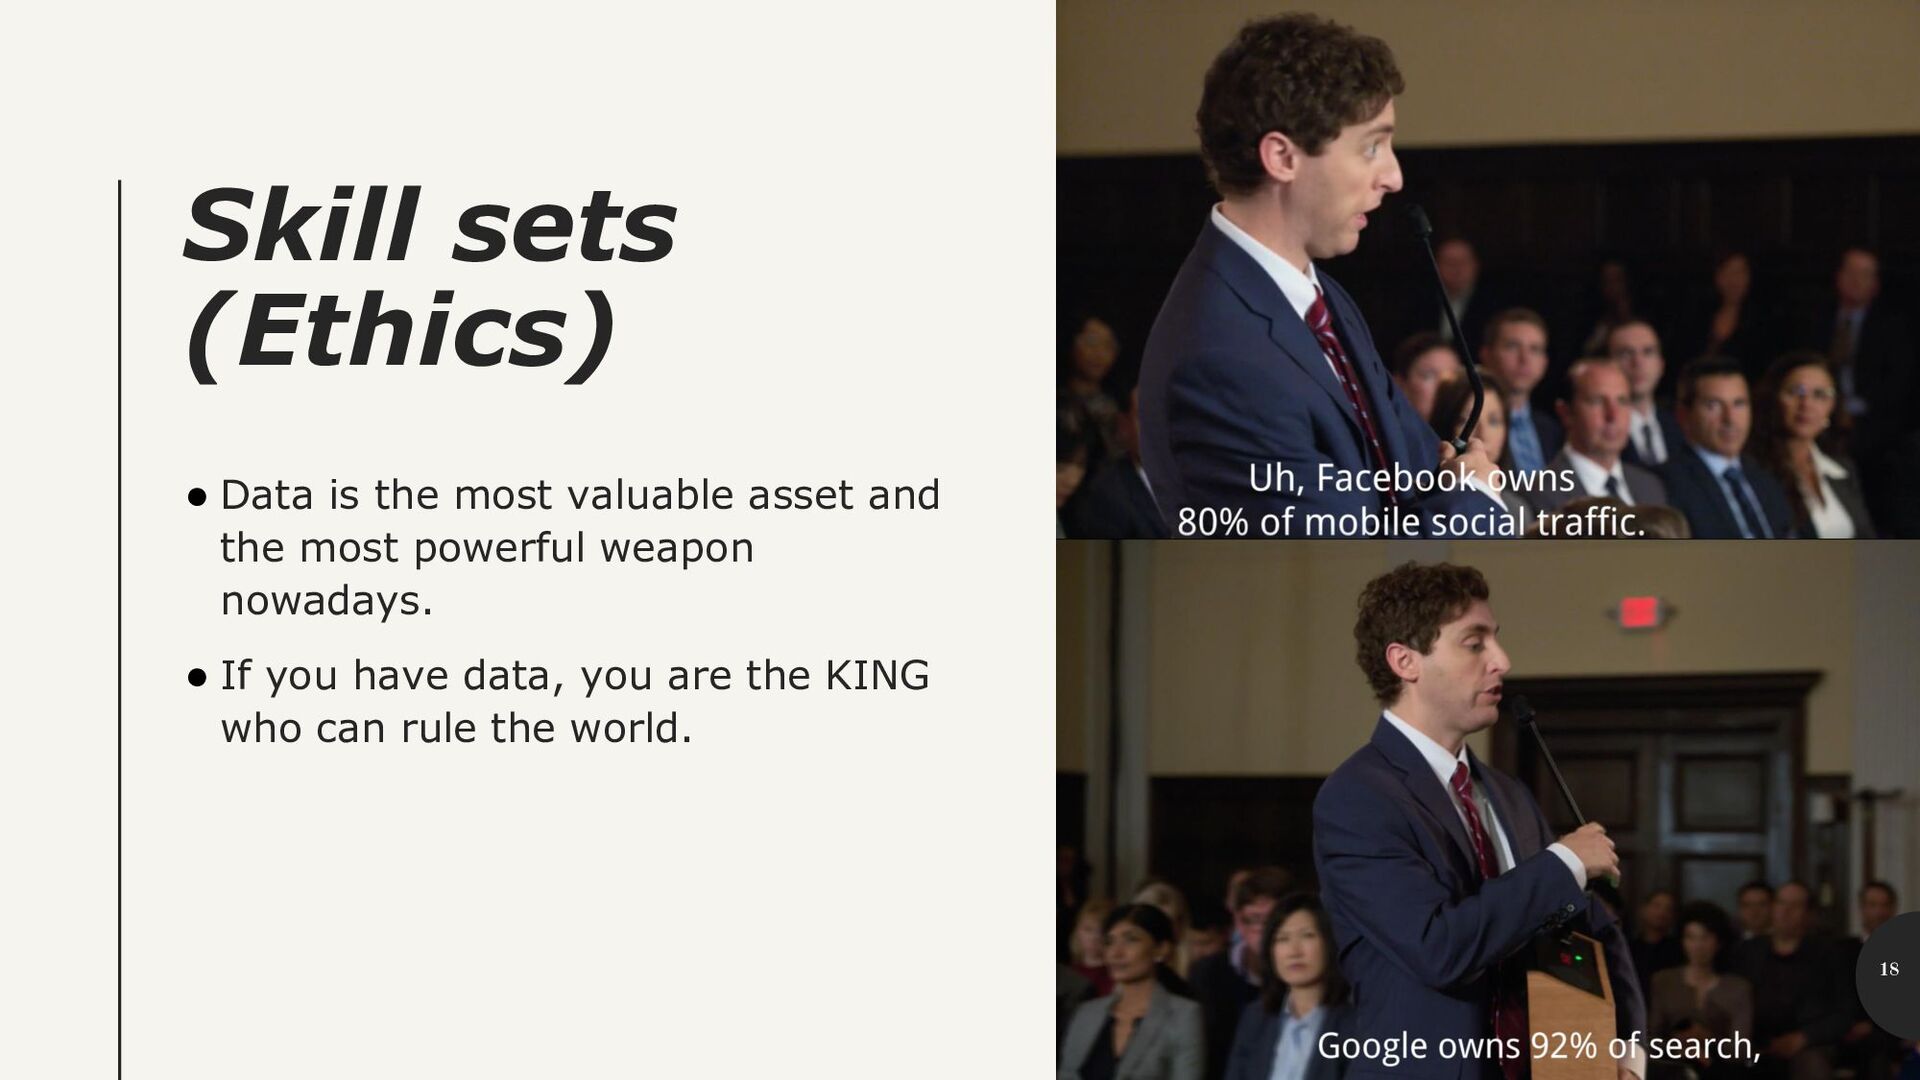
LINEAR ALGEBRA NUMERICAL ANALYSIS EFFICIENCY IN A PROGRAMMING LANGUAGE (PYTHON OR R) RESEARCH METHODOLOGY ETHICS (DATA PRIVACY) BUSINESS AND DOMAIN KNOWLEDGE
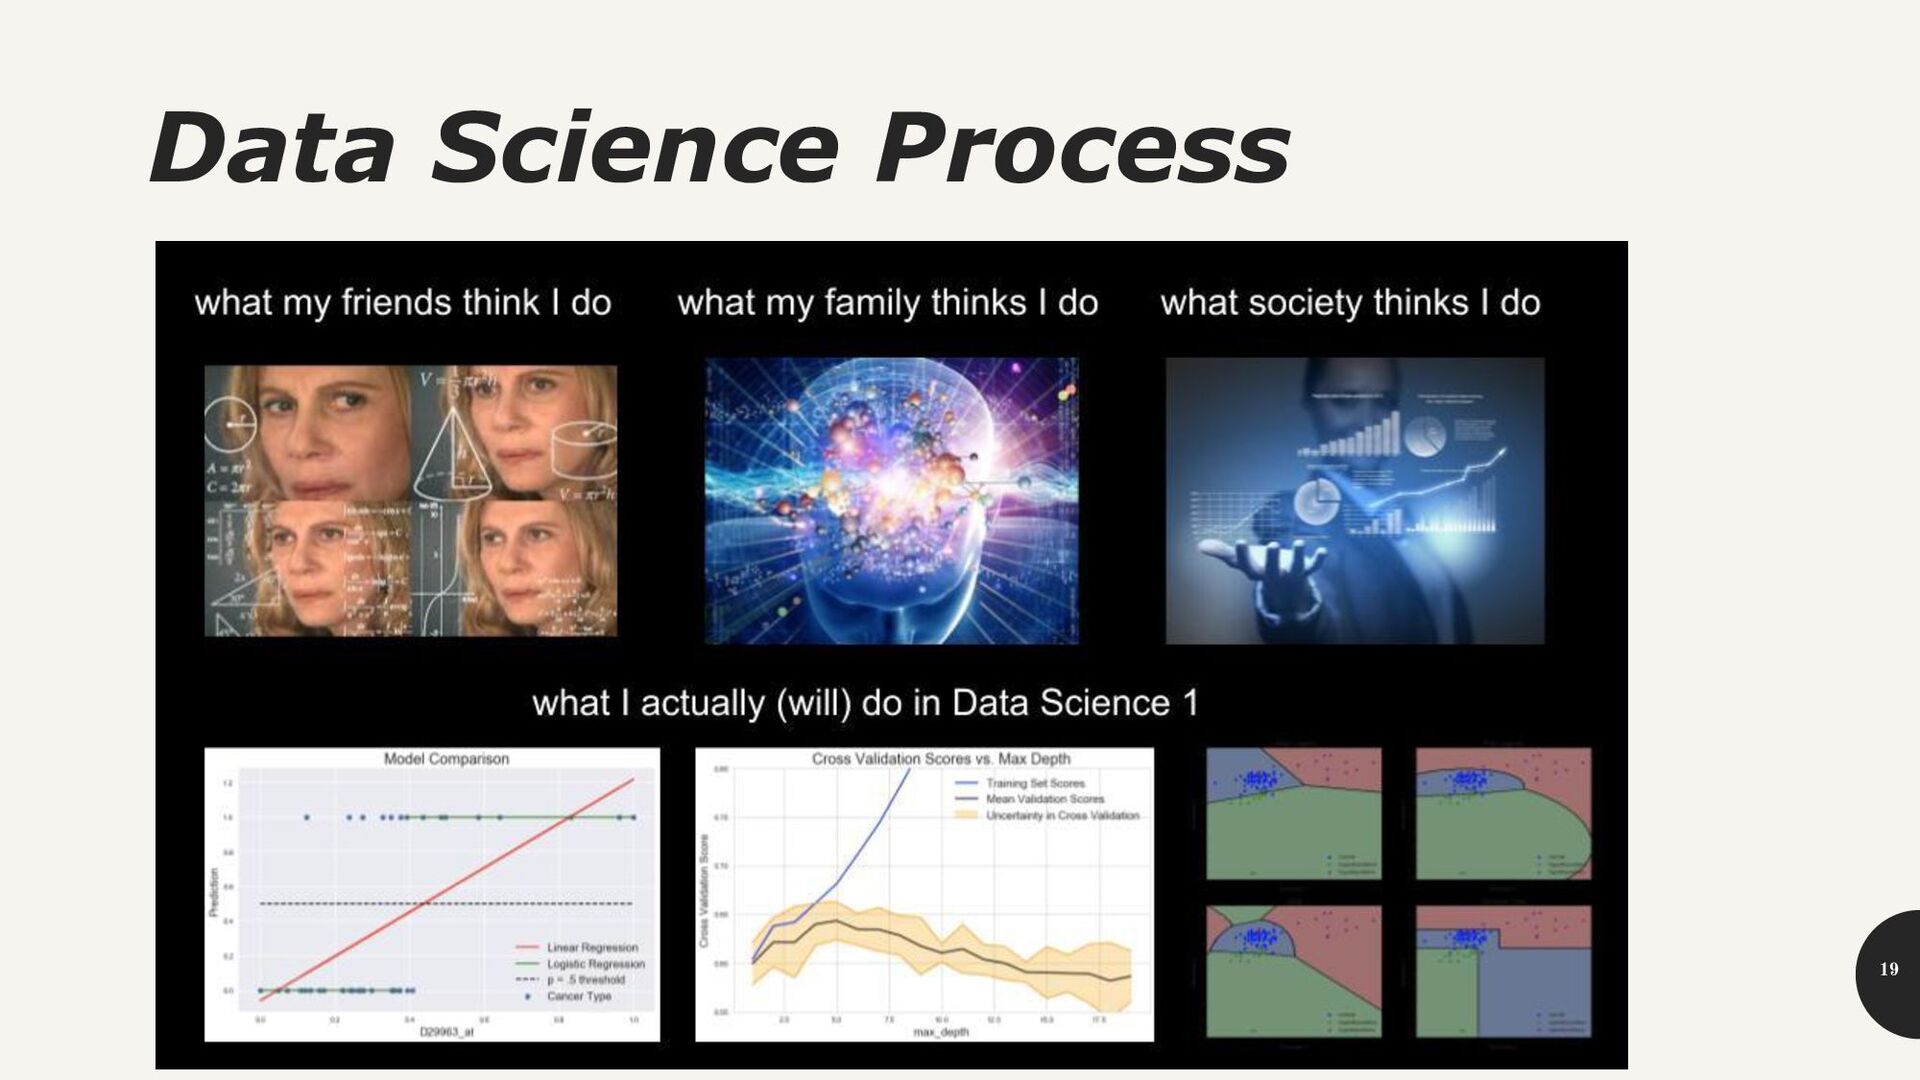
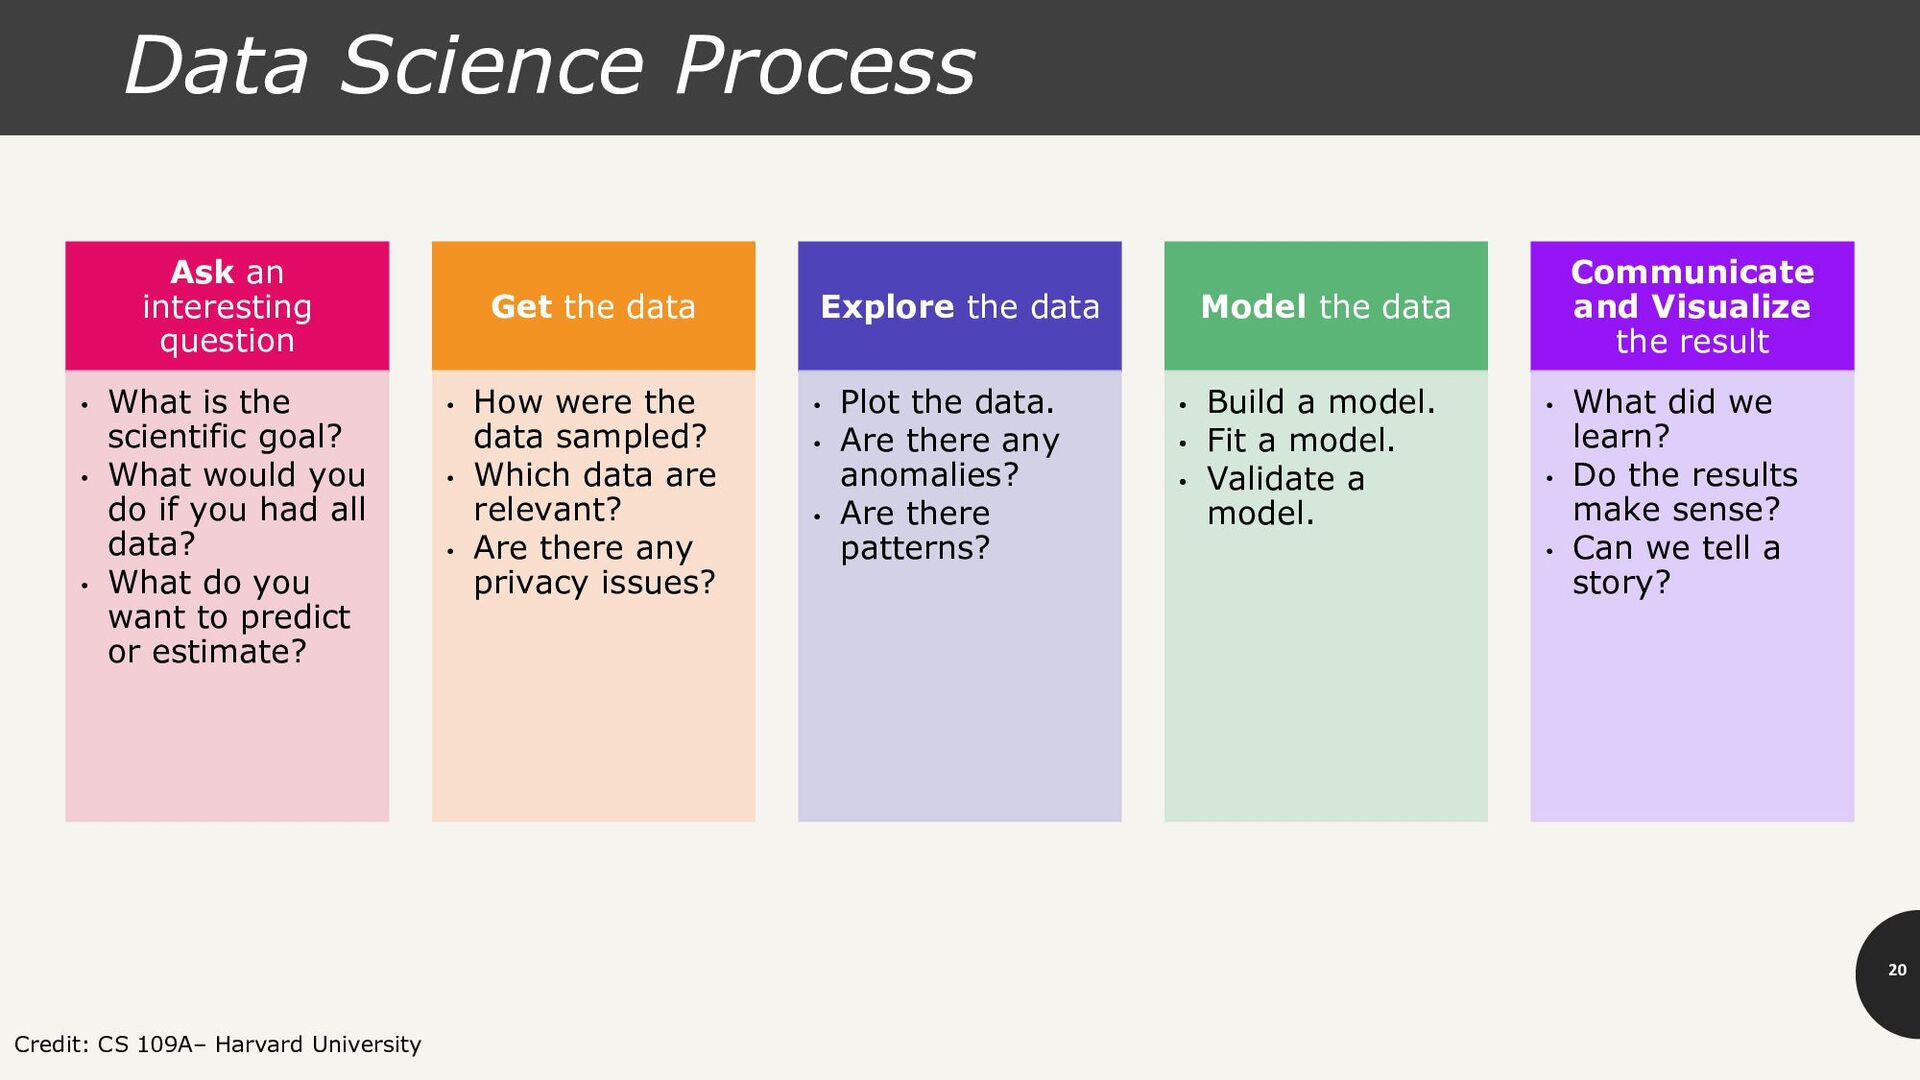
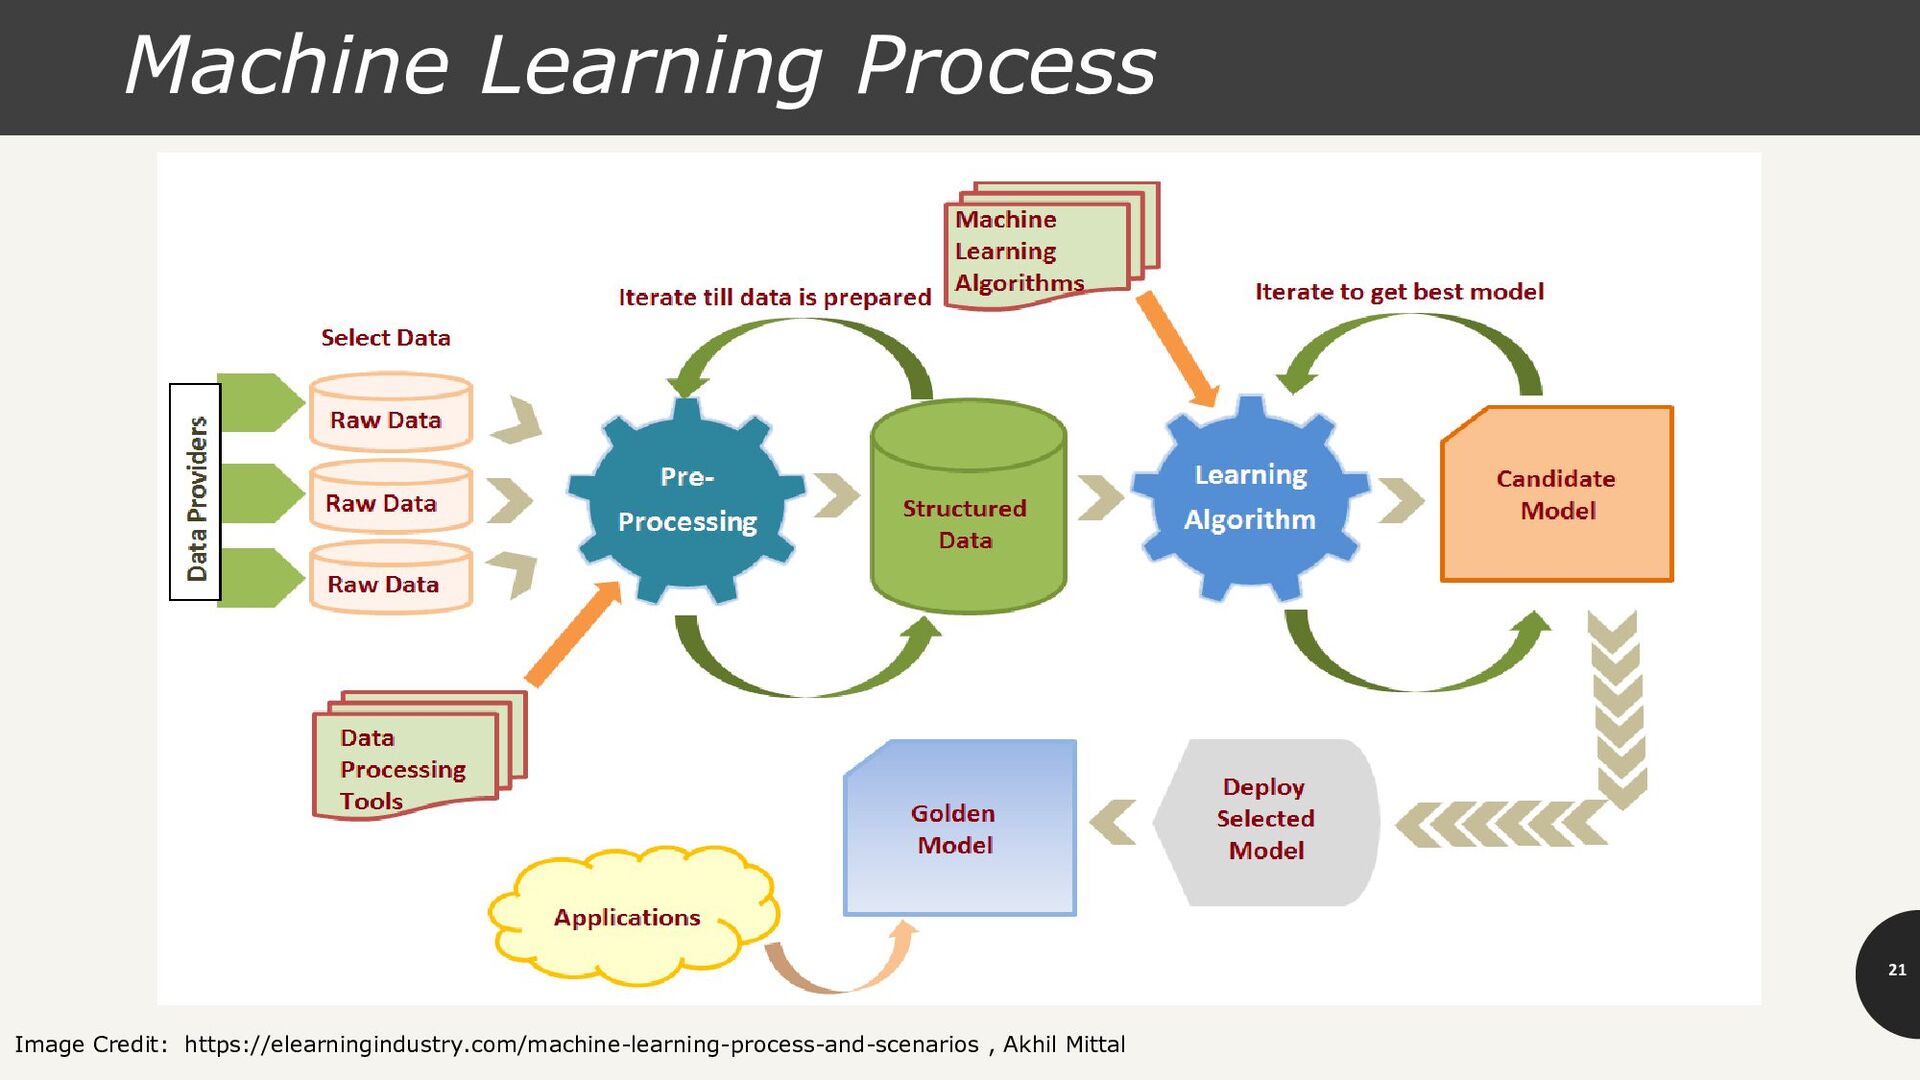
an interesting question • What is the scientific goal? • What would you do if you had all data? • What do you want to predict or estimate? Get the data • How were the data sampled? • Which data are relevant? • Are there any privacy issues? Explore the data • Plot the data. • Are there any anomalies? • Are there patterns? Model the data • Build a model. • Fit a model. • Validate a model. Communicate and Visualize the result • What did we learn? • Do the results make sense? • Can we tell a story?
overall data collection of you organization. For example: business-centric data that is available in the organization database to record day to day operations; scientific or experimental data. Existing External Sources: available in ready to read format from an outside source for free or for a fee. For example: public government databases, stock market data, Yelp reviews, [your favorite sport]-reference. External Sources Requiring Collection Efforts: available from external source but acquisition requires special processing. For example: data appearing only in print form, or data on websites. 22 Data Collection: Where do data come from?
prebuilt set of functions developed by a company to access their services. Often pay to use. •For example: Google Map API, Facebook API, Twitter API API (Application Programming Interface) •using software, scripts or by-hand extracting data from what is displayed on a page or what is contained in the HTML file (often in tables). •For example: BeautifulSoup Web Scraping
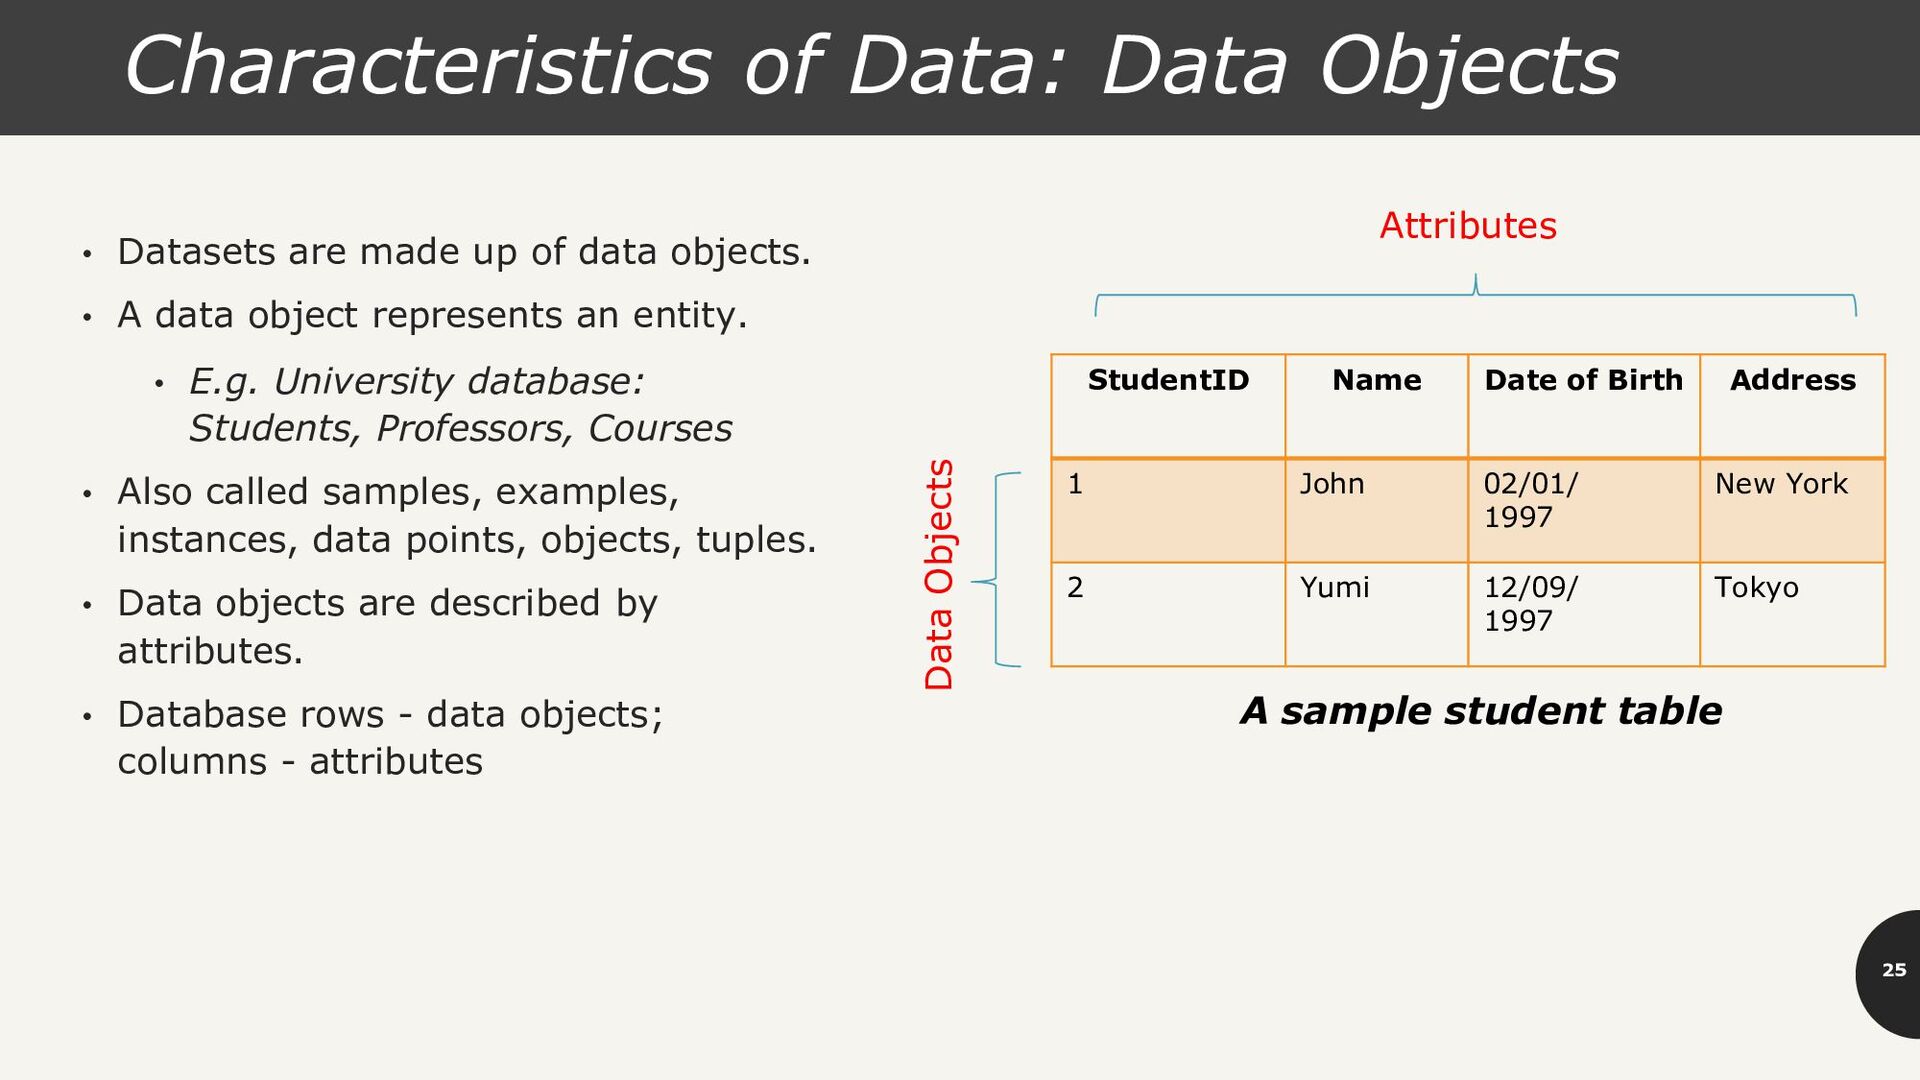
Birth Address 1 John 02/01/ 1997 New York 2 Yumi 12/09/ 1997 Tokyo Data Objects A sample student table Attributes • Datasets are made up of data objects. • A data object represents an entity. • E.g. University database: Students, Professors, Courses • Also called samples, examples, instances, data points, objects, tuples. • Data objects are described by attributes. • Database rows - data objects; columns - attributes
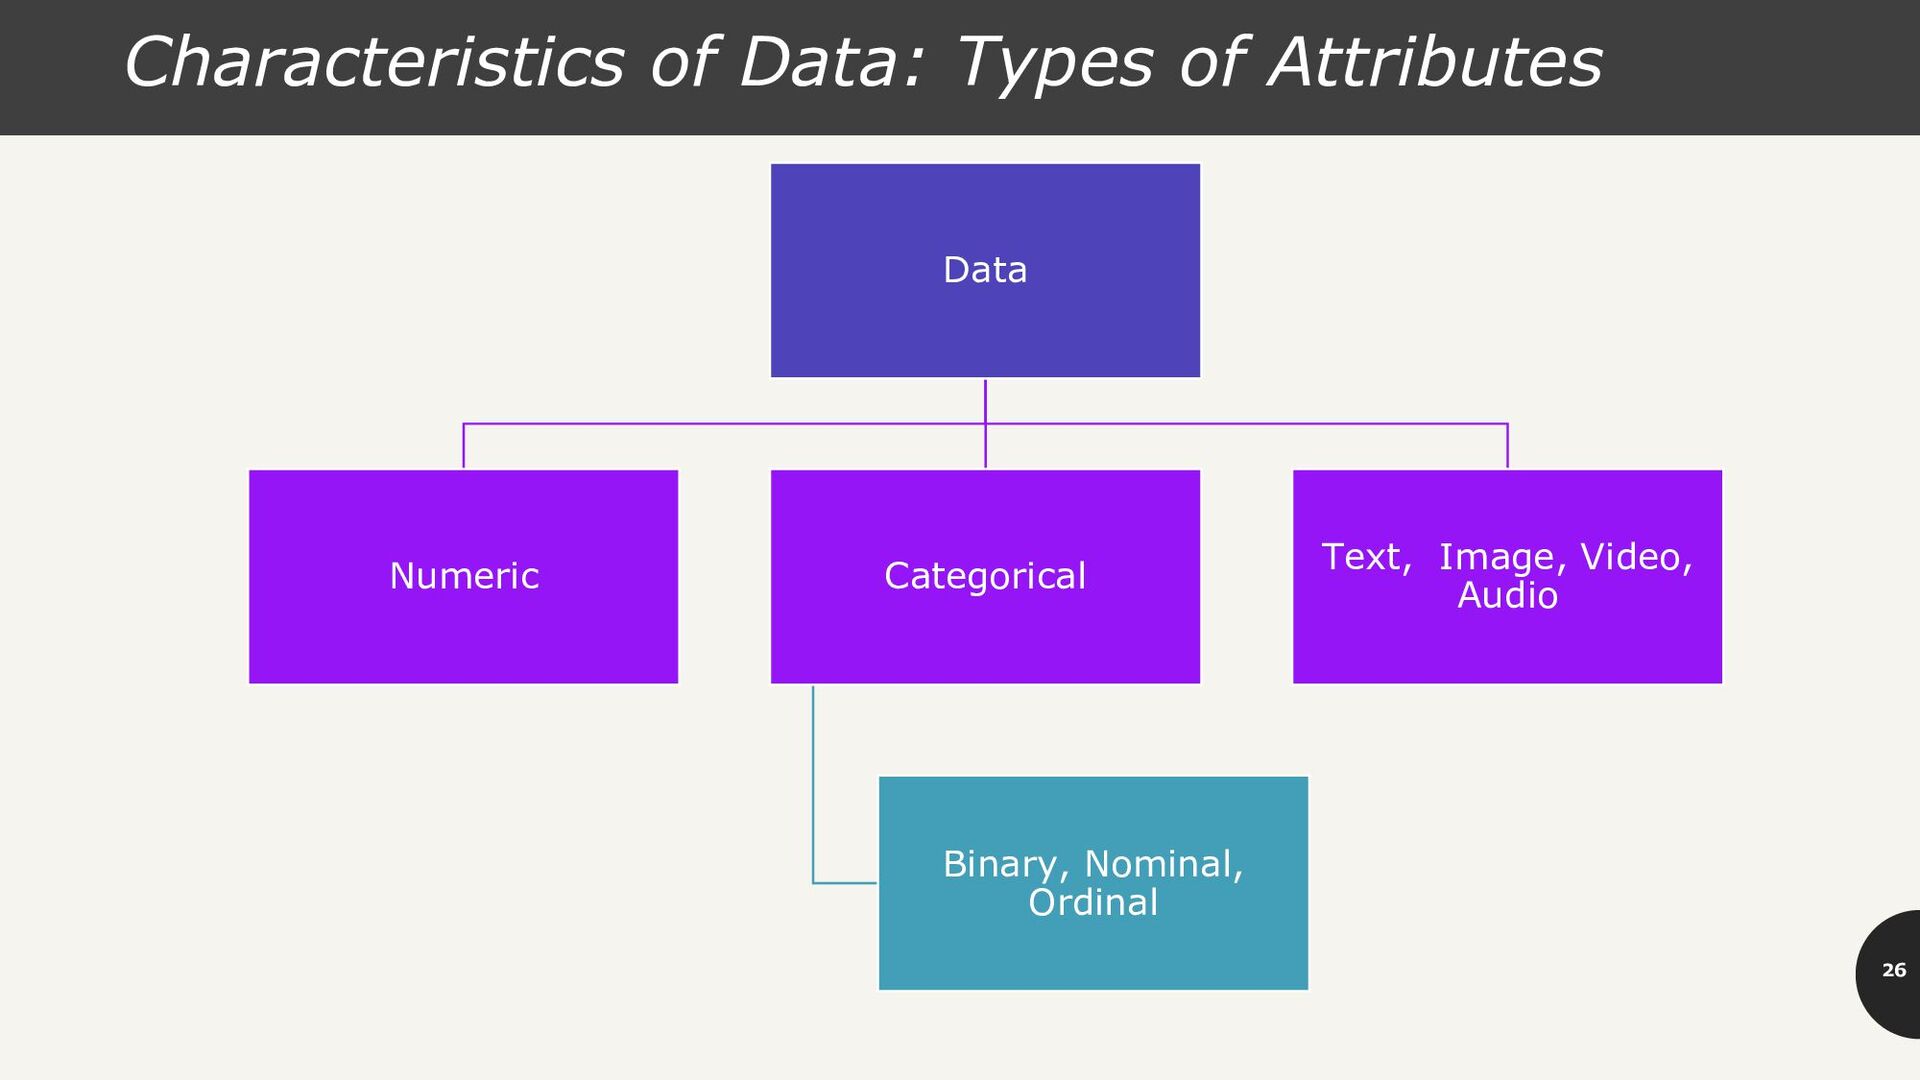
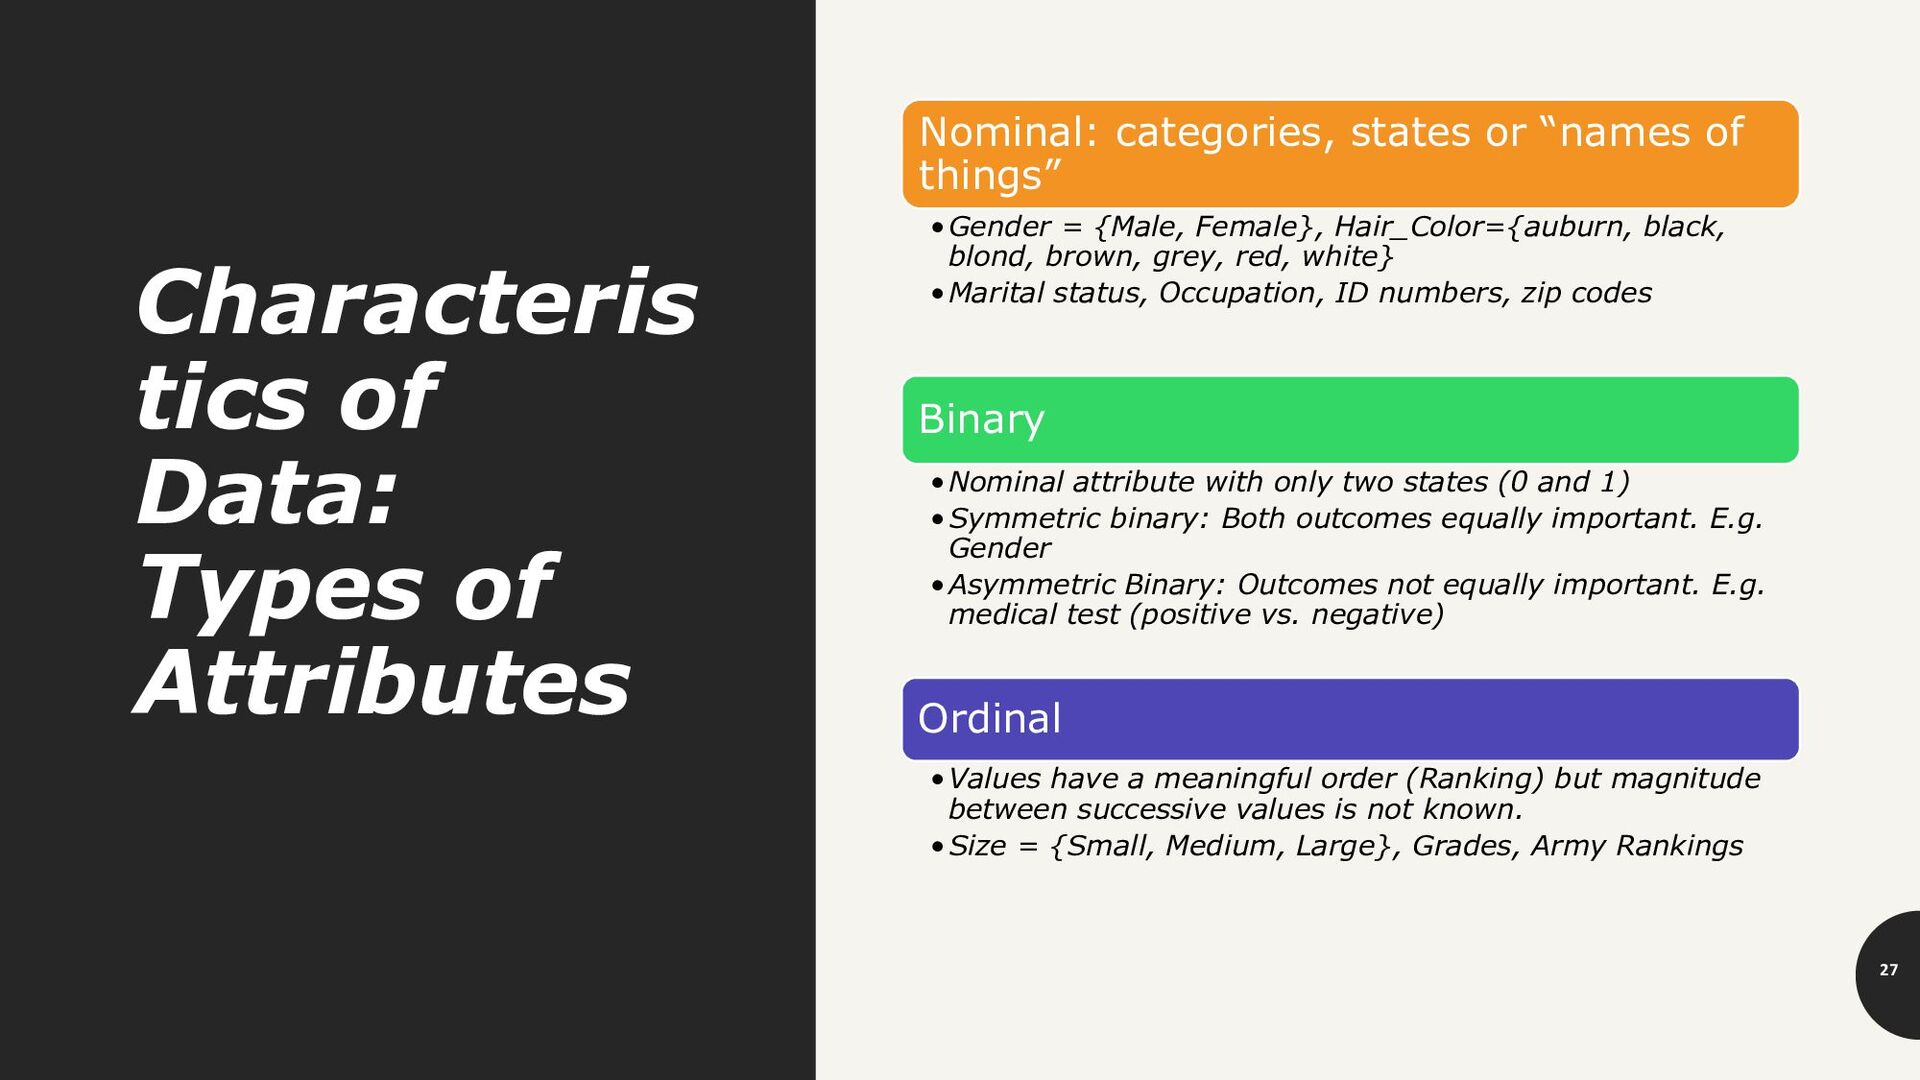
states or “names of things” •Gender = {Male, Female}, Hair_Color={auburn, black, blond, brown, grey, red, white} •Marital status, Occupation, ID numbers, zip codes Binary •Nominal attribute with only two states (0 and 1) •Symmetric binary: Both outcomes equally important. E.g. Gender •Asymmetric Binary: Outcomes not equally important. E.g. medical test (positive vs. negative) Ordinal •Values have a meaningful order (Ranking) but magnitude between successive values is not known. •Size = {Small, Medium, Large}, Grades, Army Rankings
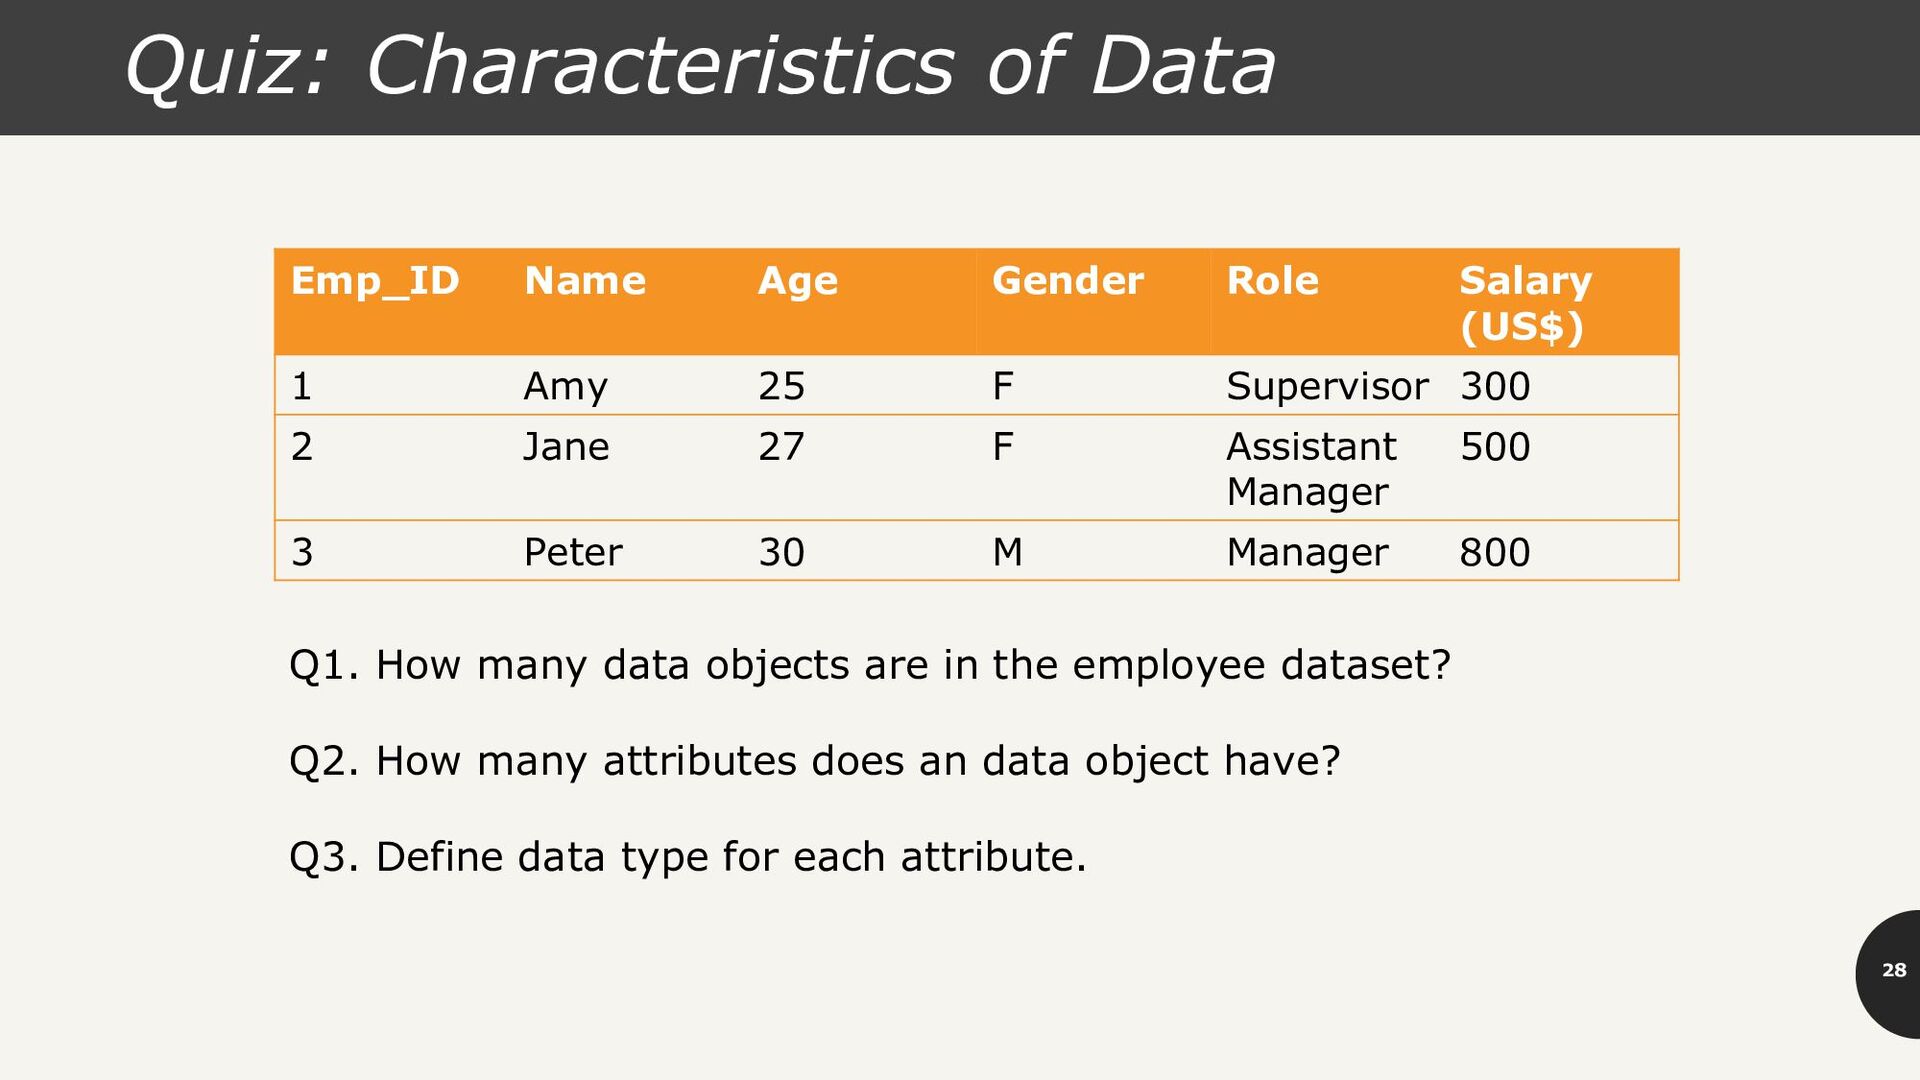
Salary (US$) 1 Amy 25 F Supervisor 300 2 Jane 27 F Assistant Manager 500 3 Peter 30 M Manager 800 Q1. How many data objects are in the employee dataset? Q2. How many attributes does an data object have? Q3. Define data type for each attribute.
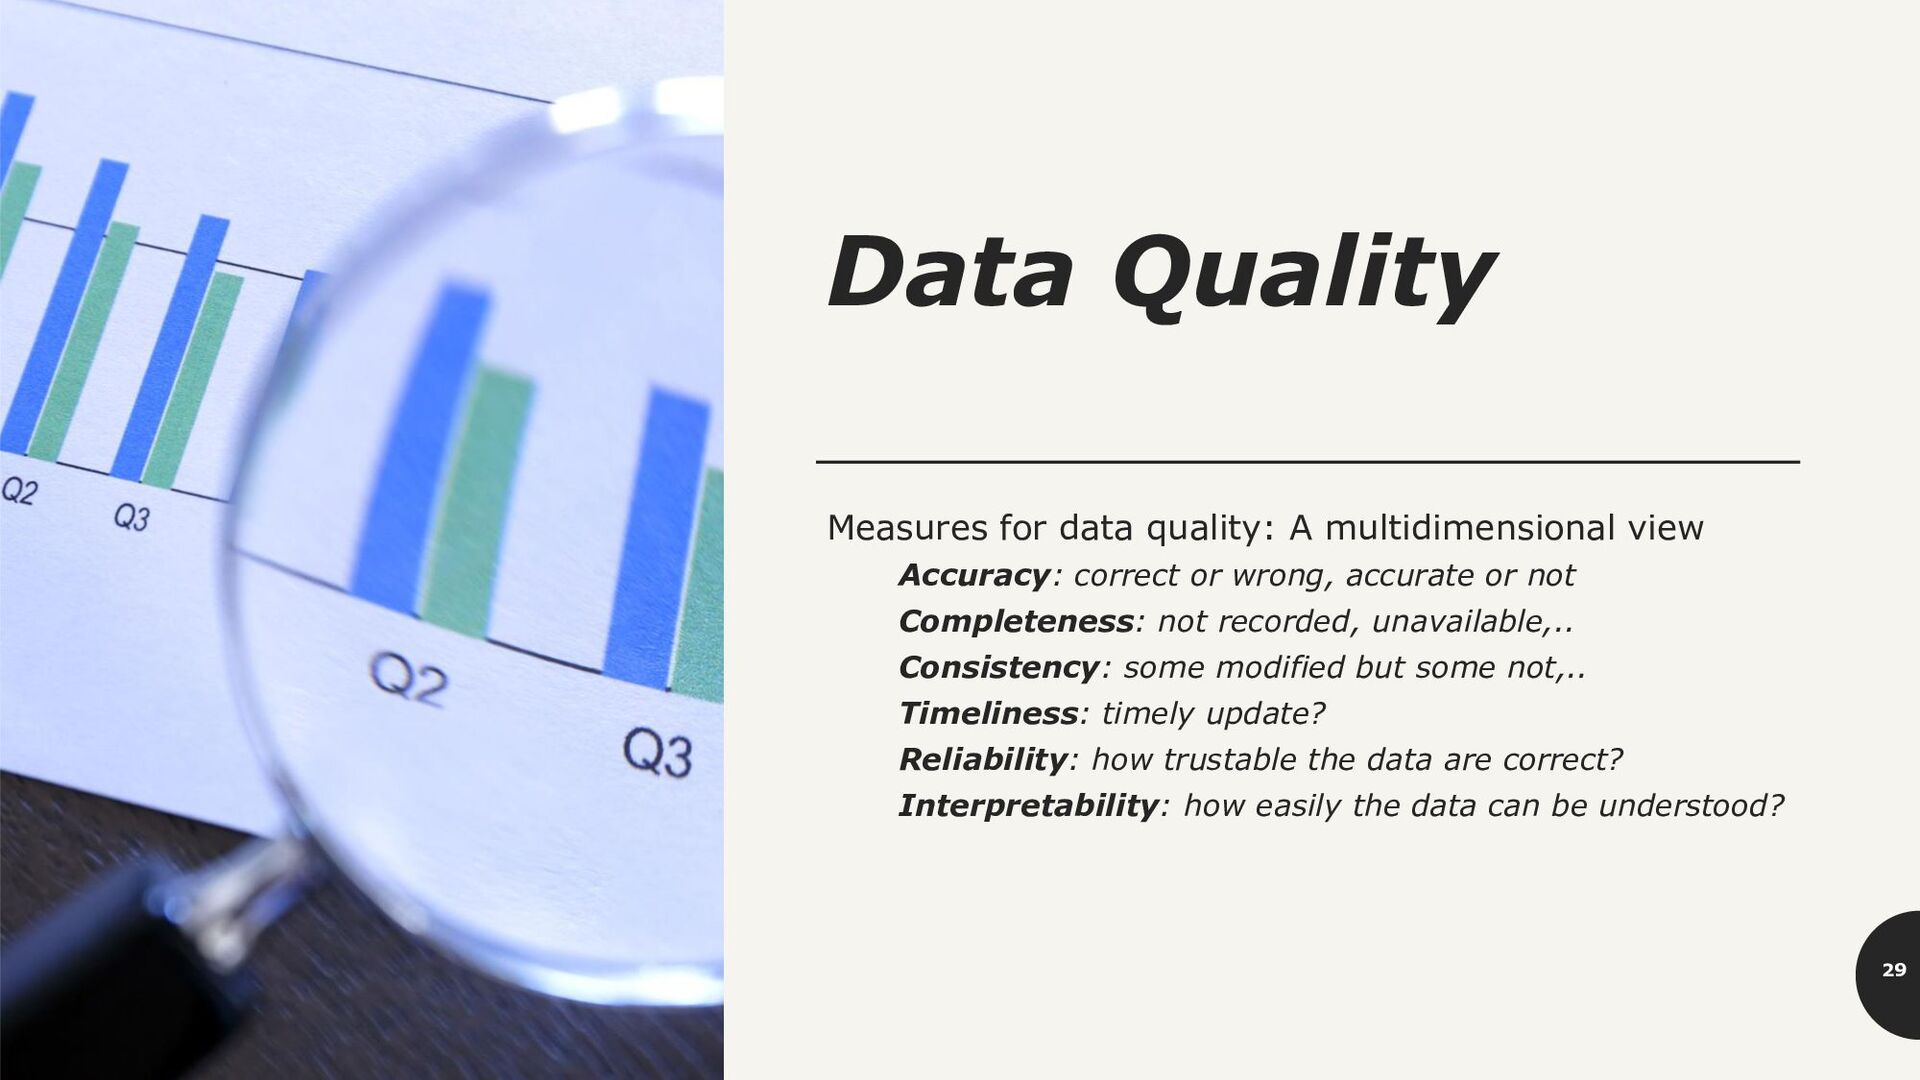
correct or wrong, accurate or not Completeness: not recorded, unavailable,.. Consistency: some modified but some not,.. Timeliness: timely update? Reliability: how trustable the data are correct? Interpretability: how easily the data can be understood? 29
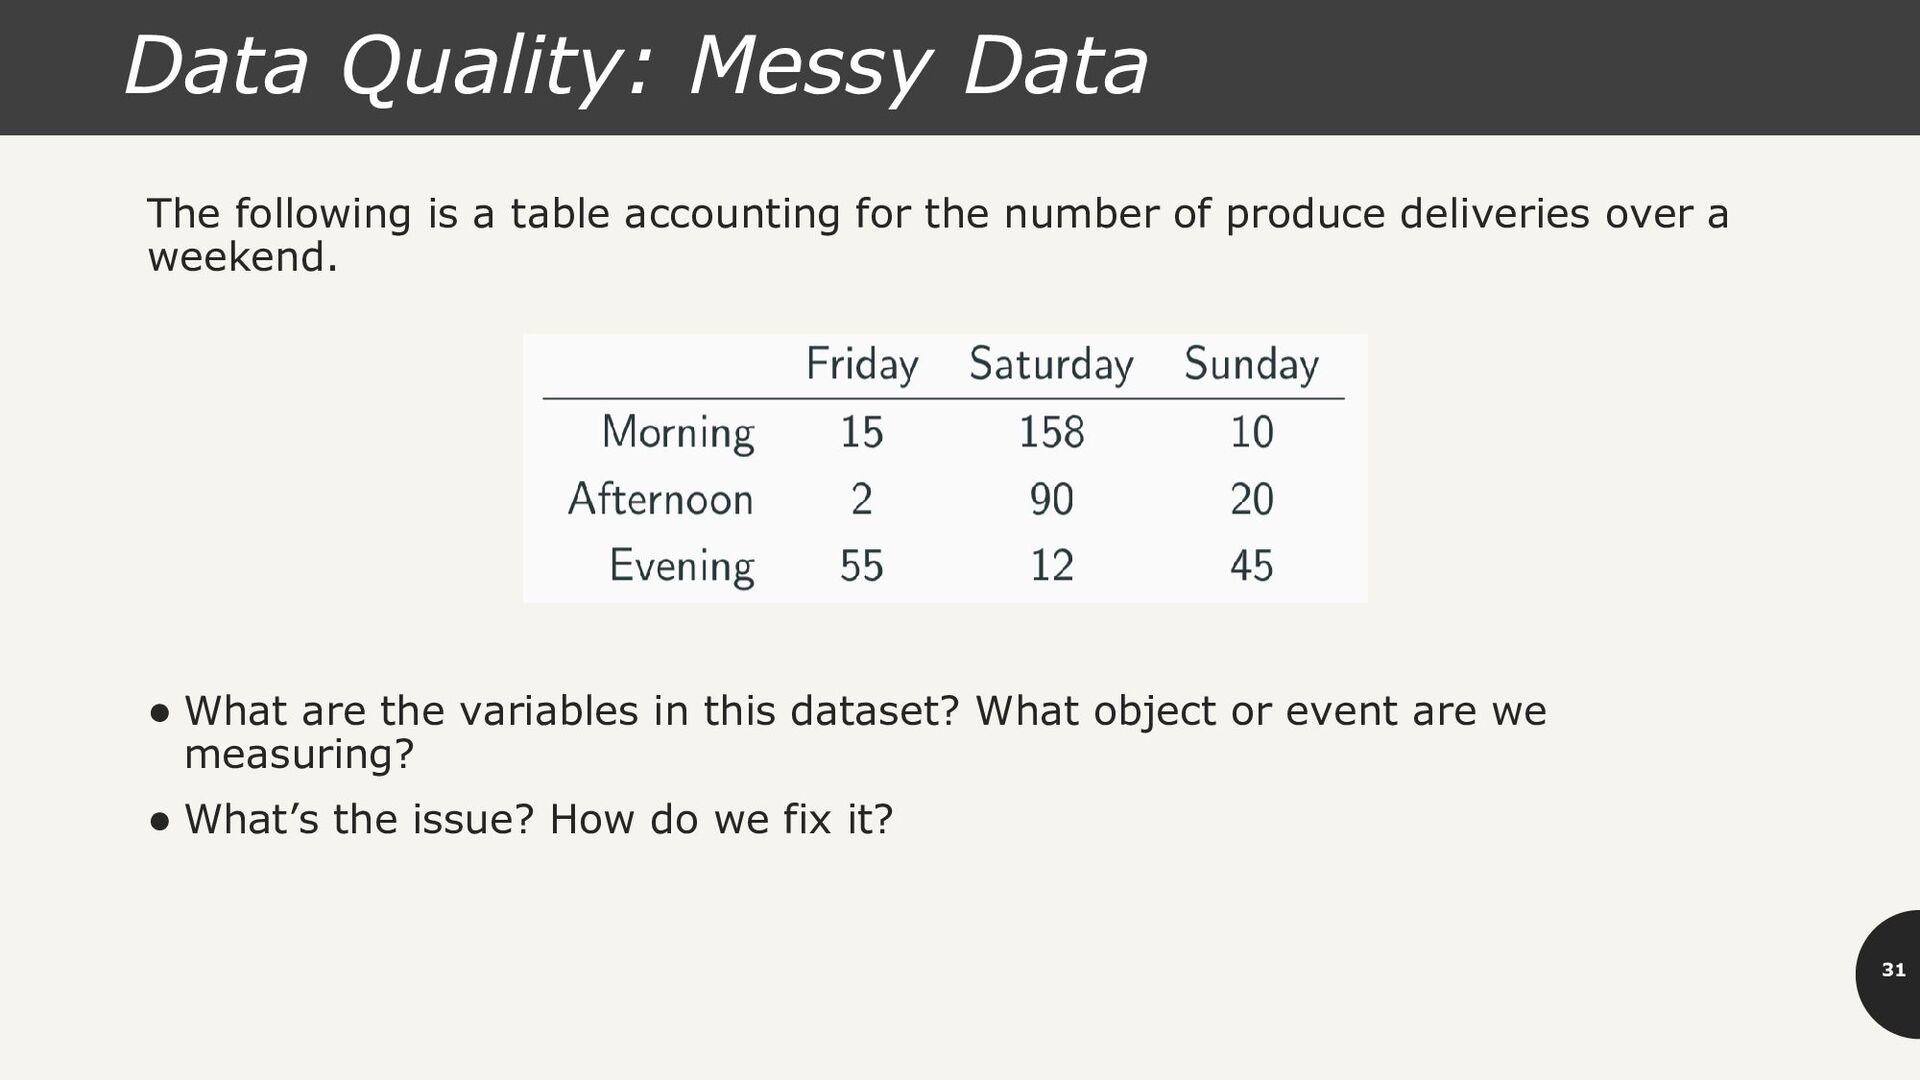
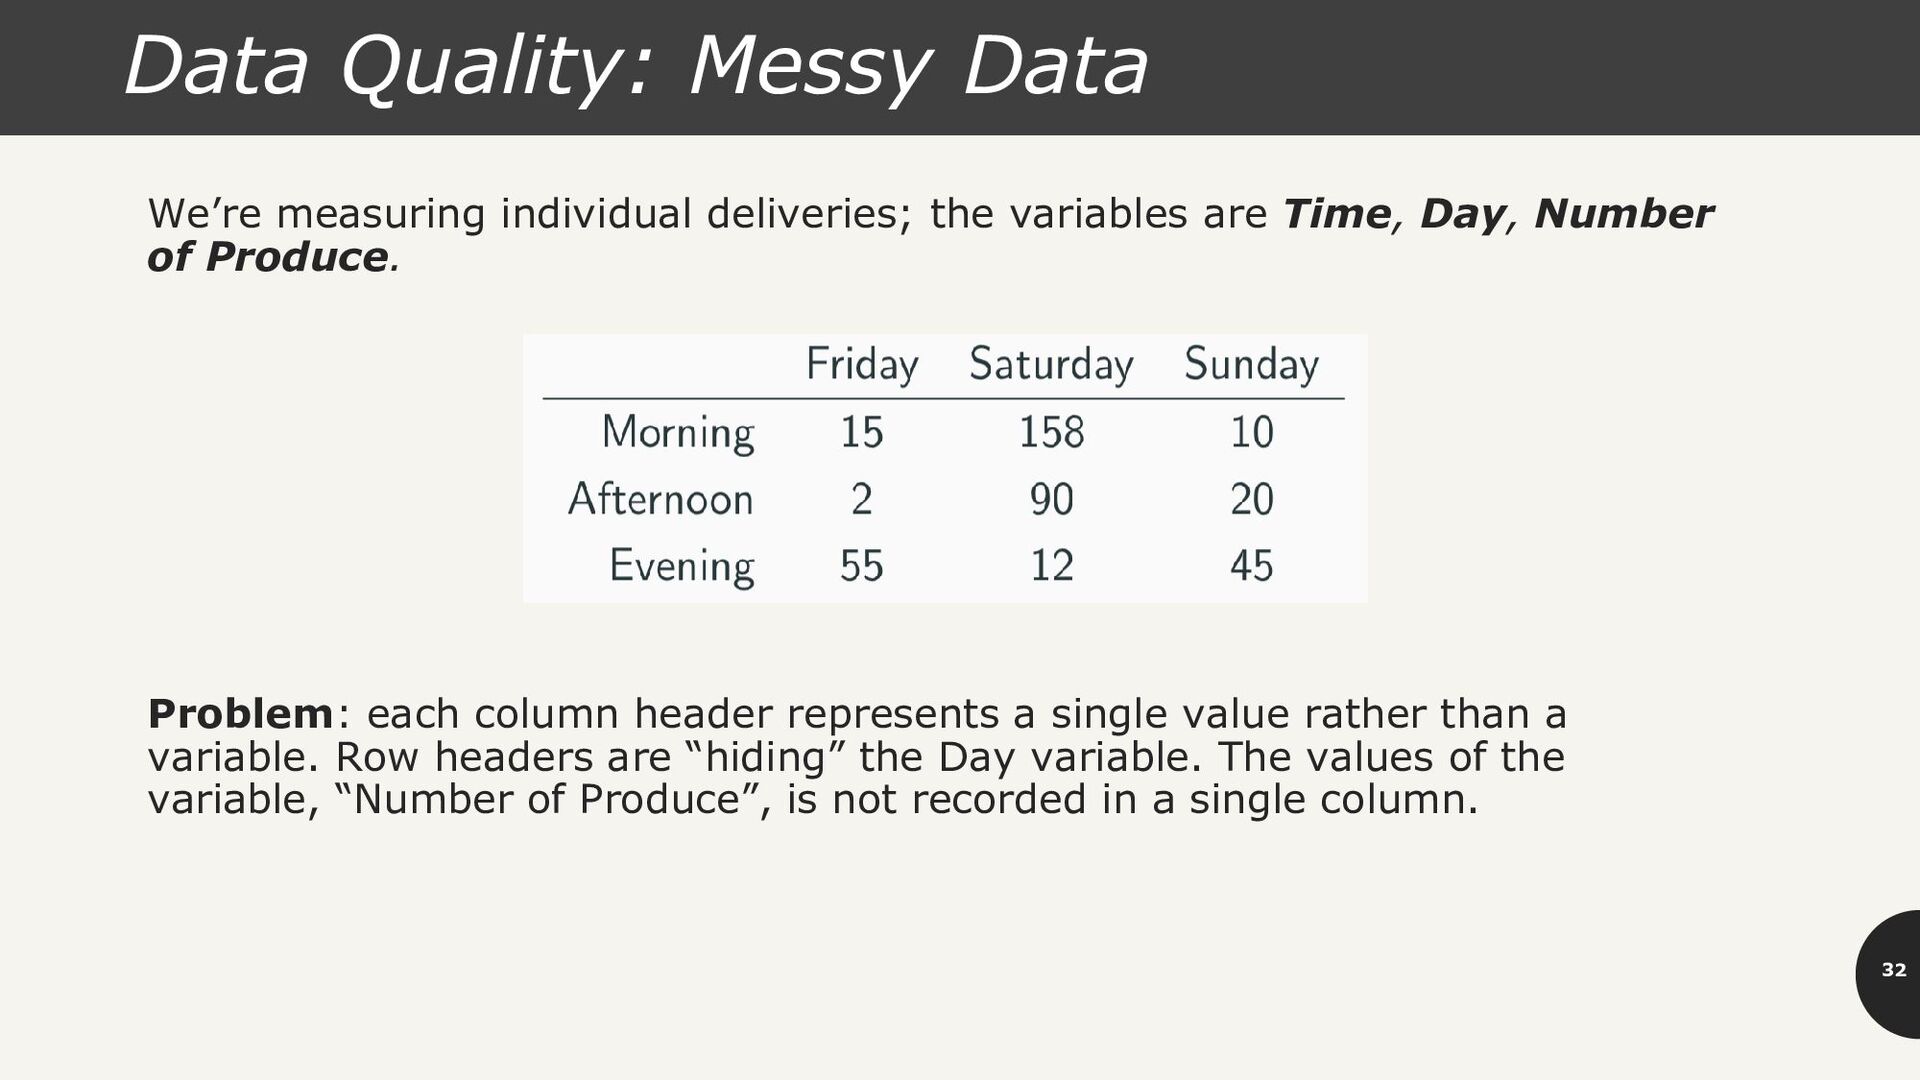
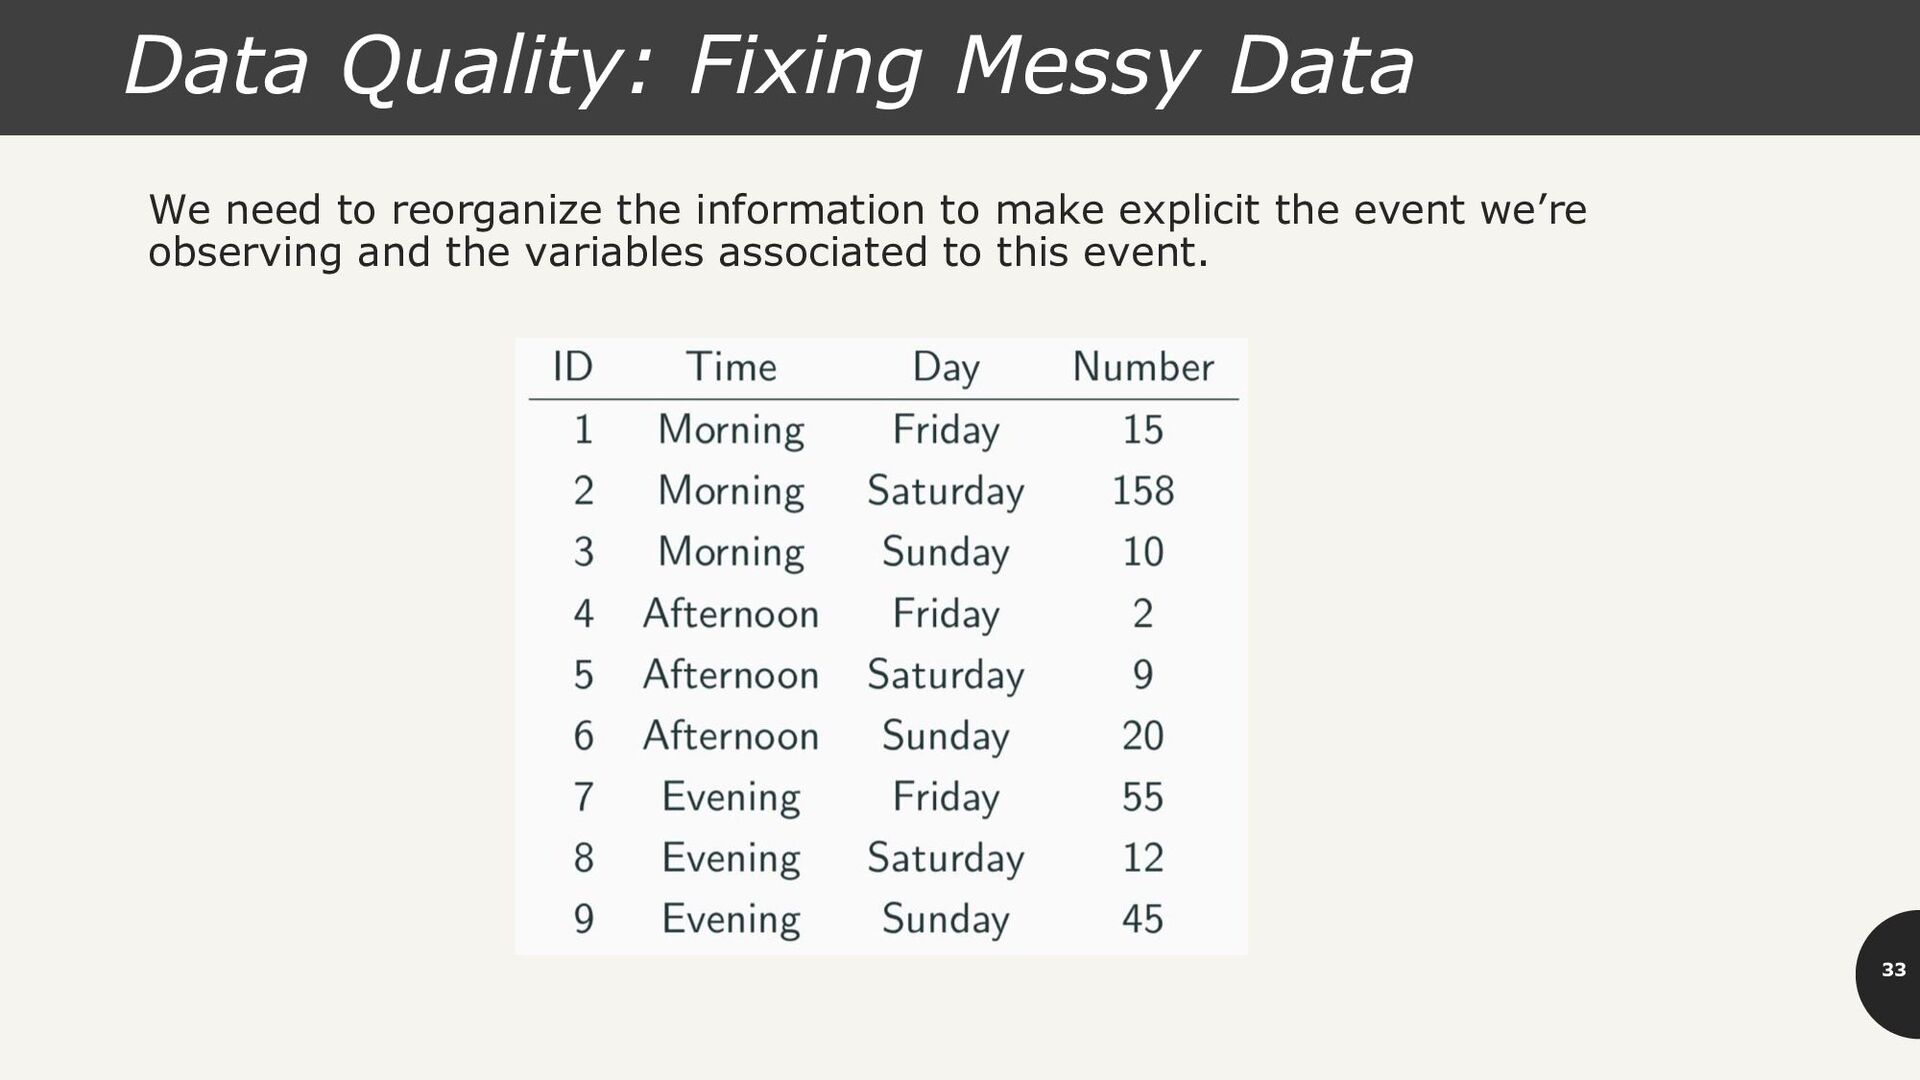
accounting for the number of produce deliveries over a weekend. • What are the variables in this dataset? What object or event are we measuring? • What’s the issue? How do we fix it?
variables are Time, Day, Number of Produce. Problem: each column header represents a single value rather than a variable. Row headers are “hiding” the Day variable. The values of the variable, “Number of Produce”, is not recorded in a single column.
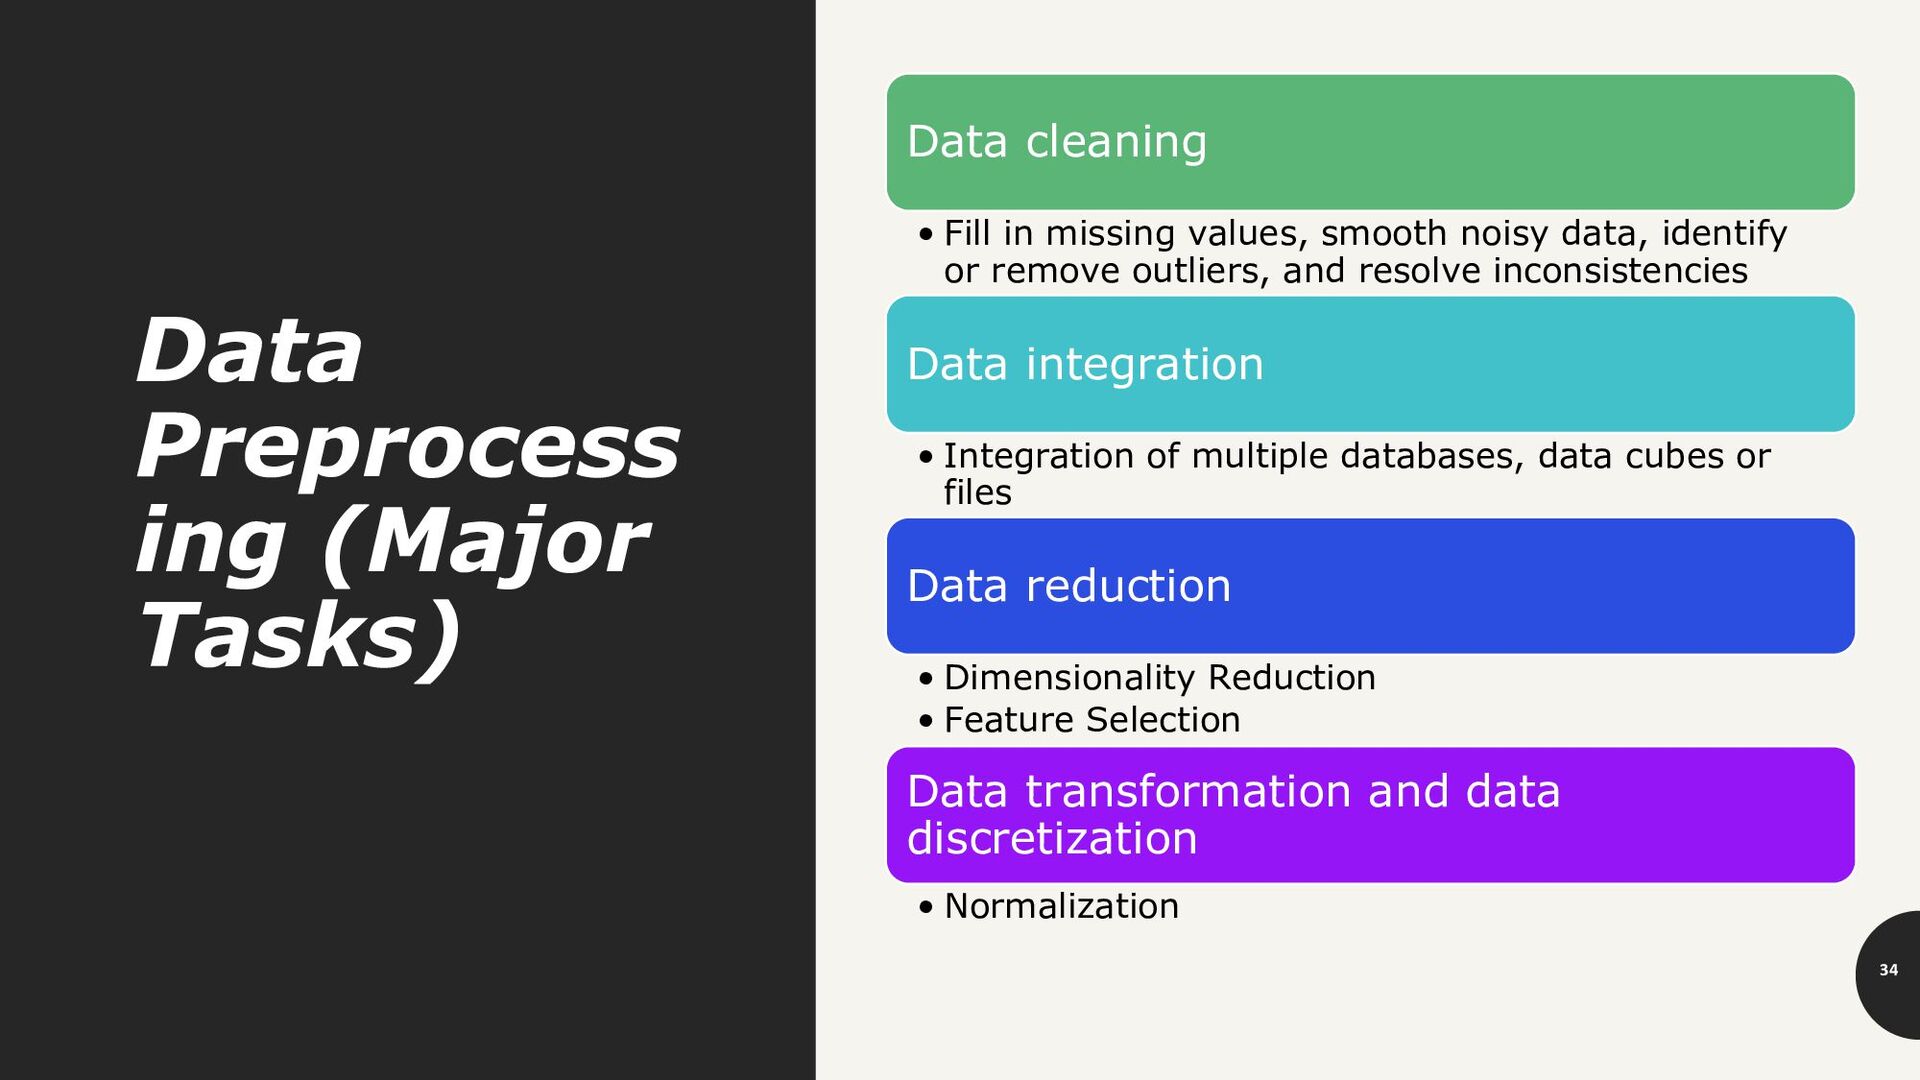
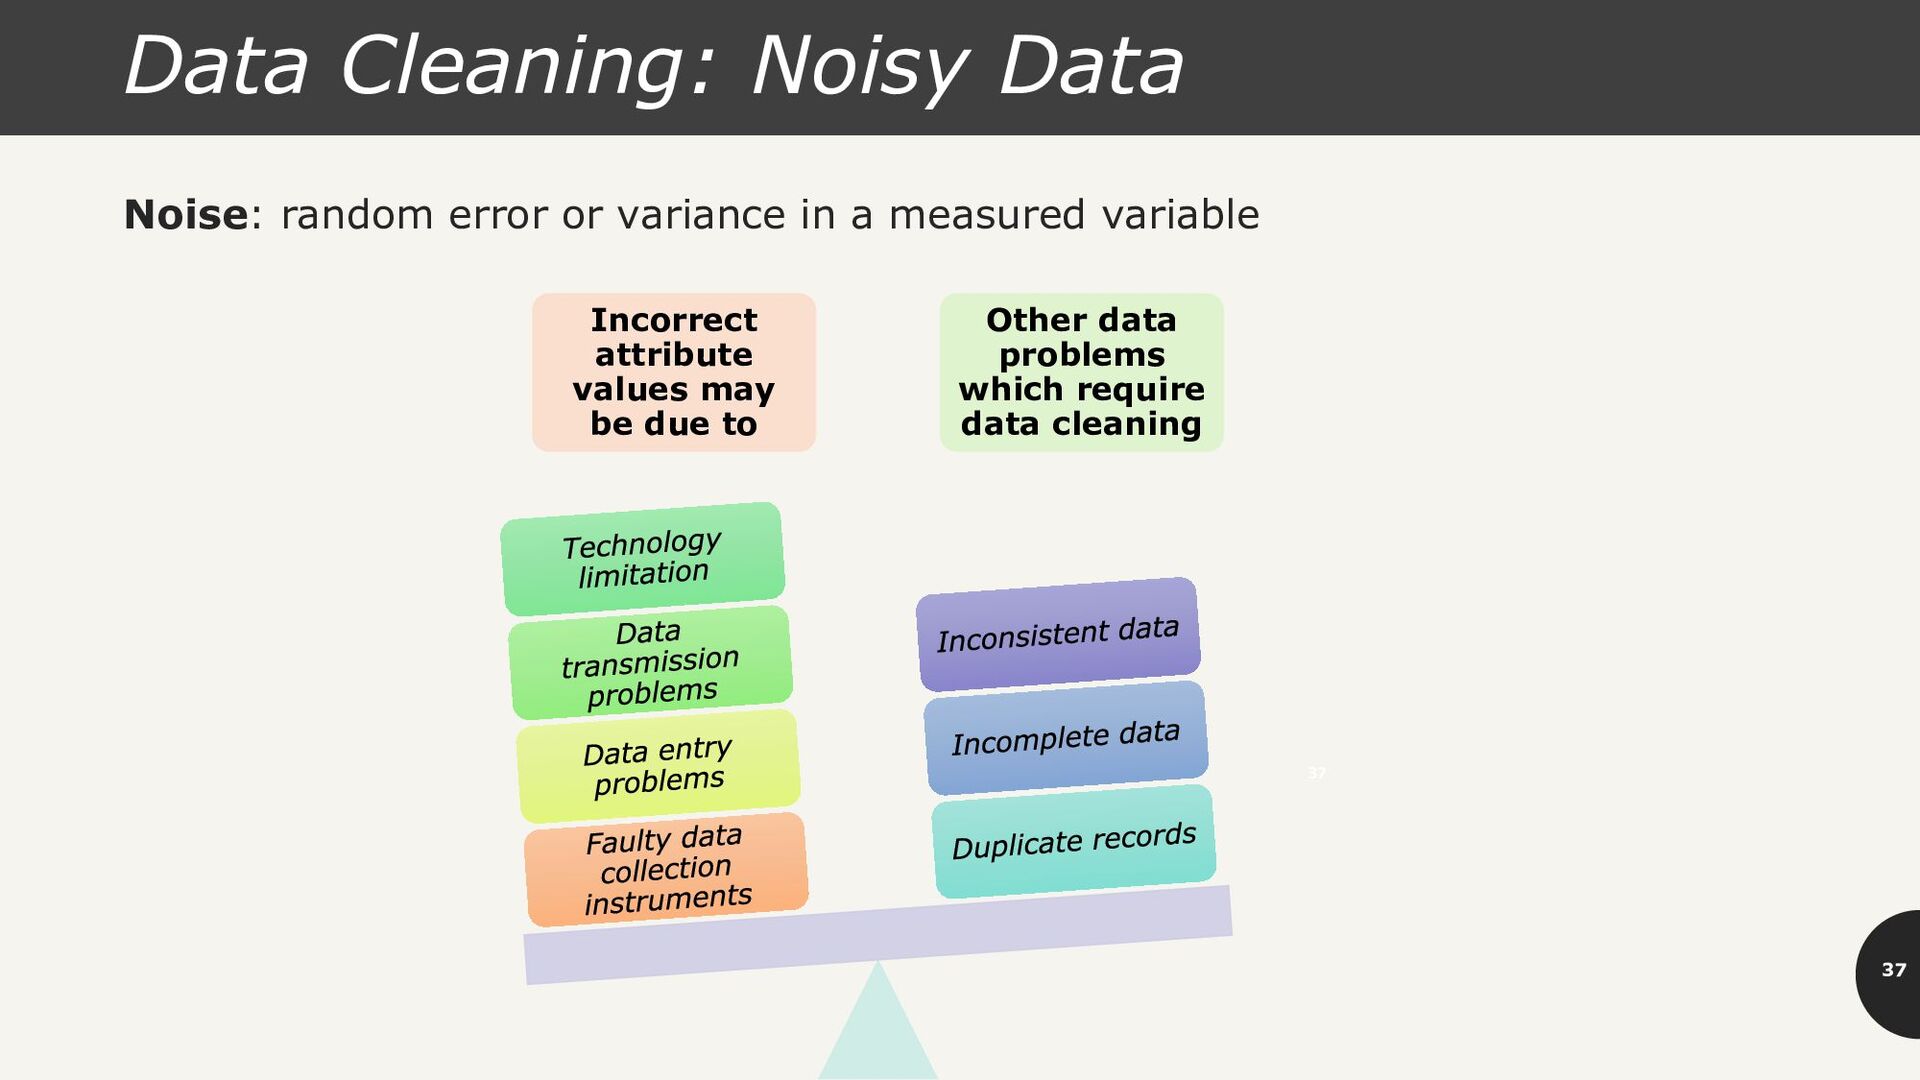
in missing values, smooth noisy data, identify or remove outliers, and resolve inconsistencies Data integration • Integration of multiple databases, data cubes or files Data reduction • Dimensionality Reduction • Feature Selection Data transformation and data discretization • Normalization
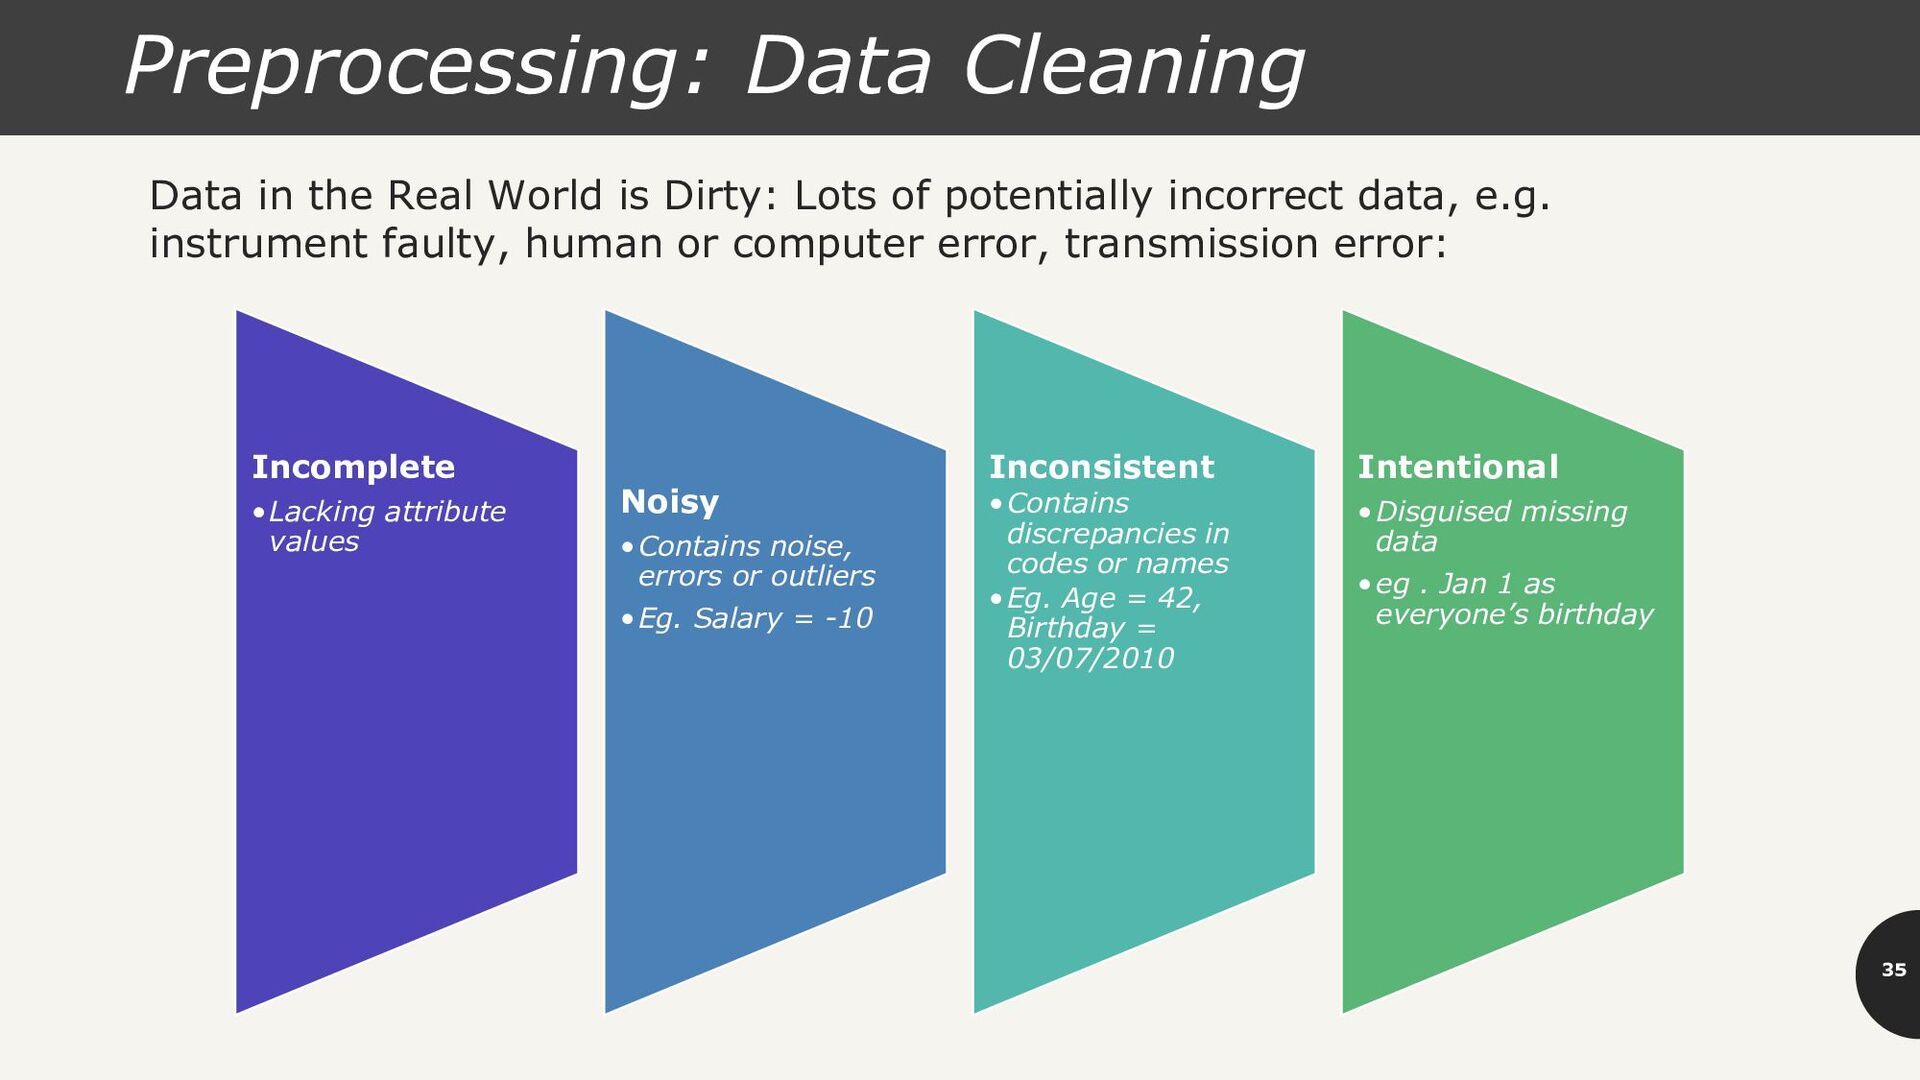
Dirty: Lots of potentially incorrect data, e.g. instrument faulty, human or computer error, transmission error: Incomplete •Lacking attribute values Noisy •Contains noise, errors or outliers •Eg. Salary = -10 Inconsistent •Contains discrepancies in codes or names •Eg. Age = 42, Birthday = 03/07/2010 Intentional •Disguised missing data •eg . Jan 1 as everyone’s birthday
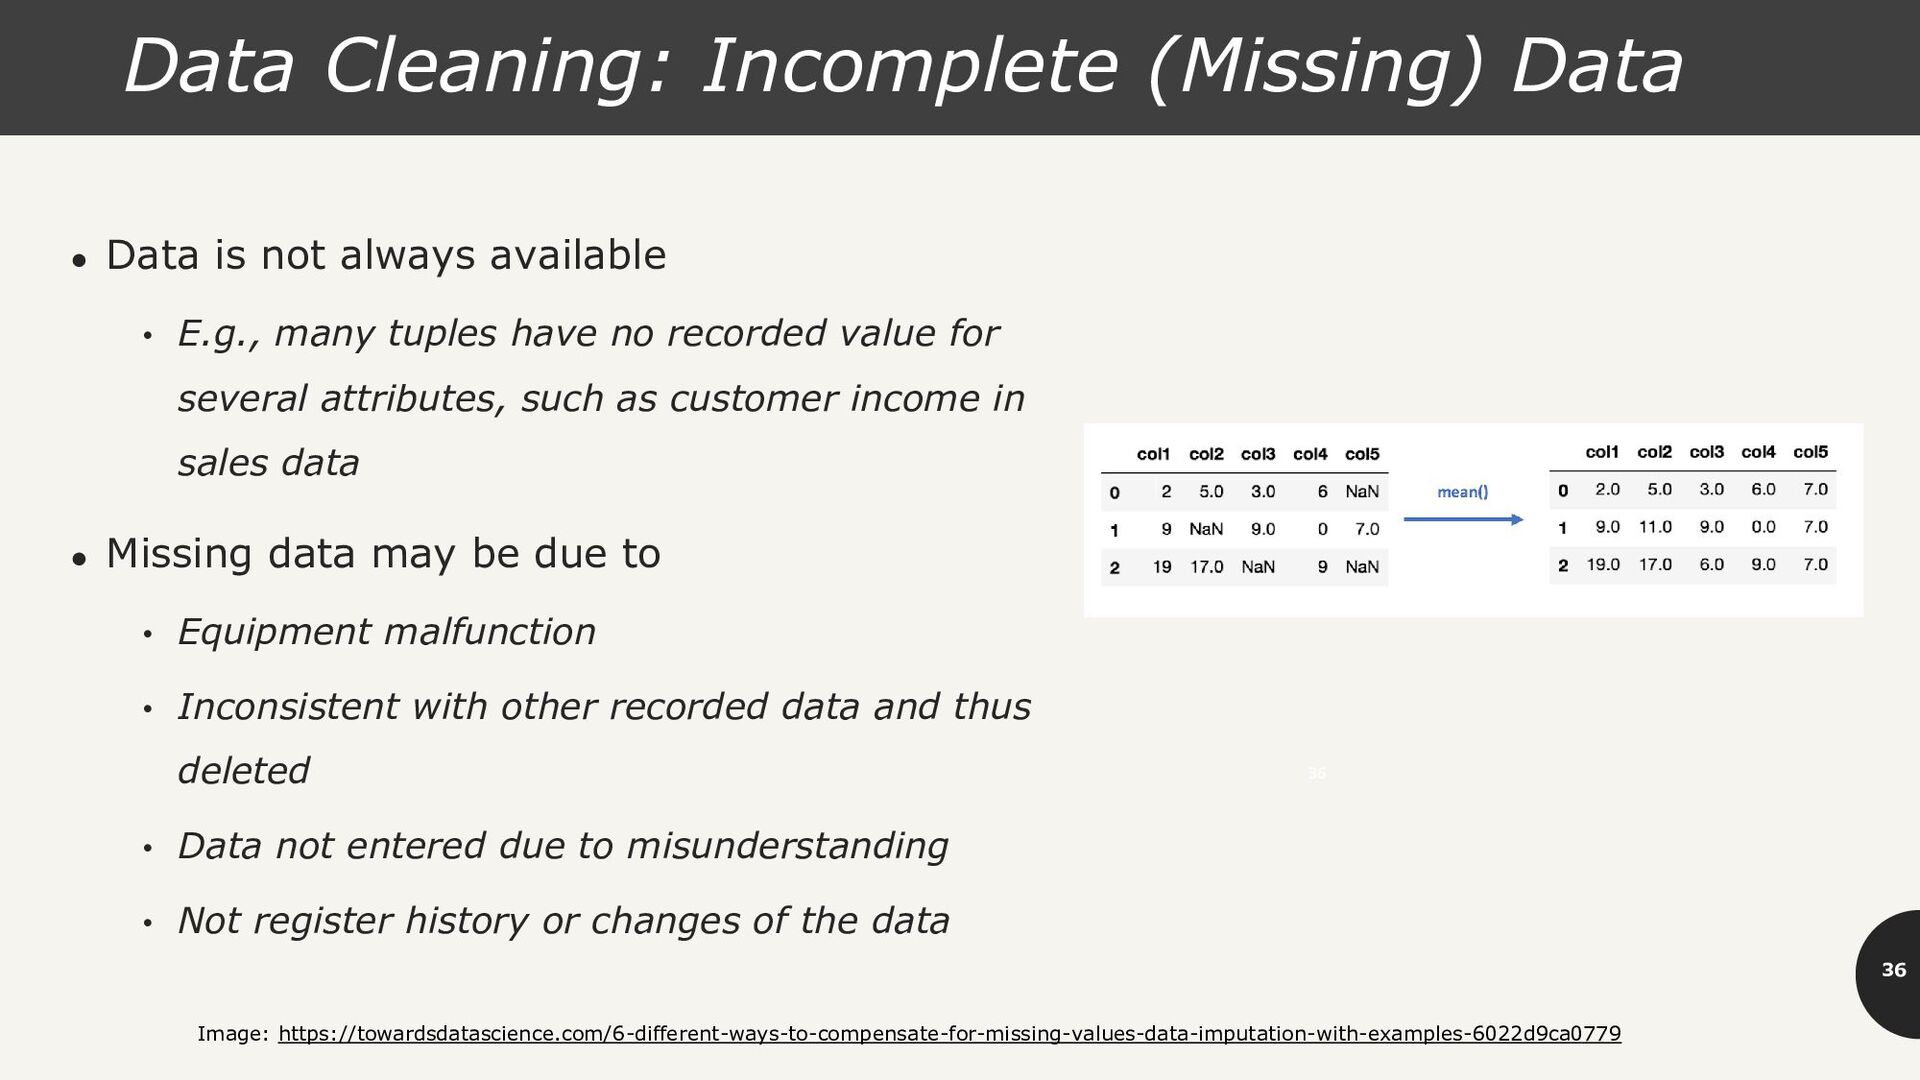
always available • E.g., many tuples have no recorded value for several attributes, such as customer income in sales data • Missing data may be due to • Equipment malfunction • Inconsistent with other recorded data and thus deleted • Data not entered due to misunderstanding • Not register history or changes of the data 36 Image: https://towardsdatascience.com/6-different-ways-to-compensate-for-missing-values-data-imputation-with-examples-6022d9ca0779
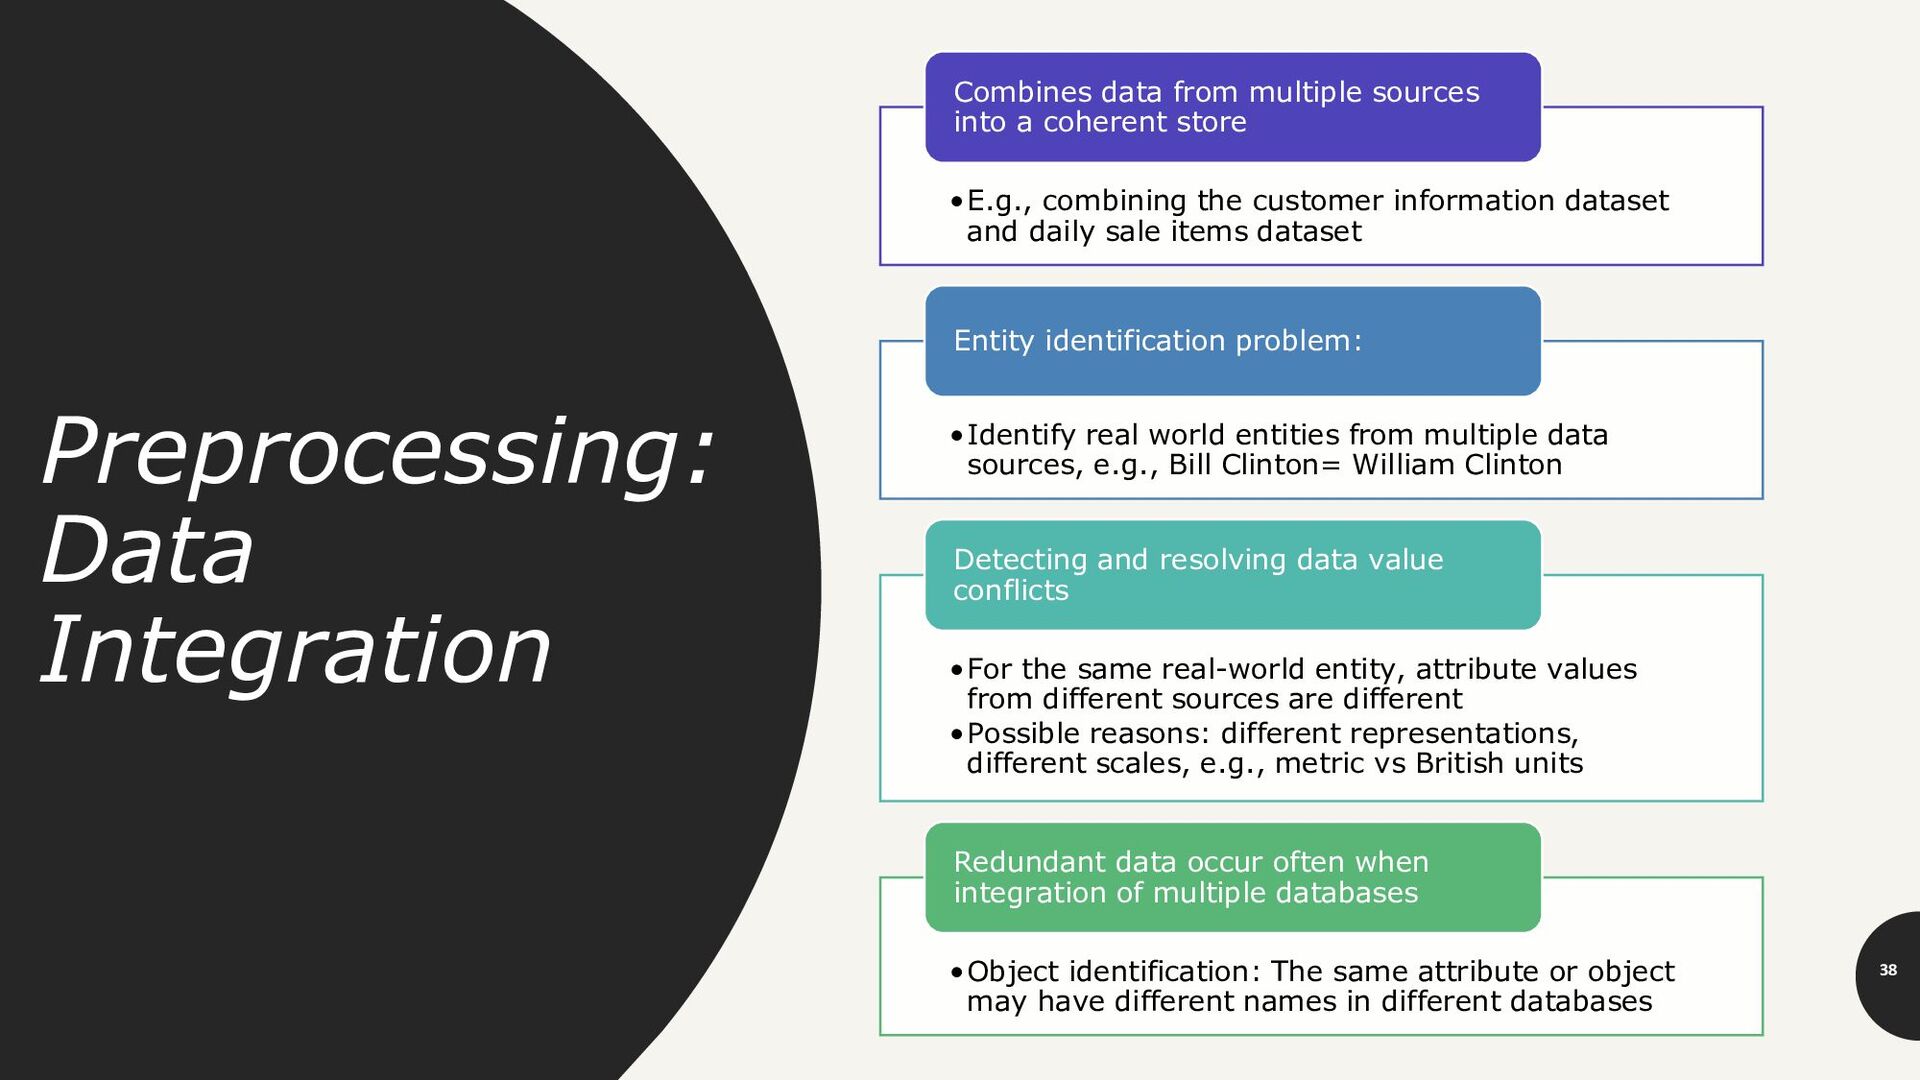
and daily sale items dataset Combines data from multiple sources into a coherent store •Identify real world entities from multiple data sources, e.g., Bill Clinton= William Clinton Entity identification problem: •For the same real-world entity, attribute values from different sources are different •Possible reasons: different representations, different scales, e.g., metric vs British units Detecting and resolving data value conflicts •Object identification: The same attribute or object may have different names in different databases Redundant data occur often when integration of multiple databases
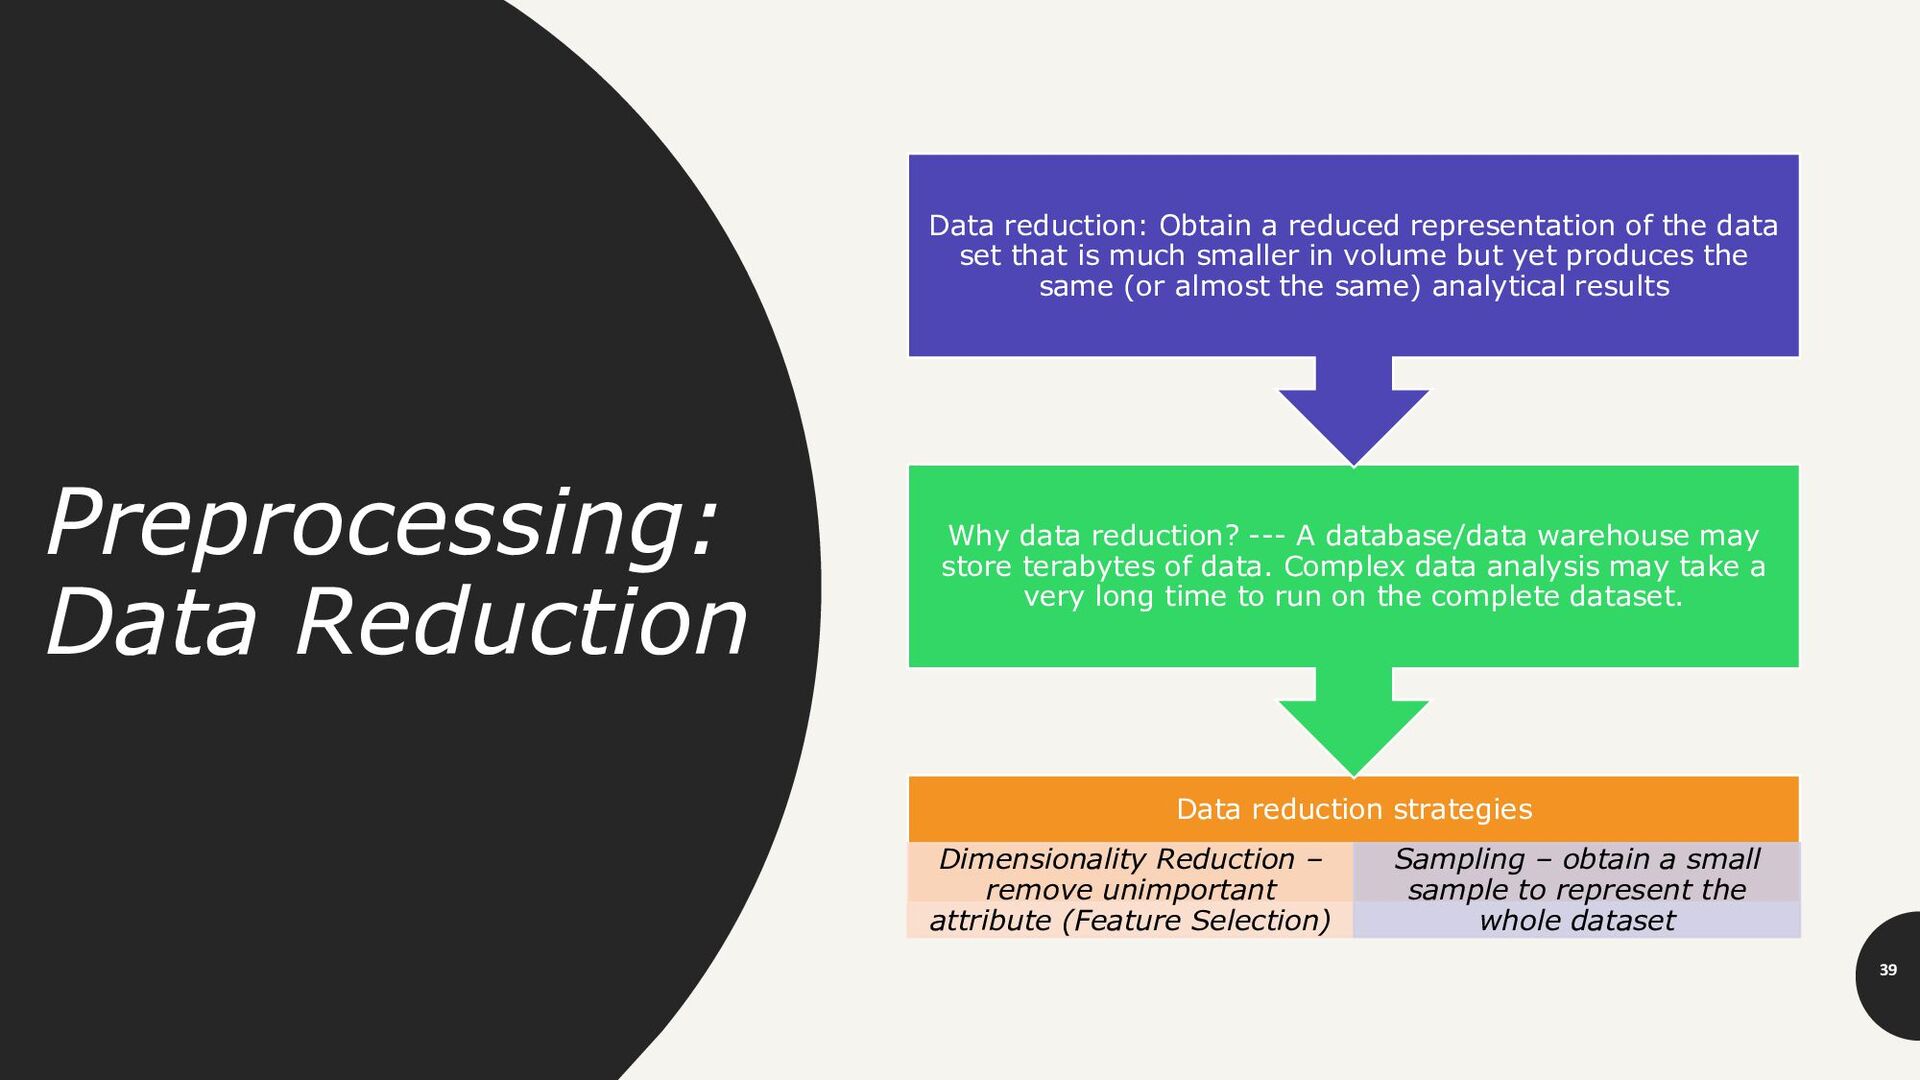
remove unimportant attribute (Feature Selection) Sampling – obtain a small sample to represent the whole dataset Why data reduction? --- A database/data warehouse may store terabytes of data. Complex data analysis may take a very long time to run on the complete dataset. Data reduction: Obtain a reduced representation of the data set that is much smaller in volume but yet produces the same (or almost the same) analytical results
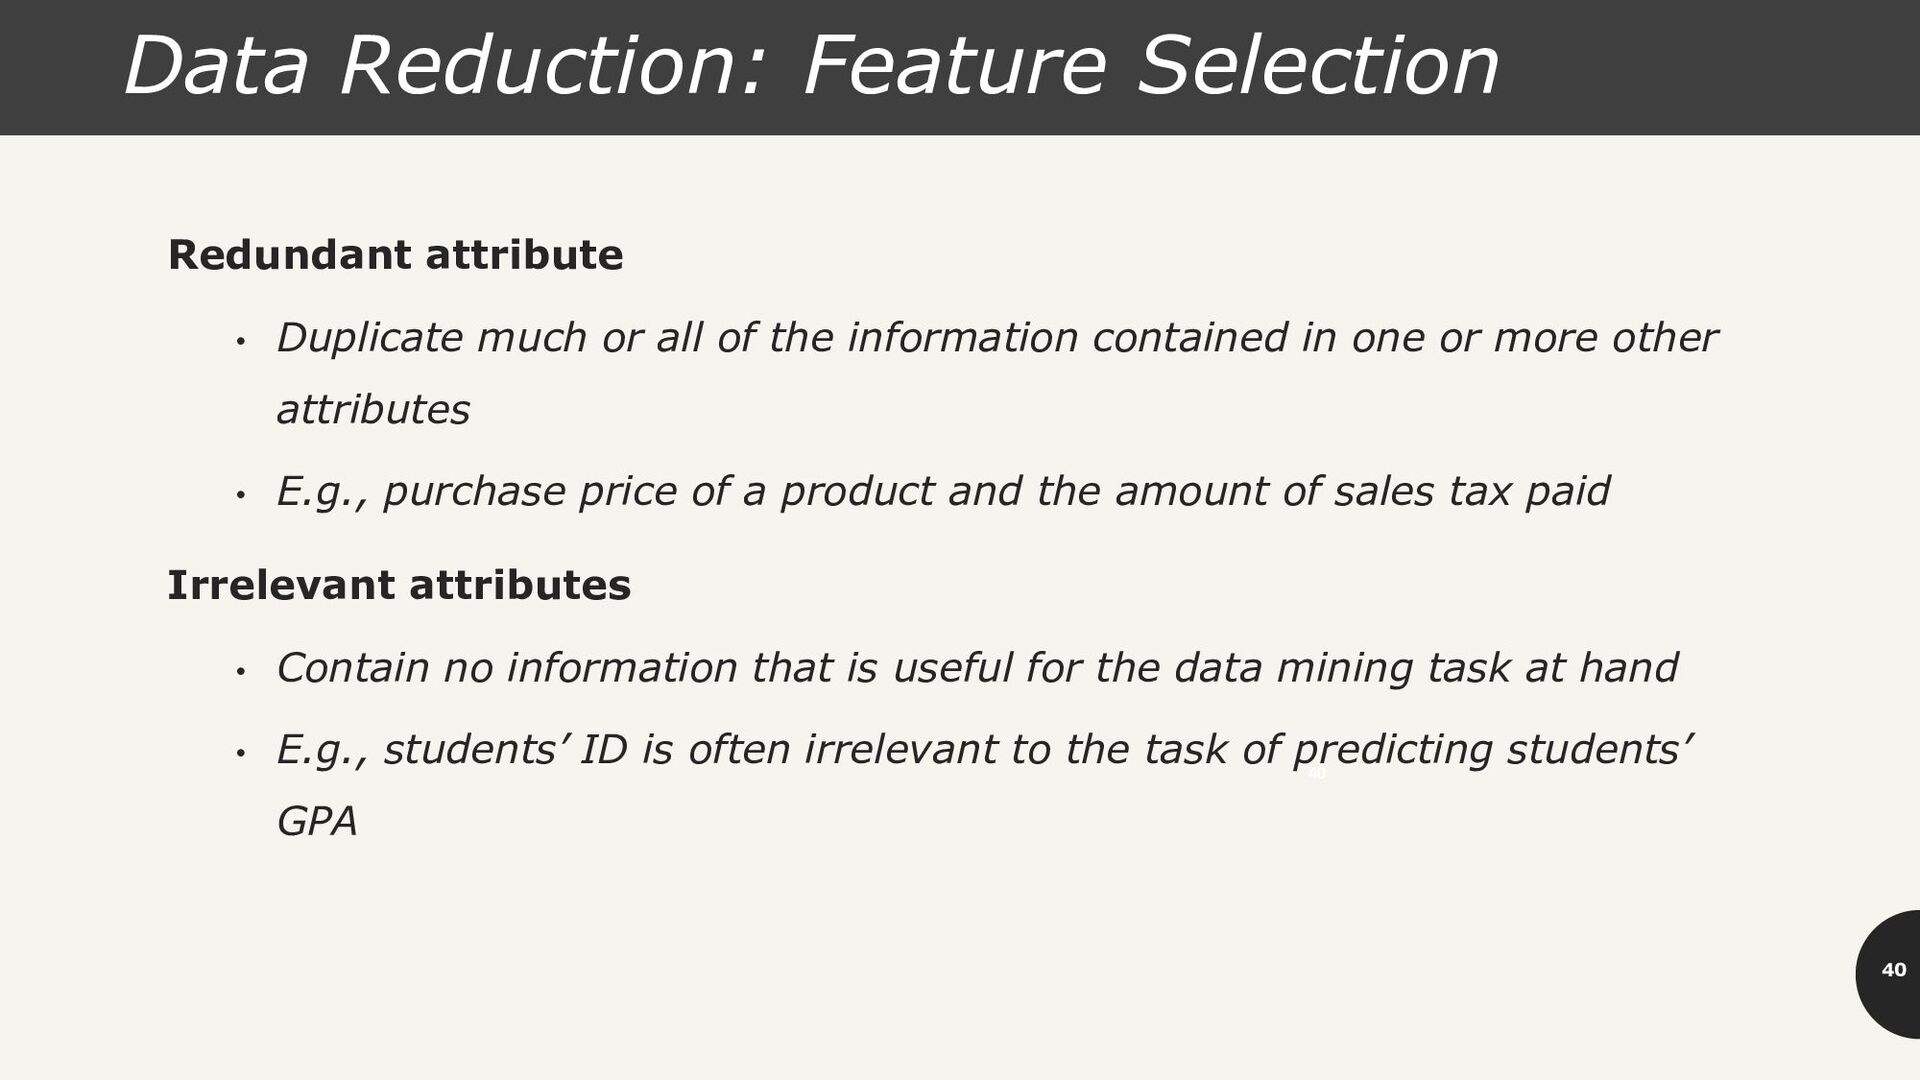
or all of the information contained in one or more other attributes • E.g., purchase price of a product and the amount of sales tax paid Irrelevant attributes • Contain no information that is useful for the data mining task at hand • E.g., students’ ID is often irrelevant to the task of predicting students’ GPA 40
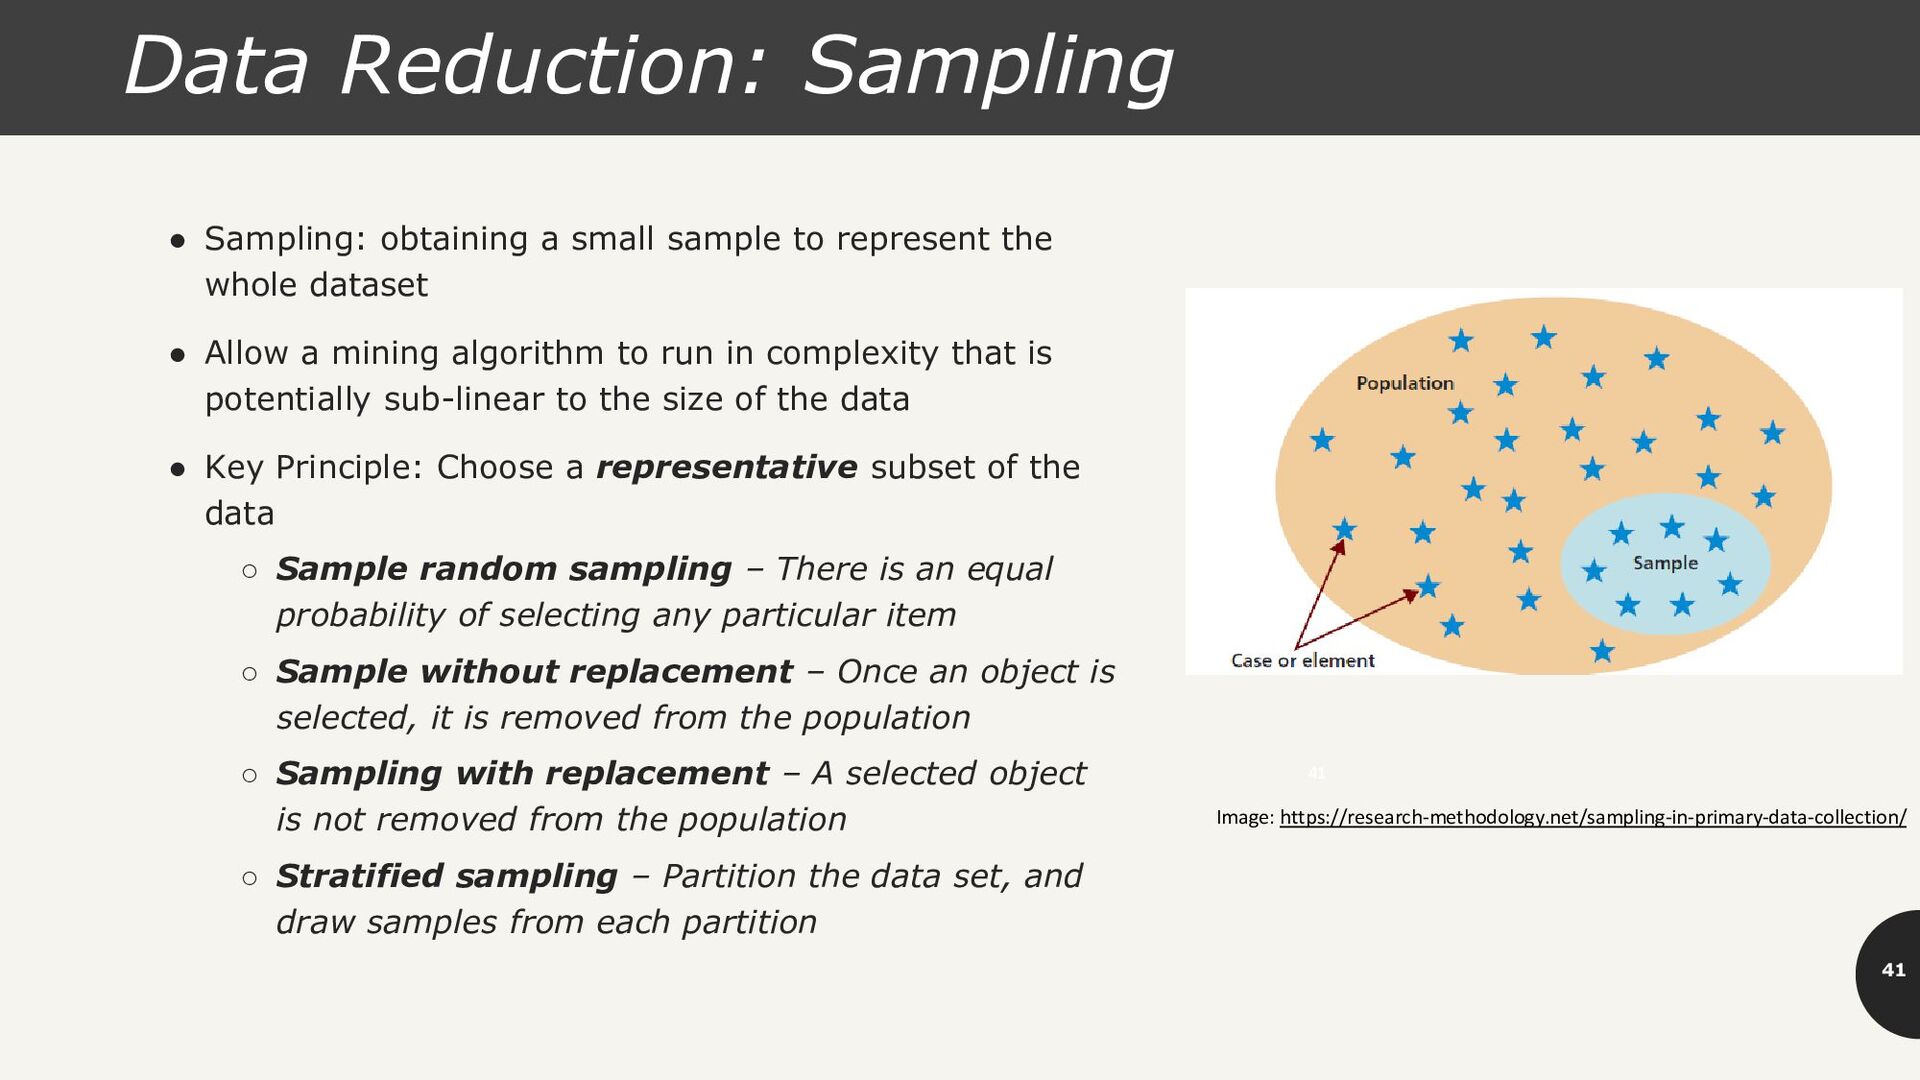
to represent the whole dataset • Allow a mining algorithm to run in complexity that is potentially sub-linear to the size of the data • Key Principle: Choose a representative subset of the data ◦ Sample random sampling – There is an equal probability of selecting any particular item ◦ Sample without replacement – Once an object is selected, it is removed from the population ◦ Sampling with replacement – A selected object is not removed from the population ◦ Stratified sampling – Partition the data set, and draw samples from each partition 41 Image: https://research-methodology.net/sampling-in-primary-data-collection/
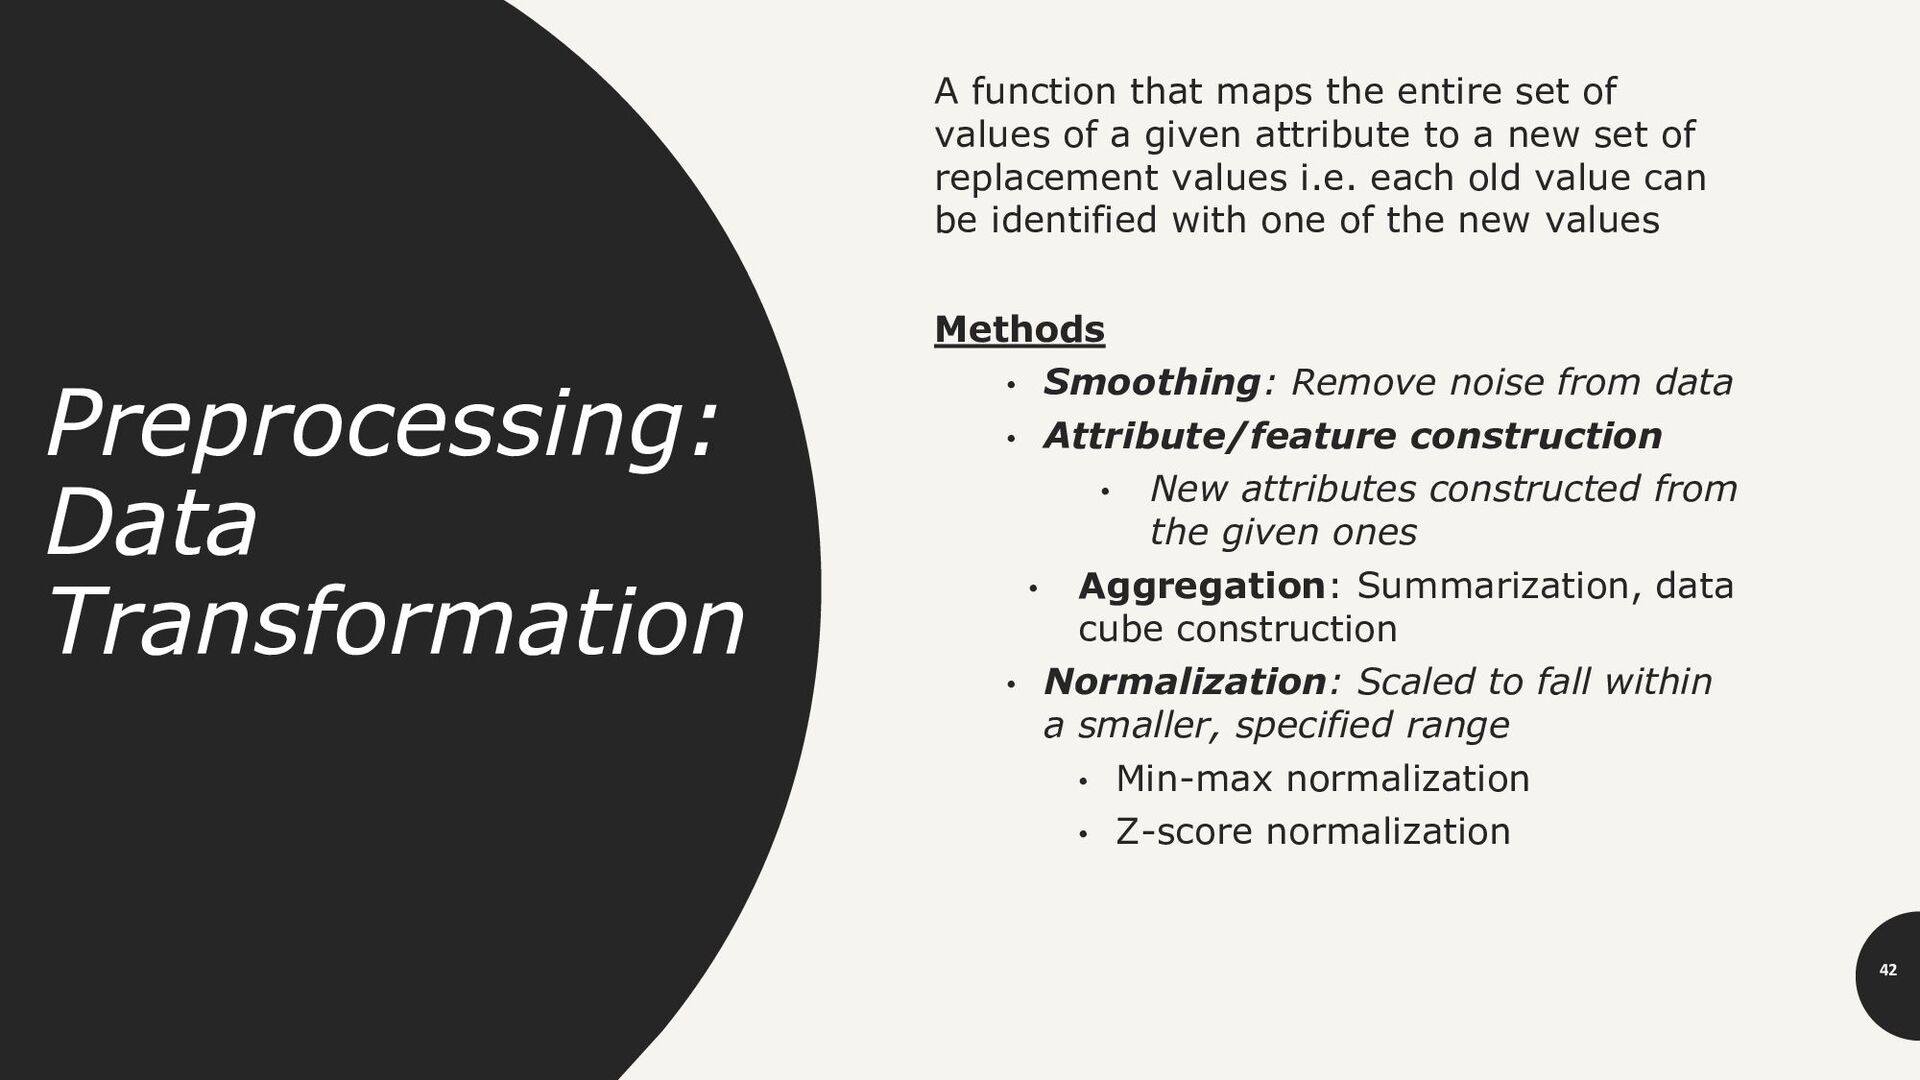
set of values of a given attribute to a new set of replacement values i.e. each old value can be identified with one of the new values Methods • Smoothing: Remove noise from data • Attribute/feature construction • New attributes constructed from the given ones • Aggregation: Summarization, data cube construction • Normalization: Scaled to fall within a smaller, specified range • Min-max normalization • Z-score normalization
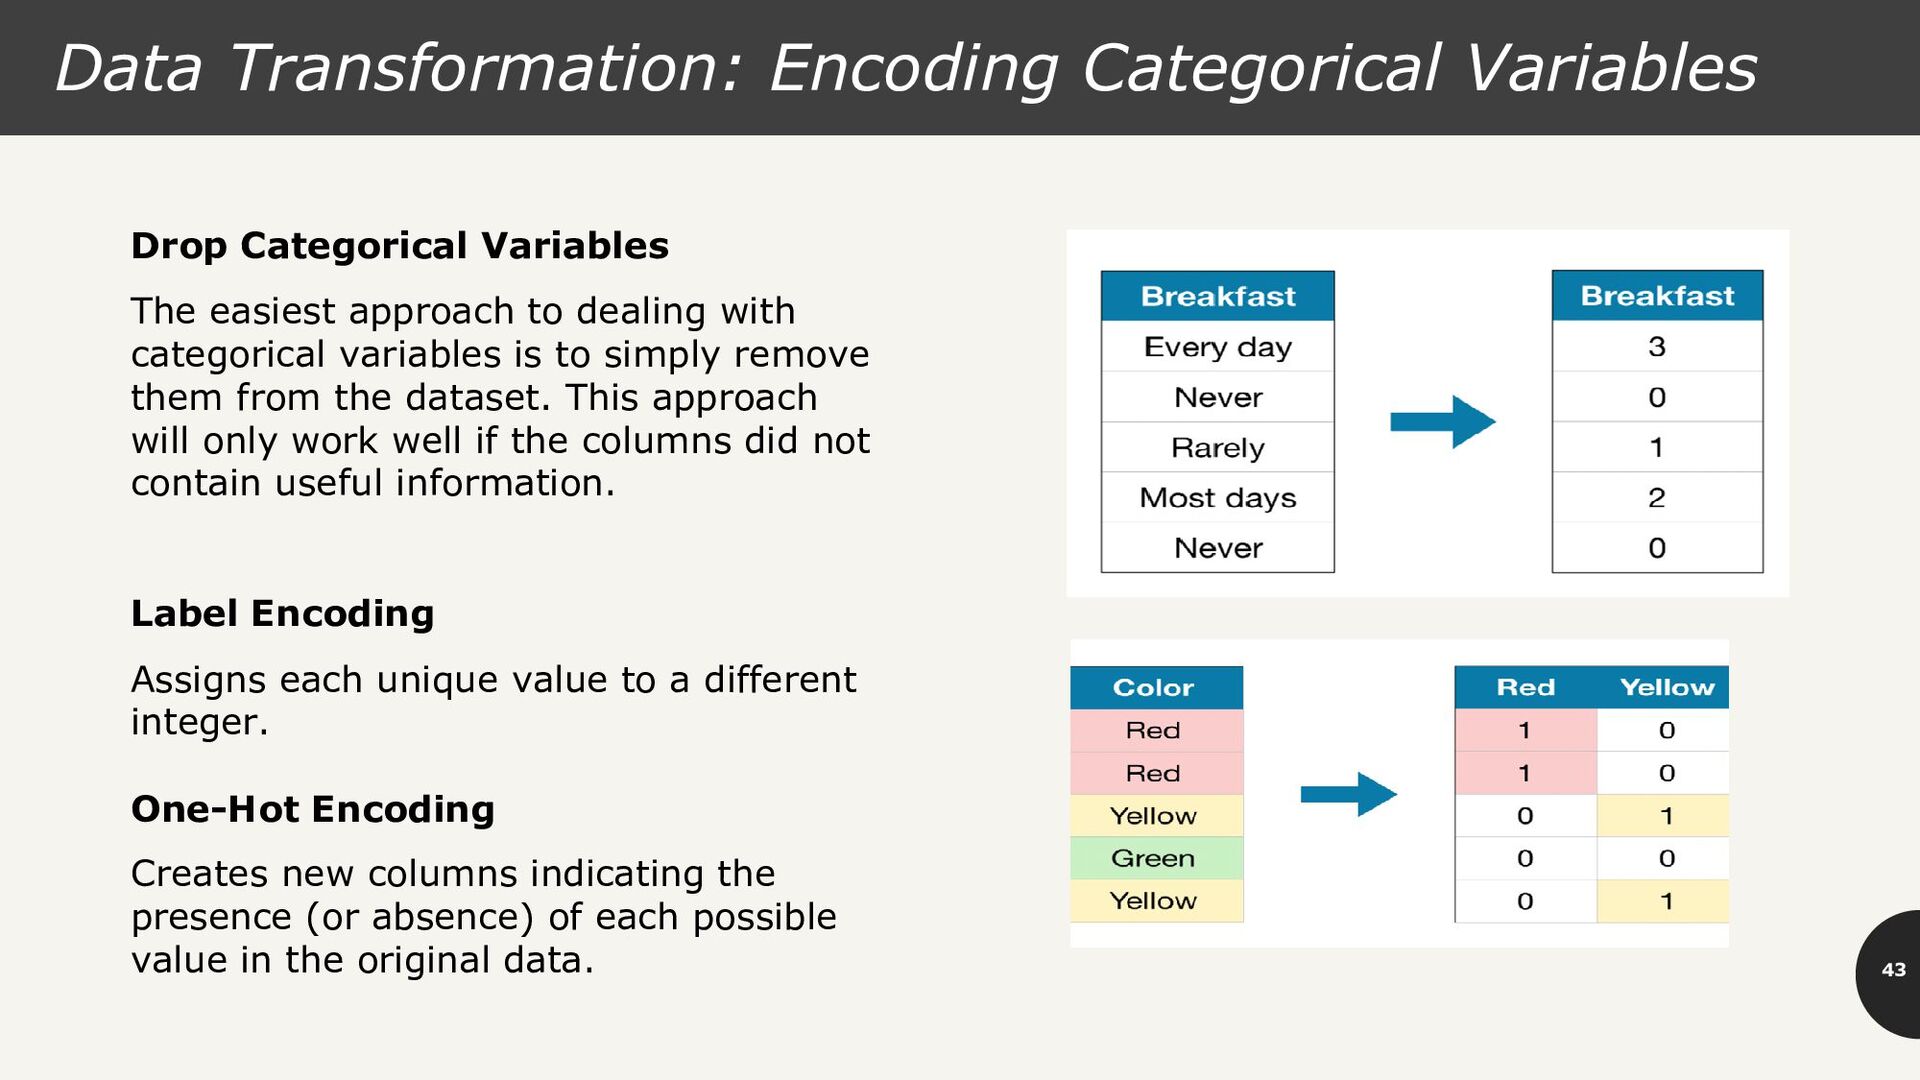
The easiest approach to dealing with categorical variables is to simply remove them from the dataset. This approach will only work well if the columns did not contain useful information. Label Encoding Assigns each unique value to a different integer. One-Hot Encoding Creates new columns indicating the presence (or absence) of each possible value in the original data.
] Ex. Let income range $12,000 to $98,000 normalized to [0.0, 1.0]. Then $73,600 is mapped to Z-score normalization (μ: mean, σ: standard deviation): Ex. Let μ = 54,000, σ = 16,000. Then
Jiawei Han, Micheline Kamber, and Jian Pei, University of Illinois and Simon Fraser University • CS109A, Introduction to Data Science, Harvard University (https://harvard- iacs.github.io/2019-CS109A/)
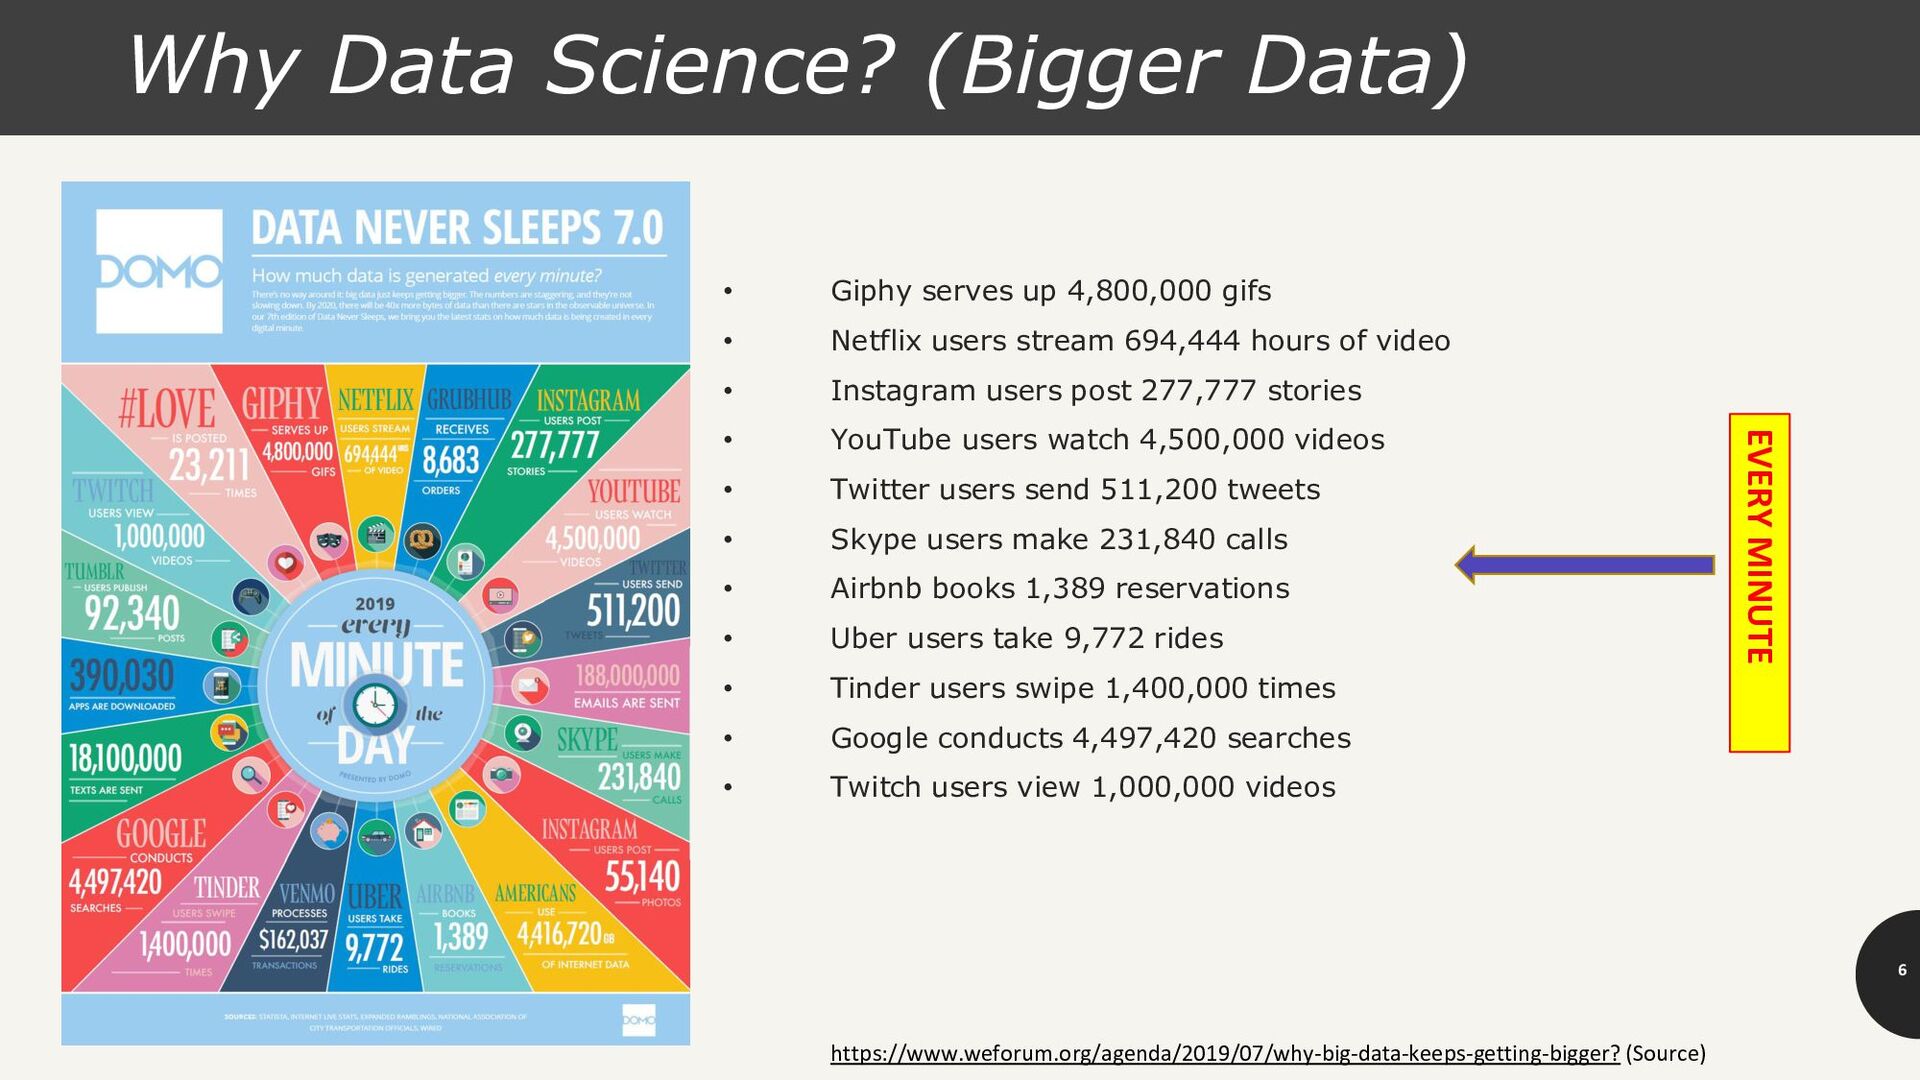
![[Source: Data Flair Training]](https://files.speakerdeck.com/presentations/82ff922ed14642ffb1dddad9d2aa1ea6/slide_6.jpg)