Upgrade to Pro — share decks privately, control downloads, hide ads and more …

AzureBootcamp2022: Introduction to Azure Monitoring by Thomas Hafermalz

AzureBootcamp2022: Introduction to Azure Monitoring by Thomas Hafermalz

This session is one of the sessions of Azure Bootcamp Switzerland 2022.
www.azurebootcamp.ch

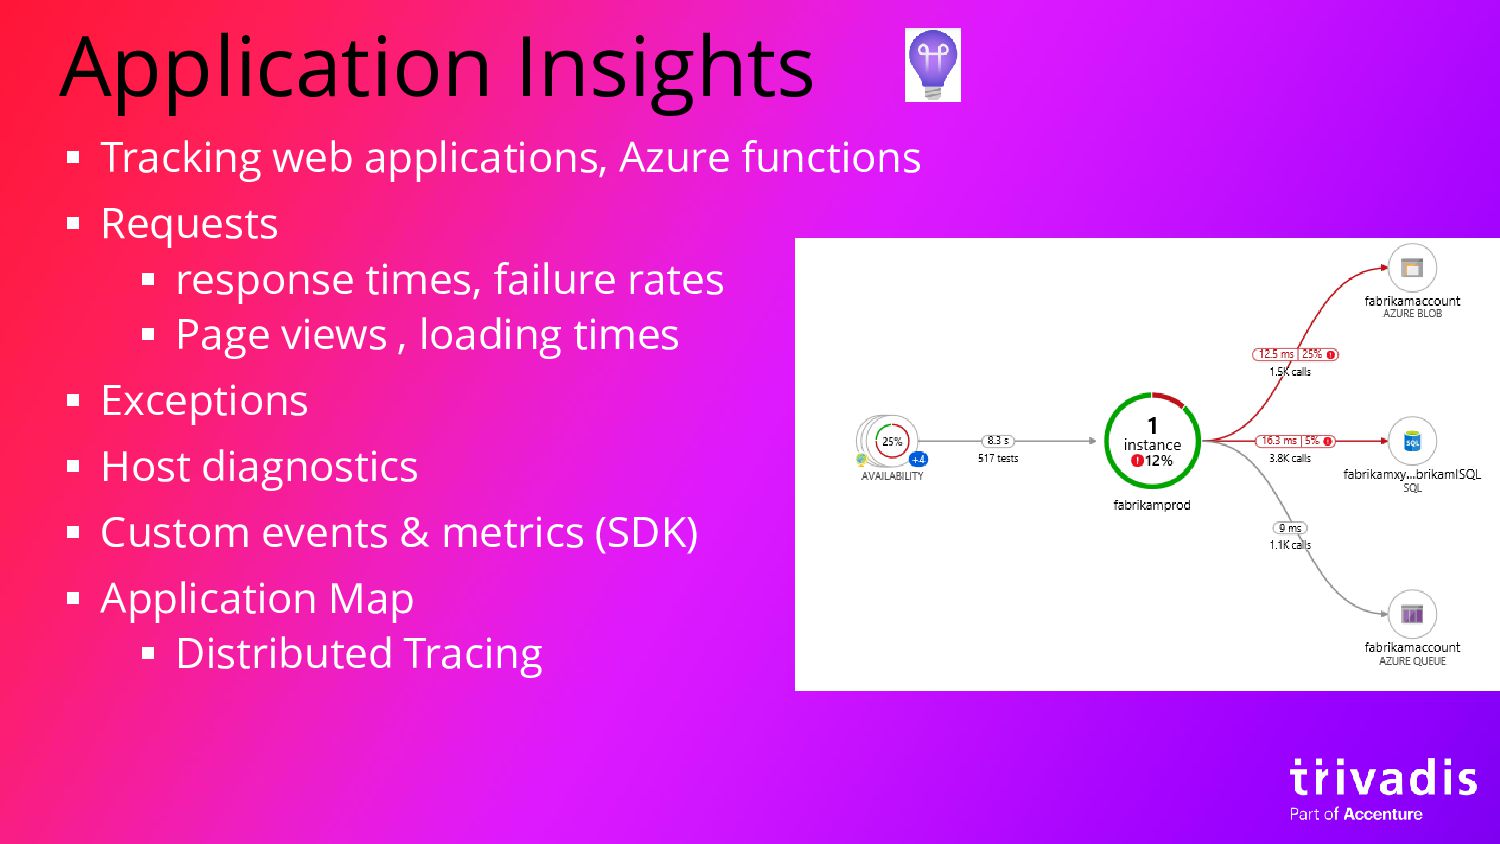
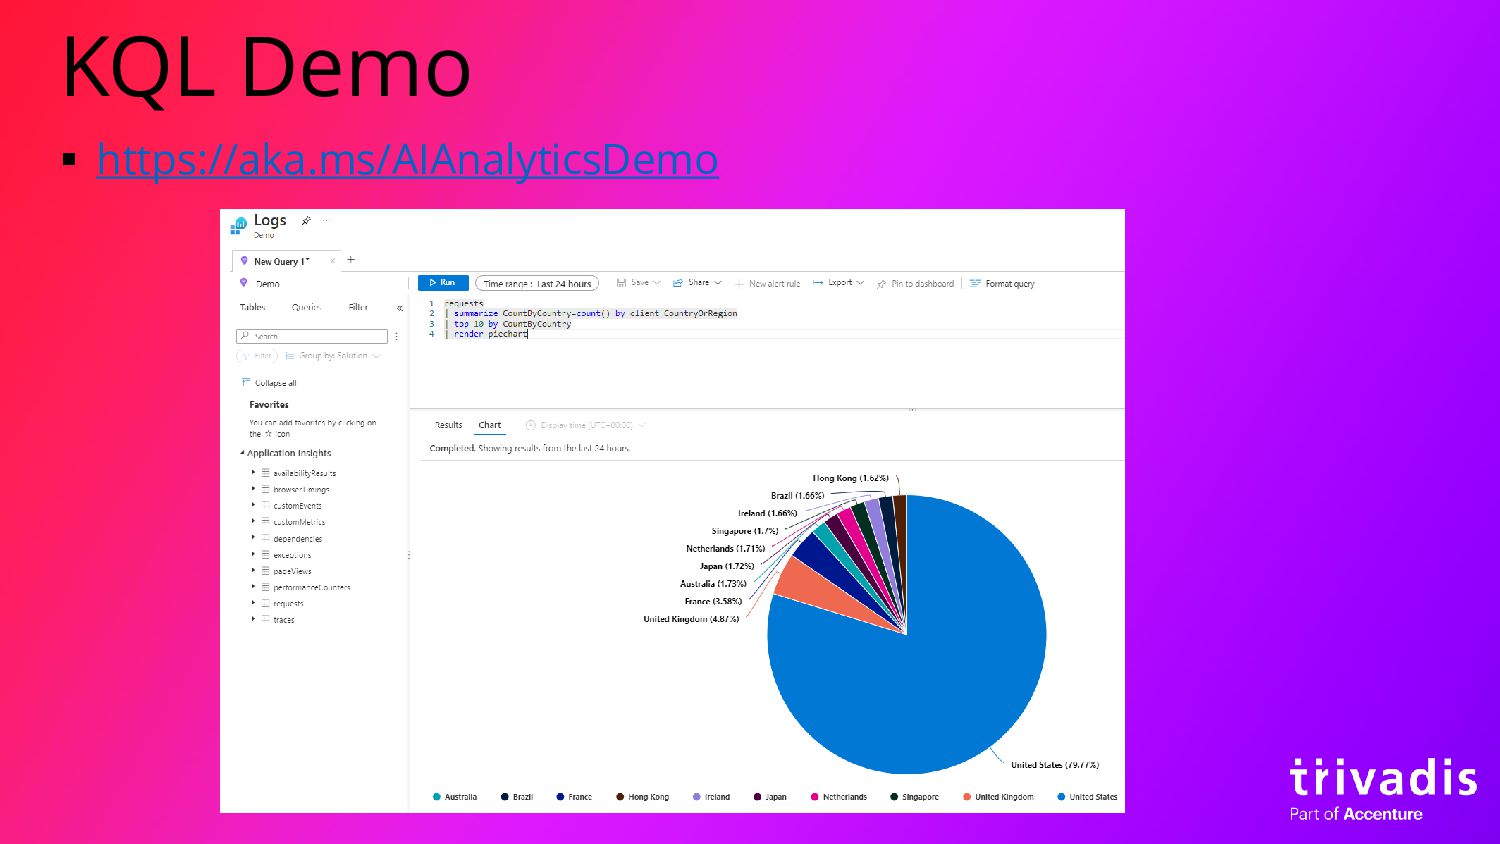
In this session I am going to provide an overview of the Azure Monitor(ing) options. We will learn from where you can get your telemetry data and how you can analyse it with queries and display options as well as how you can react on it, tangible with examples in a demo.

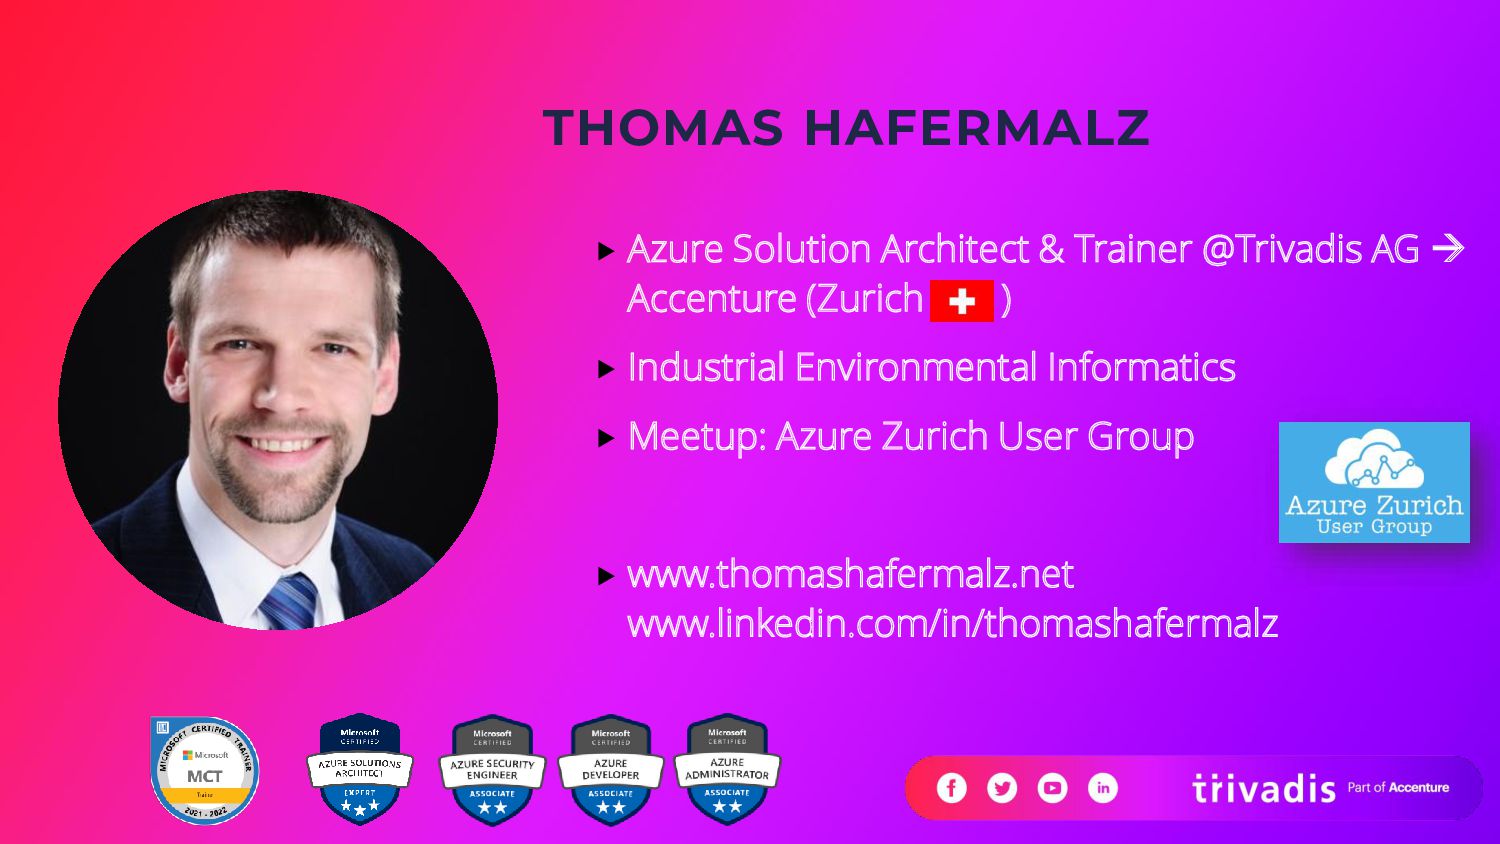
🙂 THOMAS HAFERMALZ ⚡️ Azure Solution Architect @ Trivadis

Check out Thomas at: https://www.linkedin.com/in/thomashafermalz/

More Decks by Azure Zurich User Group

Other Decks in Technology

Transcript

  1. History ▪ 2007: System Center Operations Manager (SCOM) ▪ 2015:

    Operations Mangement Suite (OMS) / Log Analytics
  2. History ▪ 2018: Azure Monitor Monitor your ▪ Applications ▪

    Infrastructure ▪ Network ▪ … (everything)
  3. Azure Monitor ▪ Standard service ▪ always available and does

    not need to be provisioned as an extra resource in a resource group ▪ Rich set of options for monitoring ▪ Data connection to a wide range of sources ▪ many analysis options ▪ Further processing in the business process.
  4. Azure Arc ▪ Handle different environments ▪ Multi-Cloud ▪ On-prem

    resources ▪ Azure Stack HCI ▪ Non-Azure resources get resourceId ▪ Servers (& SQL on VM) ▪ K8s Clusters ▪ →
  5. Data Types ▪ Metrics ▪ numeric data in a time-series

    database ▪ lightweight for real-time scenarios ▪ Logs ▪ Log Data in text form (JSON) ▪ Table data row with columns
  6. Monitoring Levels ▪ Tenant (AAD Logs) ▪ sign-in activities AAD

    ▪ Subscription (Activity logs) ▪ Subscription operations & Service health ▪ Ressource Level (Diagnostics Settings) ▪ Metrics, configuration changes ▪ Guest OS Data ▪ VM-Data ▪ Application ▪ Performance and functionality of the code
  7. Standard Monitoring ▪ Automatic collection of different data ▪ Logs

    & Metrics ▪ Retention time of data differs: ▪ Tenant Logs 30d ▪ Activity Logs 90d ▪ Metrics 93d ▪ Example: ▪ AppService / VM performance metrics ▪ Service Bus / Event Hub message traffic
  8. Log Analytics Workspace ▪ Central data repository for collection ▪

    Based on Azure Data Explorer Database ▪ Different sources = different tables
  9. Advanced: Diagnostic settings ▪ Ressource Level ▪ Different options depending

    on each Azure resource ▪ Requests on storage account ▪ Web Application Firewall Logs ▪ 3 Options sending the data to: ▪ Log Analytics Workspace ▪ Storage Account ▪ Event hub
  10. Virtual Machine Data ▪ 4-5 different agents to send the

    data! ▪ Azure Monitoring Agent launched ▪ Performance counters ▪ Boot diagnostics ▪ Network traffic ▪ Event Logs / Sys Logs ▪ Security Center
  11. Costs ▪ Data Exports, Custom Metrics, Alerts… ▪ Daily data

    cap configurable ▪ Capacity Reservations for Workspace possible ▪ Archive in Storage account possible. Feature Free Further Data Ingress 5 GB/Month/Bill Account ~ 2,23 CHF/GB Data Retention 31 d (Workspace) 90 d (AppInsights) ~ 0,09 CHF/GB/Month
  12. Network Watcher ▪ regional service for network diagnostics & monitoring

    ▪ Inspect traffic: ▪ IP flow verify for packet allowance / denial ▪ Route inspection ▪ Network diagrams ▪ Check VPN Gateways & connections ▪ Check combined working NSG rules
  13. KQL ▪ KQL (this context) = Kusto Query Language. ▪

    SQL-like query language, also based on tables and columns ▪ optimized for read queries of big data ▪ Invented for MSFT Big Data Telemetry Analysis ▪ Azure Data Explorer ▪ Used in ▪ Resource Graph ▪ Log Analytics Workspace ▪ Application Insights ▪ Data Explorer
  14. KQL ▪ Queries: ▪ Essentially: table source, filtered with conditions

    and possible projections ▪ The pipe | operator is used to pass the intermediate results. ▪ MSSQL: SELECT operation_Name, type, method FROM exceptions WHERE operation_Name = “Myfunction” ▪ → KQL: exceptions | where operation_Name == “Myfunction” | project operation_Name, type, method
  15. Workbooks ▪ Kind of interactive dashboard ▪ collections of KQL

    queries & charts ▪ Parametrizable, results chainable
  16. Alerts ▪ Always based on log / metric data ▪

    Scope ▪ Which resource / subscription shall be checked? ▪ Definition of signals and criteria ▪ Which condition / Query / event ▪ Definition of Action Groups ▪ Who should be notified? ▪ Additional actions ▪ States: ▪ New, Acknowledged, Closed
  17. Alerts - Attention ▪ Specifying a query period in alert

    config actually already filters ▪ only this subset is queried, regardless of timeframe stated in the query ▪ selection of a stored query only takes over its text - no reference is made ▪ action groups and the alert rules are stored as resources in a resource group. However, these are hidden by default.
  18. Insights ▪ Applications Insights ▪ own resource, application monitoring ▪

    “Additional” insights ▪ Tailored monitoring view for several resources ▪ VM Insights ▪ Container Insights ▪ Key Vault ▪ Storage ▪ Some require Workspace / configuration
  19. Application Insights ▪ Tracking web applications, Azure functions ▪ Requests

    ▪ response times, failure rates ▪ Page views , loading times ▪ Exceptions ▪ Host diagnostics ▪ Custom events & metrics (SDK) ▪ Application Map ▪ Distributed Tracing
  20. THOMAS HAFERMALZ  Azure Solution Architect & Trainer @Trivadis AG

    → Accenture (Zurich )  Industrial Environmental Informatics  Meetup: Azure Zurich User Group  www.thomashafermalz.net www.linkedin.com/in/thomashafermalz