Challenges l 12-OCT-2012 l 2 l Team Details # Employee ID Employee Name Emp Photo Business Unit Name of Project 1 2040049 Sudhakar Guntupalli APPS AIG ERMO & S 2 2131120 Ganesh.Jegannathan APPS AIG PPM 3 2101009 Balaje Viswanaathan APPS BIDW
Challenges l 12-OCT-2012 l 3 l Table of Contents 1. Executive Summary .................................... 4 2. What is "Big Data" ..................................... 5 3. Drivers for BIG Data ................................... 5 4. Data stores by geography ............................... 6 5. Data type generated and stored varies by sector ....... 7 6. BIG Data for Enterprise solutions ...................... 7 7. Key Ingredients of “Big Data” Analytics .............. 9 8. Big Data Best Practices ................................. 9 9. Big Data Landscape for Insurance projects .......... 10 10. Conclusion .......................................... 13 11. Reference ............................................ 13
Challenges l 12-OCT-2012 l 4 l 1. Executive Summary The volumes and complexity of market data required by BFSI , Retail, Healthcare , Communication and Media , Energy and Utilities etc today are immense and growing rapidly. Ongoing market changes are accelerating the growth in demand for data, and forcing all the industries address the challenges of what has come to be known as “Big Data”. This demand is fueled as firms develop and deploy new, more sophisticated strategies. At the same time regulatory changes are also forcing firms to source and report increasingly larger amounts of trade data, as well as to adopt higher- quality – and usually data-hungry – risk and pricing models The explosive growth in the amount of data created in the world continues to accelerate and surprise us in terms of sheer volume. Transactional data has grown in velocity and volume at many companies Social network data is another source adding to the superabundance of data. The micro-blogging site Twitter serves more than 200 million users who produce more than 90 million “tweets” per day, or 800 per second. Each of these posts is approximately 200 bytes in size. On an average day, this traffic equals more than 12 gigabytes, and, throughout the Twitter ecosystem, the company produces a total of eight terabytes of data per day1 Facebook announced they had surpassed the 750 million active-user mark, making the social networking site the largest consumer-driven data source in the world. Facebook users spend more than 700 billion minutes per month on the service, and the average user creates 90 pieces of content every 30 days. Each month, the community creates more than 30 billion pieces of content ranging from Web links, news, stories, blog posts and notes, to videos and photos. Everywhere you look, the quantity of information in the world is soaring. The term “Big Data” has emerged to describe this monstrous growth in data. “Big Data” represents data sets whose characteristics are comprised of high volume, high velocity, and a variety of data structures.
Challenges l 12-OCT-2012 l 5 l 2. What is "Big Data" Definition: “Extremely scalable analytics – analyzing petabytes of structured and unstructured data at high velocity.” “Big data is data that exceeds the processing capacity of conventional data base systems.” Technology vendors in the legacy database or data warehouse spaces say “big data” simply refers to a traditional data warehousing scenario involving data volumes in either the single or multi-terabyte range. Others disagree: They say “big data” isn’t limited to traditional data warehouse situations, but includes real-time or operational data stores used as the primary data foundation for online applications that power key external or internal business systems. It used to be that these transactional/real-time databases were typically “pruned” so they could be manageable from a data volume standpoint. Their most recent or “hot” data stayed in the database, and older information was archived to a data warehouse via extract-transform-load (ETL) routines 3. Drivers for BIG Data Velocity – how fast the data is coming in Speed or Velocity of data is another defining characteristic of “Big Data.” Data Velocity encompasses the frequency of data generation and the frequency of data delivery. In today’s hyper-connected and networked society, there is a continuous stream of information coming from a range of devices ranging from sensors and robotics manufacturing machines, to video cameras and mobile gadgets. This ever-increasing amount of data relentlessly flying from devices in real-time is causing data volumes to grow and do so in a hurry. Variety – all types are now being captured (structured, semi-structured, unstructured, streaming data, video, audio, RFID Radio frequency distribution and Sensors )
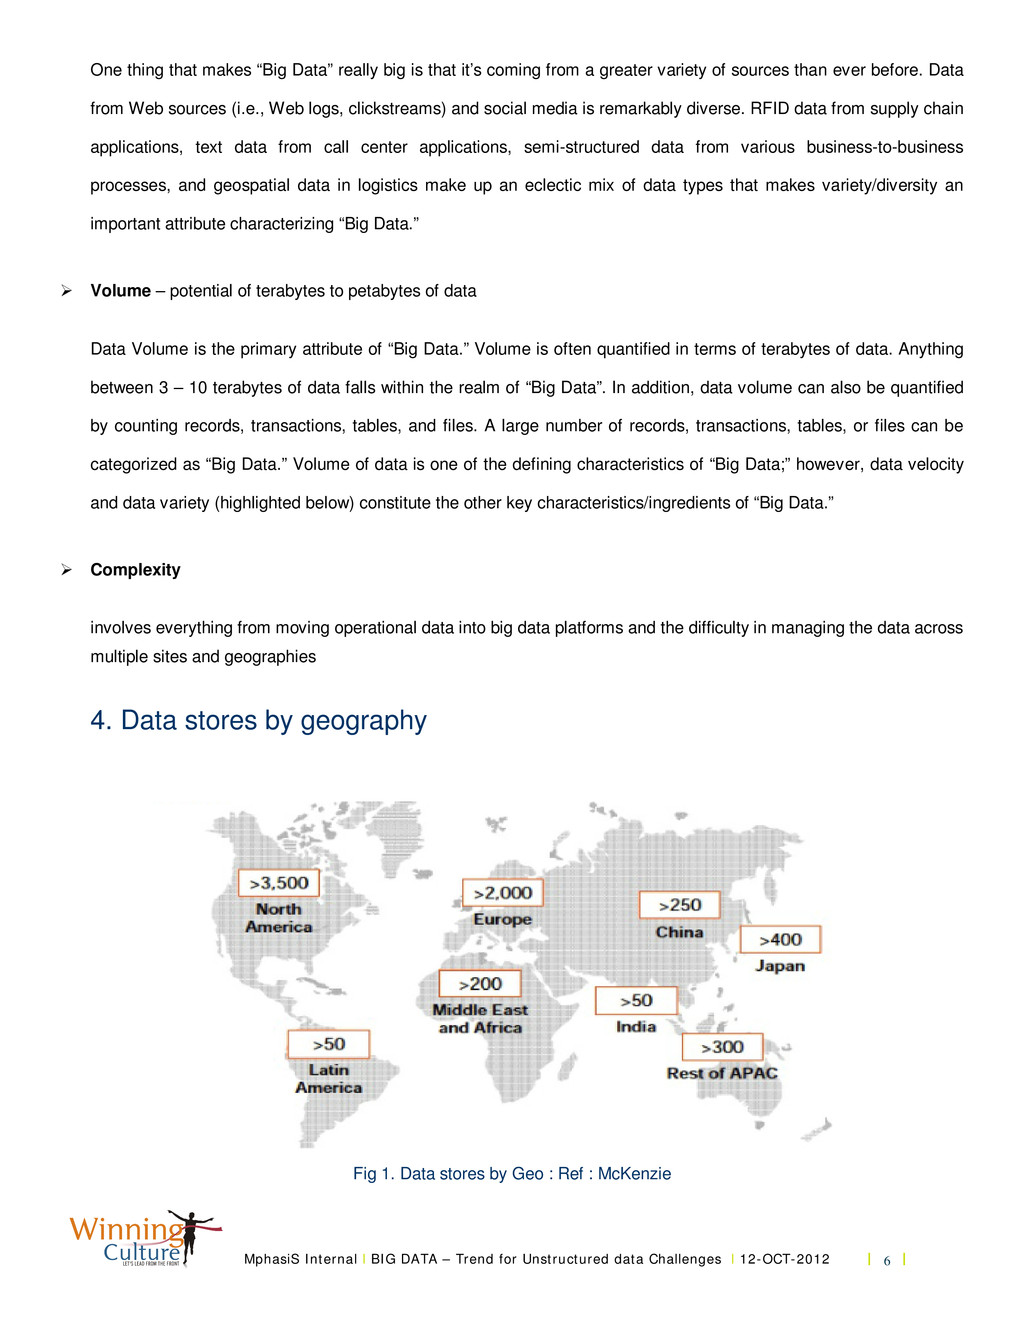
Challenges l 12-OCT-2012 l 6 l One thing that makes “Big Data” really big is that it’s coming from a greater variety of sources than ever before. Data from Web sources (i.e., Web logs, clickstreams) and social media is remarkably diverse. RFID data from supply chain applications, text data from call center applications, semi-structured data from various business-to-business processes, and geospatial data in logistics make up an eclectic mix of data types that makes variety/diversity an important attribute characterizing “Big Data.” Volume – potential of terabytes to petabytes of data Data Volume is the primary attribute of “Big Data.” Volume is often quantified in terms of terabytes of data. Anything between 3 – 10 terabytes of data falls within the realm of “Big Data”. In addition, data volume can also be quantified by counting records, transactions, tables, and files. A large number of records, transactions, tables, or files can be categorized as “Big Data.” Volume of data is one of the defining characteristics of “Big Data;” however, data velocity and data variety (highlighted below) constitute the other key characteristics/ingredients of “Big Data.” Complexity involves everything from moving operational data into big data platforms and the difficulty in managing the data across multiple sites and geographies 4. Data stores by geography Fig 1. Data stores by Geo : Ref : McKenzie
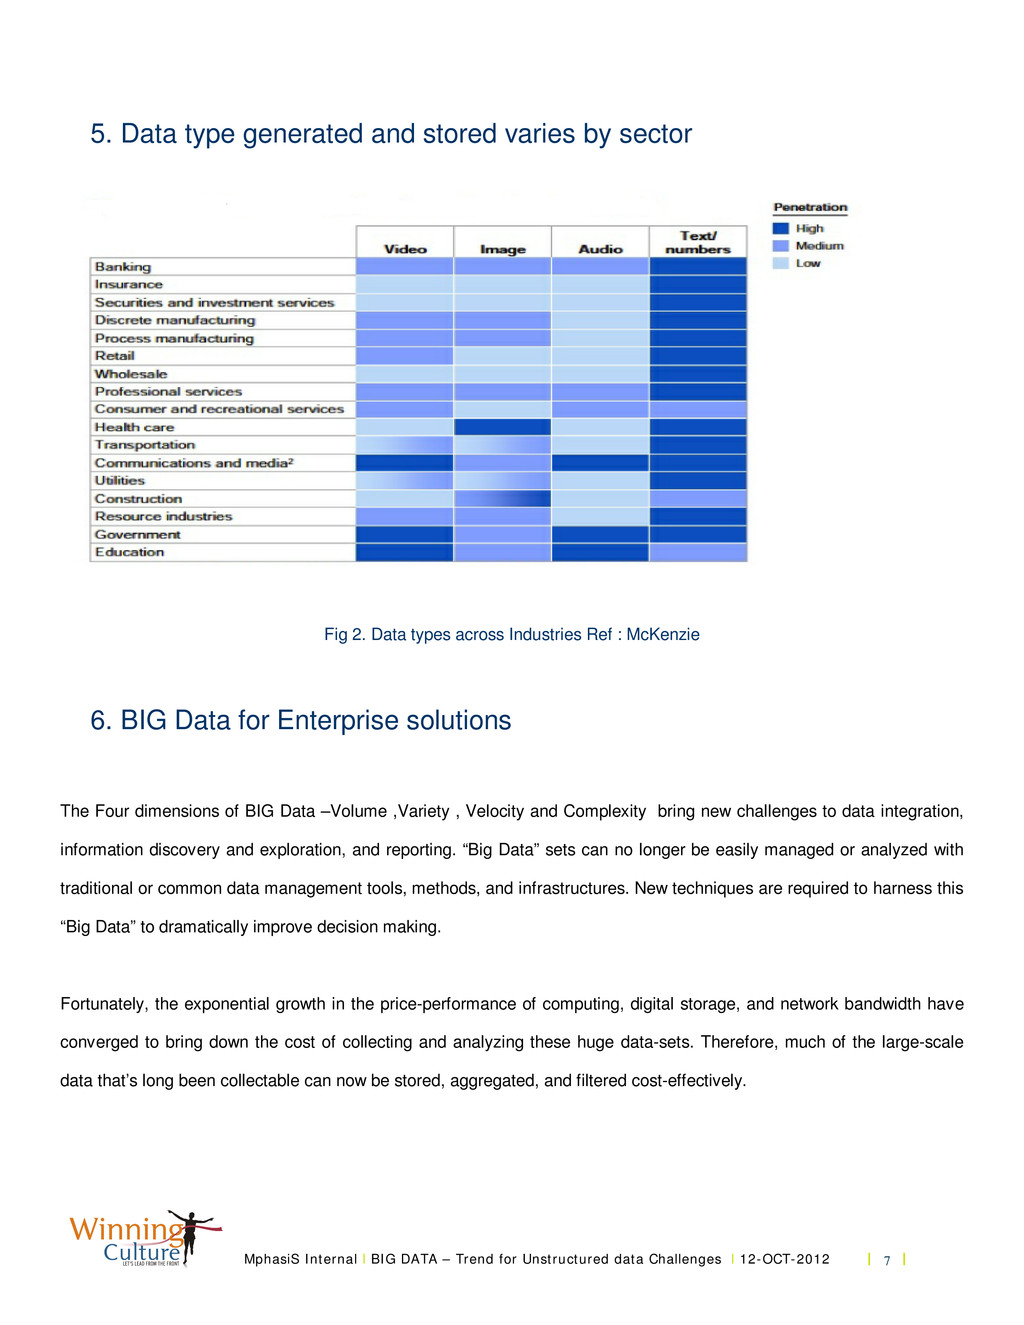
Challenges l 12-OCT-2012 l 7 l 5. Data type generated and stored varies by sector Fig 2. Data types across Industries Ref : McKenzie 6. BIG Data for Enterprise solutions The Four dimensions of BIG Data –Volume ,Variety , Velocity and Complexity bring new challenges to data integration, information discovery and exploration, and reporting. “Big Data” sets can no longer be easily managed or analyzed with traditional or common data management tools, methods, and infrastructures. New techniques are required to harness this “Big Data” to dramatically improve decision making. Fortunately, the exponential growth in the price-performance of computing, digital storage, and network bandwidth have converged to bring down the cost of collecting and analyzing these huge data-sets. Therefore, much of the large-scale data that’s long been collectable can now be stored, aggregated, and filtered cost-effectively.
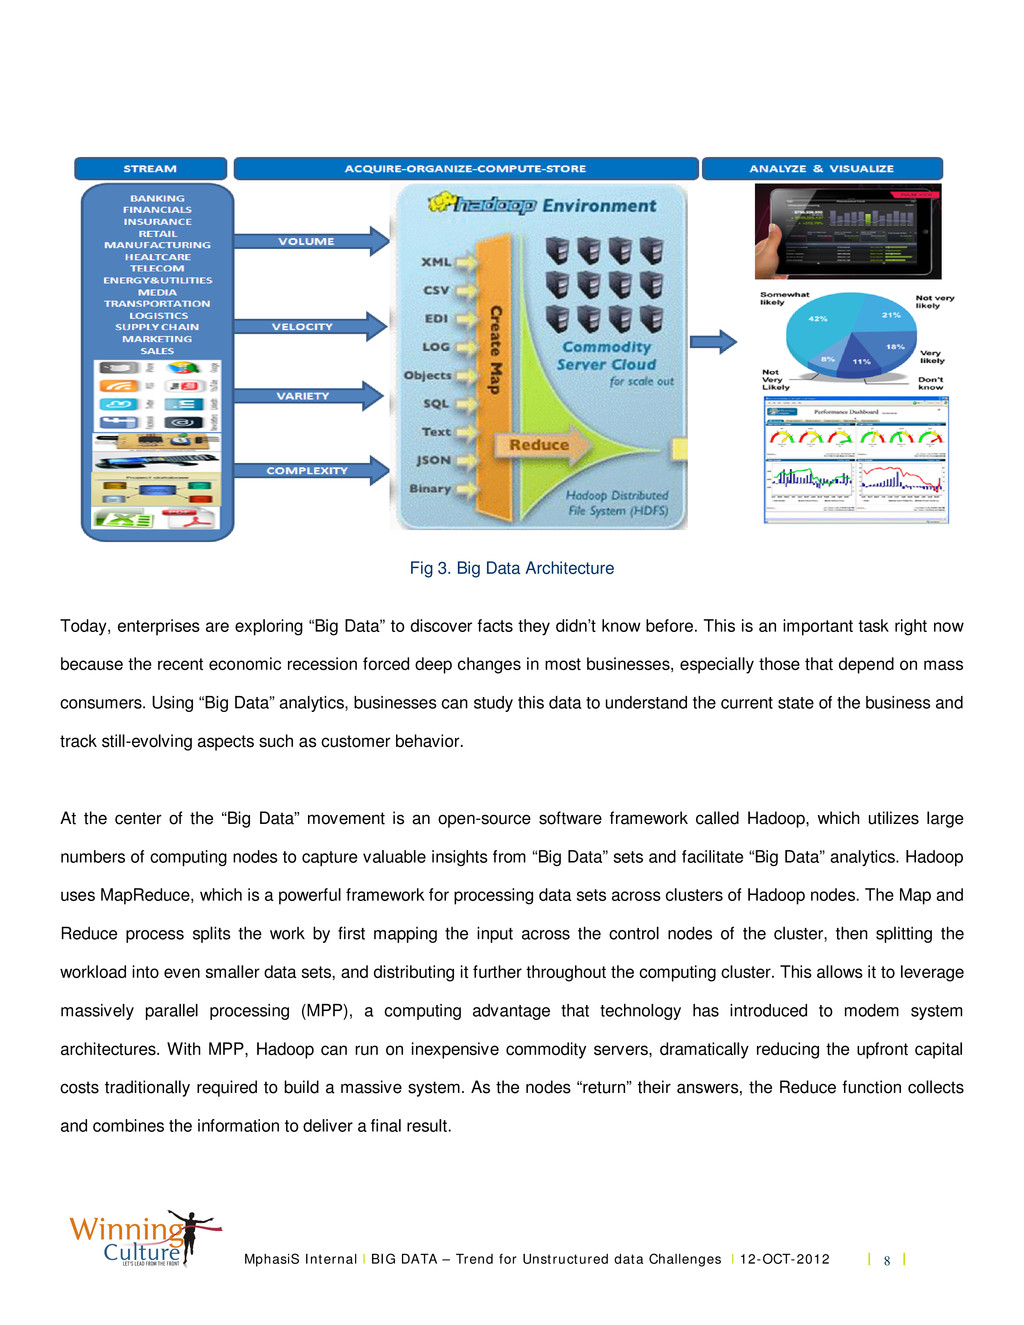
Challenges l 12-OCT-2012 l 8 l Fig 3. Big Data Architecture Today, enterprises are exploring “Big Data” to discover facts they didn’t know before. This is an important task right now because the recent economic recession forced deep changes in most businesses, especially those that depend on mass consumers. Using “Big Data” analytics, businesses can study this data to understand the current state of the business and track still-evolving aspects such as customer behavior. At the center of the “Big Data” movement is an open-source software framework called Hadoop, which utilizes large numbers of computing nodes to capture valuable insights from “Big Data” sets and facilitate “Big Data” analytics. Hadoop uses MapReduce, which is a powerful framework for processing data sets across clusters of Hadoop nodes. The Map and Reduce process splits the work by first mapping the input across the control nodes of the cluster, then splitting the workload into even smaller data sets, and distributing it further throughout the computing cluster. This allows it to leverage massively parallel processing (MPP), a computing advantage that technology has introduced to modem system architectures. With MPP, Hadoop can run on inexpensive commodity servers, dramatically reducing the upfront capital costs traditionally required to build a massive system. As the nodes “return” their answers, the Reduce function collects and combines the information to deliver a final result.
Challenges l 12-OCT-2012 l 9 l 7. Key Ingredients of “Big Data” Analytics The cornerstones to enabling “Big Data” Analytics is the ability to access and integrate information of any scale, from any source—combining transaction/structured data with unstructured data gleaned from social media sites/web properties/sensor information to enable insights not possible before, and utilizing frameworks constructed for data- intensive processing running on a cluster of commodity hardware, and ultimately feeding the processed results to a Business Intelligence (BI) environment that allows the ability to search, discover and visualize information through different perspectives so that an exhaustive analysis of the information is possible. Essentially, “Big Data” Analytics is based on 4 key pillars: Acquire and integrate data (regardless of scale) from any source. Harness interaction data (i.e., social network data, device/sensor based RFID. information) to enhance/enrich transaction data to enable unprecedented insights. Utilize Massive Parallel Processing frameworks on commodity hardware to process “Big Data” sets encompassing transaction data, sensor/machine data and social network data. Collect and deliver the processed results to a BI environment for exploration purposes to derive precious, golden insights. 8. Big Data Best Practices Align big data with specific business goals: Continued pressing need for business-IT alignment, and the leadership role such alignment affords for IT executives. It's important that this alignment applies to big data as well, to “base new investments in skills, organization, or infrastructure with a strong business-driven context to guarantee ongoing project investments and funding.” Ease skills shortage with standards and governance: Since big data has so much potential, there's a growing shortage of professionals who can manage and mine information. Short of offering huge signing bonuses, the best way to overcome potential skills issues is standardizing big data efforts within an IT governance program. Optimize knowledge transfer with a center of excellence: “Whether big data is a new or expanding investment, the soft and hard costs can be an investment shared across the enterprise.”
Challenges l 12-OCT-2012 l 10 l Top payoff is aligning unstructured with structured data: “By connecting high density big data to the structured data you are already collecting can bring even greater clarity.” Plan your sandbox for performance: Sometimes, it may be difficult to even know what you are looking for. “Management and IT needs to support this 'lack of direction' or 'lack of clear requirement.' Align with the cloud operating model: “Analytical sandboxes should be created on-demand and resource management needs to have a control of the entire data flow, from pre-processing, integration, in-database summarization, post- processing, and analytical modeling. A well planned private and public cloud provisioning and security strategy plays an integral role in supporting these changing requirements 9. Big Data Landscape for Insurance projects Big data is a big topic of discussion and debate in the insurance industry, as insurance companies try to figure out ways to cost-effectively tap into the huge volumes of internal and external information available to them, and the vendor community scrambles to develop systems, tools and platforms to support these efforts. But while these sophisticated analytics and data management solutions are critical to a productive approach to big data, technology is just one aspect of a successful strategy. Case study 1: Calculating a competitive and profitable insurance premium Business Objective : In an effort to be more competitive, an insurance company wants to offer their customers the lowest possible premium, but only to those who are unlikely to make a claim, thereby optimizing their profits. One way to approach this problem is to collect more detailed data about an individual's driving habits and then assess their risk. Business Benefit In fact, insurance companies are now starting to collect data on driving habits utilizing sensors in their customers' cars. These sensors capture driving data, such as routes driven, miles driven, time of day, and braking abruptness. This data is used to assess driver risk; they compare individual driving patterns with other statistical information, such as average
Challenges l 12-OCT-2012 l 11 l miles driven in your state, and peak hours of drivers on the road. Driver risk plus actuarial information is then correlated with policy and profile information to offer a competitive and more profitable rate for the company. The result : A personalized insurance plan. These unique capabilities, delivered from big data analytics, are revolutionizing the insurance industry How to achieve To accomplish this task, a great amount of continuous data must be collected, stored, and correlated. Hadoop is an excellent choice for acquisition and reduction of the automobile sensor data. Master data and certain reference data including customer profile information are likely to be stored in the existing DBMS systems, and a NoSQL database can be used to capture and store reference data that are more dynamic, diverse in formats, and change frequently. Loading the MapReduce results into an existing BI environment allows for further data exploration and data correlation. With these new tools, the company is now able to addresses the storage, retrieval, modeling, and processing side of the requirements. In this case, the traditional business process and supporting data (master, transaction, analytic data) are able to add statistically relevant information to their profit model and deliver an industry innovative result. CASE STUDY 2 : Business Objective : Detecting Collusion in Big Data for Health Care and Insurance The health care and insurance industry suffers from collusion at all levels – providers, attorneys, claimants, runners, etc. – specifically to run up claim costs. Traditional fraud detection methods such as “Link Analysis” are labor intensive and are reactive instead of predictive and proactive. To better detect fraud rings and collusion, two and three degree “external” relationships need to be revealed. This case study will demonstrate how to find non-obvious relationships for fraud and business opportunities.
Challenges l 12-OCT-2012 l 12 l CASE STUDY 3 Business Objective : Competitive pressures, an uncertain investment environment, and customer demands are forcing insurers to change the way they do business in order to realize profitable revenue. Underwriters have less time and need more information to properly assess risk and tailor quotes to increasingly demanding customers. Claims departments, must improve customer service and expedite claims investigations while reducing costs and processing overhead. And finally, to reach growth targets and a balanced book of business, insurers must target the right customers with customized offerings through optimal sales channels. In the face of volatile economic conditions, new business models and changing customer behavior, insurers are looking for ways of incorporating Big Data to improve the speed and accuracy of their business decisions. CASE STUDY 4 Business Objective: Mine Big Data to manage risk, drive revenue and increase profitability Based on the Outside Intelligence Risk Discovery Platform, Big data technology stack quickly discovers and analyses data from corporate databases along with information from internet sources such as regular web pages, social and news feeds, subscriptions and government databases. Big data technology stack rapidly fuses all relevant information into a consolidated, accurate and current profile that is easy to read and understand. For the insurer, this means increased efficiency, profitable pricing, better understanding of exposure, and immediate identification of business opportunities.
Challenges l 12-OCT-2012 l 13 l 10. Conclusion Big Data is here. Analysts and research organizations have made it clear that mining machine generated data is essential to future success. Embracing new technologies and techniques are always challenging, but as technical experts ,we are expected to provide a fast, reliable path to business adoption. Hadoop and the data warehouse will often work together in a single information supply chain. When it comes to Big Data, Hadoop excels in handling raw, unstructured and complex data with vast programming flexibility. Data warehouses also manage big structured data, integrating subject areas and providing interactive performance through BI tools. It is rapidly becoming a symbiotic relationship. Some differences are clear, and identifying workloads or data that runs best on one or the other will be dependent on your organization and use cases. Last but not least, expand your IT governance to include a Big Data center of excellence to ensure business alignment, grow your skills, manage Open Source tools and technologies, share knowledge, establish standards, and to manage best practices. 11. Reference McKenzie Other Big Data sources Insurance and technology sources