Upgrade to Pro — share decks privately, control downloads, hide ads and more …

Interacting Software Debugging with Symbolic Ex...

Interacting Software Debugging with Symbolic Execution

My master thesis oral presentation slide
Code is available here: https://github.com/SQLab/symgdb

bananaappletw

August 08, 2017
Tweet

More Decks by bananaappletw

Other Decks in Programming

Transcript

  1. Outline • Motivation • Objective • Background • Design and

    Implementation • Evaluation • Conclusion • Future work
  2. Motivation • Related work of Qira and Ponce • Qira-like

    debugging (without symbolic execution) • Ponce-like Interactive Symbolic Execution (without scripting)
  3. Qira: QEMU Interactive Runtime Analyser • A timeless debugger •

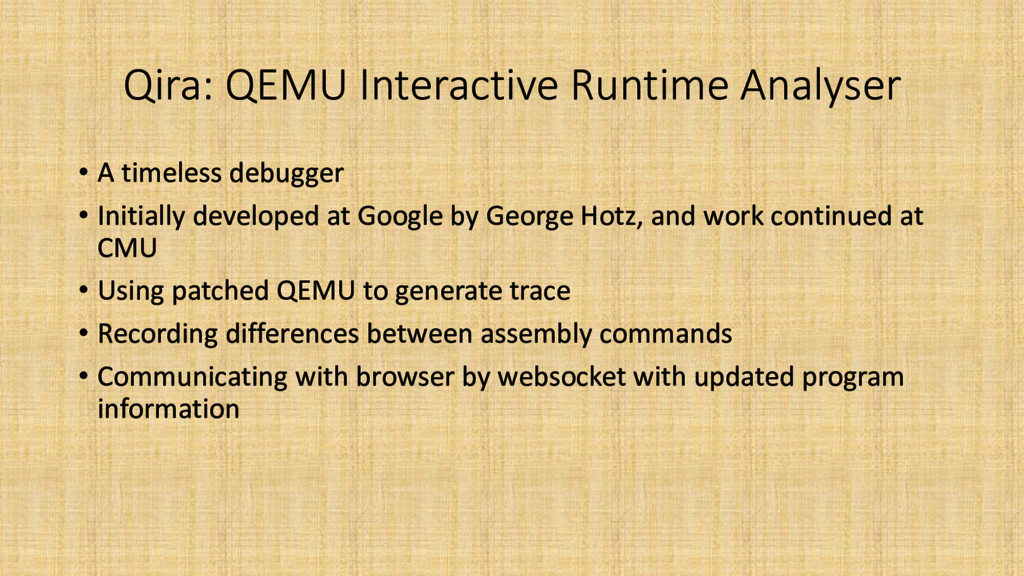
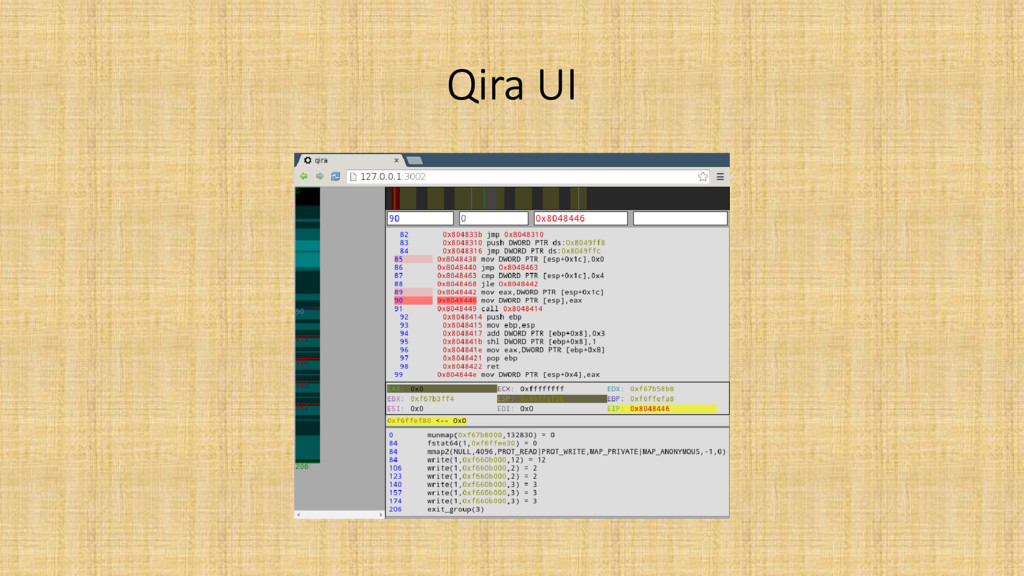
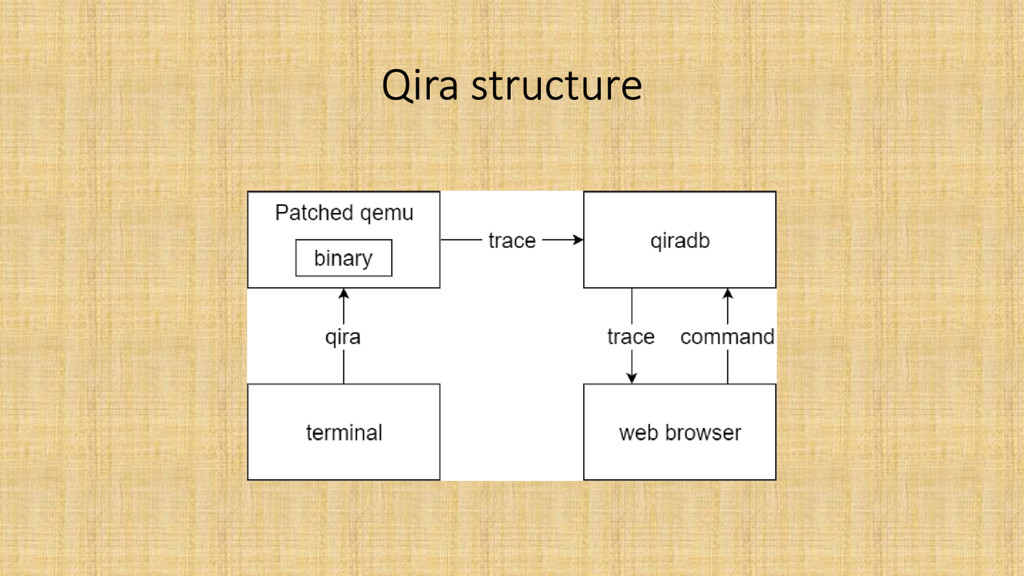
    Initially developed at Google by George Hotz, and work continued at CMU • Using patched QEMU to generate trace • Recording differences between assembly commands • Communicating with browser by websocket with updated program information
  4. Qira without symbolic execution • Plan to support symbolic execution:

    • https://github.com/BinaryAnalysisPlatform/qira/blob/master/tracers/angr/an gr_trace.py • Symbolic execution is not implemented • Deprecated github project • Qira is using basic tracing functionality of QEMU • QEMU argument: -d -in_asm • http://www.droid-developers.org/wiki/QEMU
  5. Ponce • Ponce is an IDA Pro plugin that provides

    users the ability to perform taint analysis and symbolic execution over binaries • Github: https://github.com/illera88/Ponce • Implemented by triton
  6. Need something similar to Ponce for scripting • Provide symbolic

    execution functionality in debugger • Integrated with exploit generation of script • Choosing GDB as debugger to implement symbolic execution functionality
  7. Outline • Motivation • Objective • Background • Design and

    Implementation • Evaluation • Conclusion • Future work
  8. Interactive debugger with symbolic execution • Continued with qira with

    symbolic execution idea • Some experiments based on qemu • Using -d asm parameter to generate trace • Yielding trace for triton engine
  9. QEMU • QEMU is a generic and open source machine

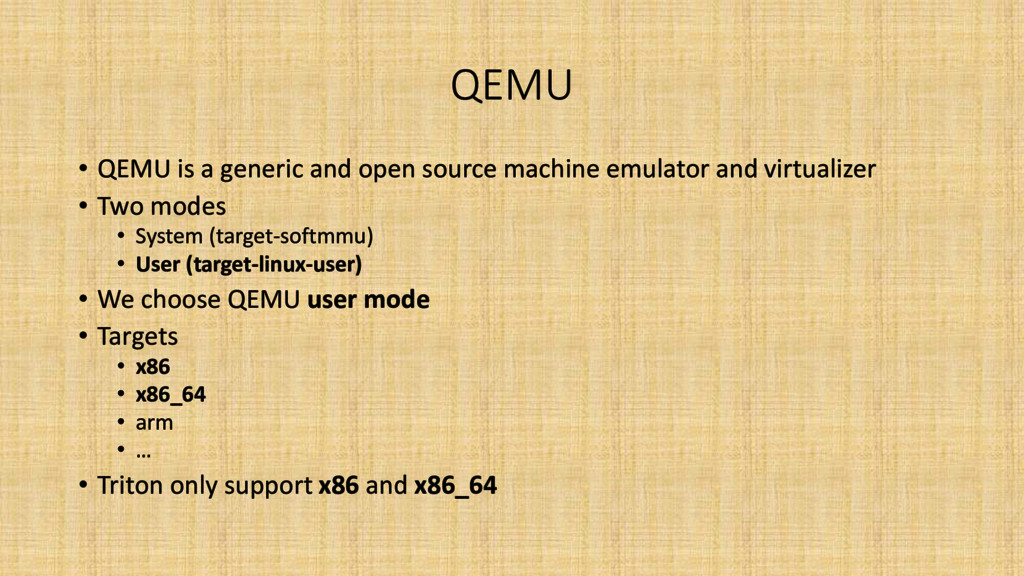
    emulator and virtualizer • Two modes • System (target-softmmu) • User (target-linux-user) • We choose QEMU user mode • Targets • x86 • x86_64 • arm • … • Triton only support x86 and x86_64
  10. Difficulties • QEMU as a tracer to generate assembly trace

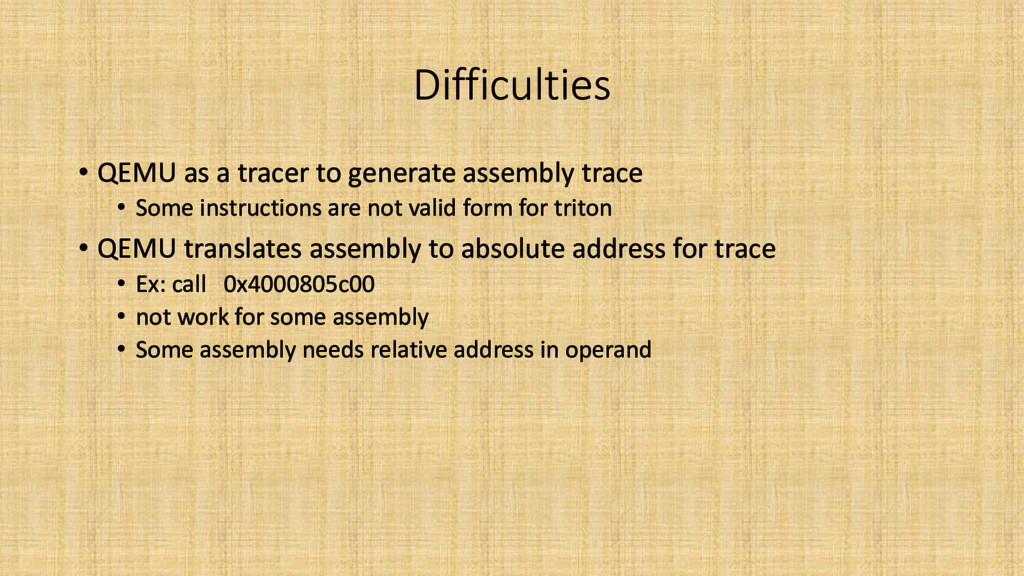
    • Some instructions are not valid form for triton • QEMU translates assembly to absolute address for trace • Ex: call 0x4000805c00 • not work for some assembly • Some assembly needs relative address in operand
  11. Outline • Motivation • Objective • Background • Design and

    Implementation • Evaluation • Conclusion • Future work
  12. Background • Symbolic execution • Triton • Triton Structure •

    Triton Tracer • AST representations • Static single assignment form • Symbolic execution engine • SMT solver Interface
  13. Symbolic execution • Symbolic execution is a means of analyzing

    a program to determine what inputs cause each part of a program to execute • System-level • S2e • User-level • Angr • Triton • Code-based • klee
  14. Triton • A dynamic binary analysis framework written in C++.

    • developed by Jonathan Salwan • Triton components • Tracer • AST representations • Symbolic execution engine • SMT solver Interface
  15. Triton Tracer • Tracer provides: • Current opcode executed •

    State context (register and memory) • Translate the control flow into AST Representations • Pin tracer support
  16. AST representations • Triton converts the x86 and the x86-64

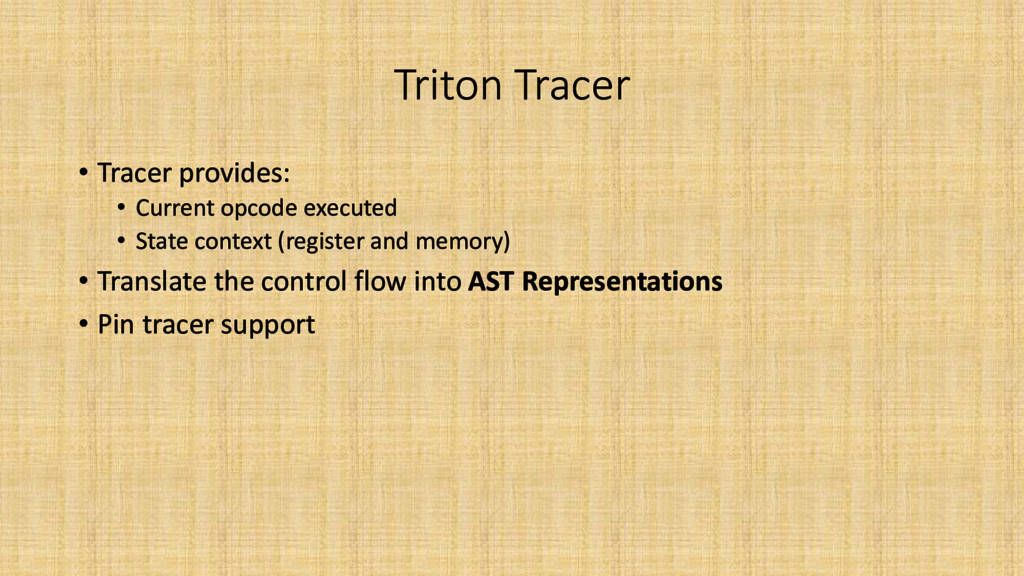
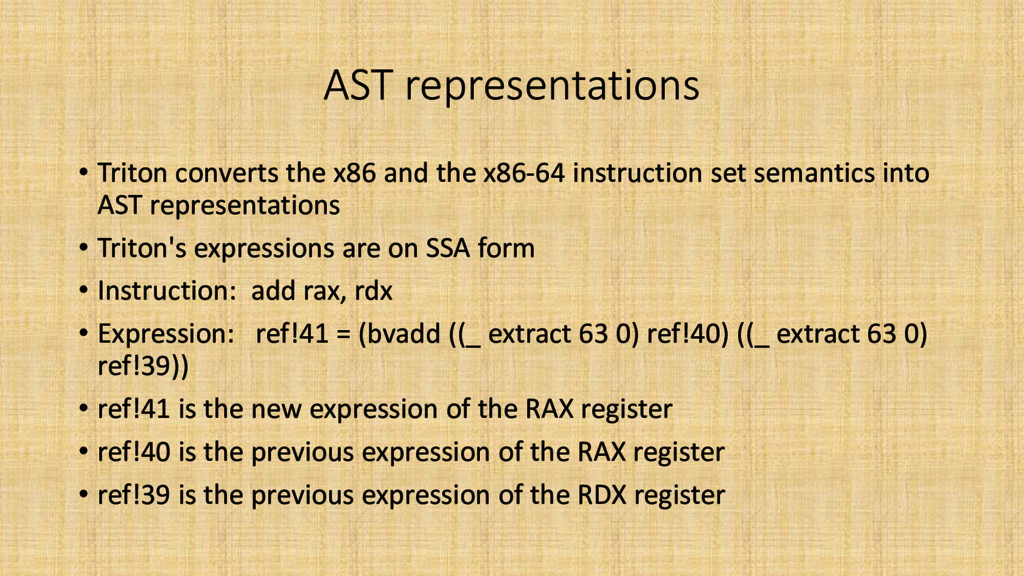
    instruction set semantics into AST representations • Triton's expressions are on SSA form • Instruction: add rax, rdx • Expression: ref!41 = (bvadd ((_ extract 63 0) ref!40) ((_ extract 63 0) ref!39)) • ref!41 is the new expression of the RAX register • ref!40 is the previous expression of the RAX register • ref!39 is the previous expression of the RDX register
  17. AST representations • mov al, 1 • mov cl, 10

    • mov dl, 20 • xor cl, dl • add al, cl
  18. Static single assignment form • Each variable is assigned exactly

    once • y := 1 • y := 2 • x := y Turns into • y1 := 1 • y2 := 2 • x1 := y2
  19. Symbolic execution engine • The symbolic engine maintains: • a

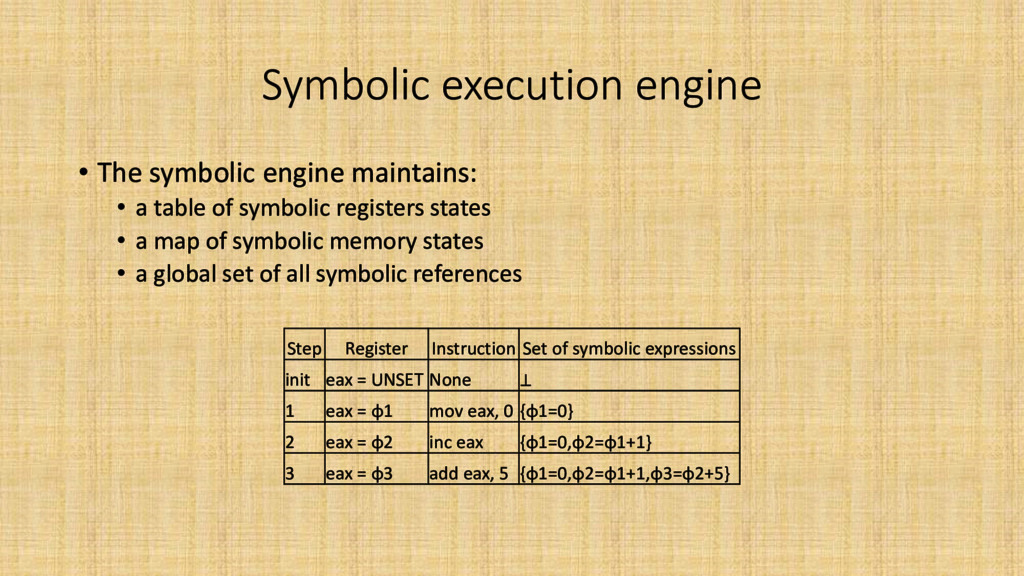
    table of symbolic registers states • a map of symbolic memory states • a global set of all symbolic references Step Register Instruction Set of symbolic expressions init eax = UNSET None ⊥ 1 eax = φ1 mov eax, 0 {φ1=0} 2 eax = φ2 inc eax {φ1=0,φ2=φ1+1} 3 eax = φ3 add eax, 5 {φ1=0,φ2=φ1+1,φ3=φ2+5}
  20. Outline • Motivation • Objective • Background • Design and

    Implementation • Evaluation • Conclusion • Future work
  21. Design and Implementation • Symbolic Support for GDB (SymGDB) •

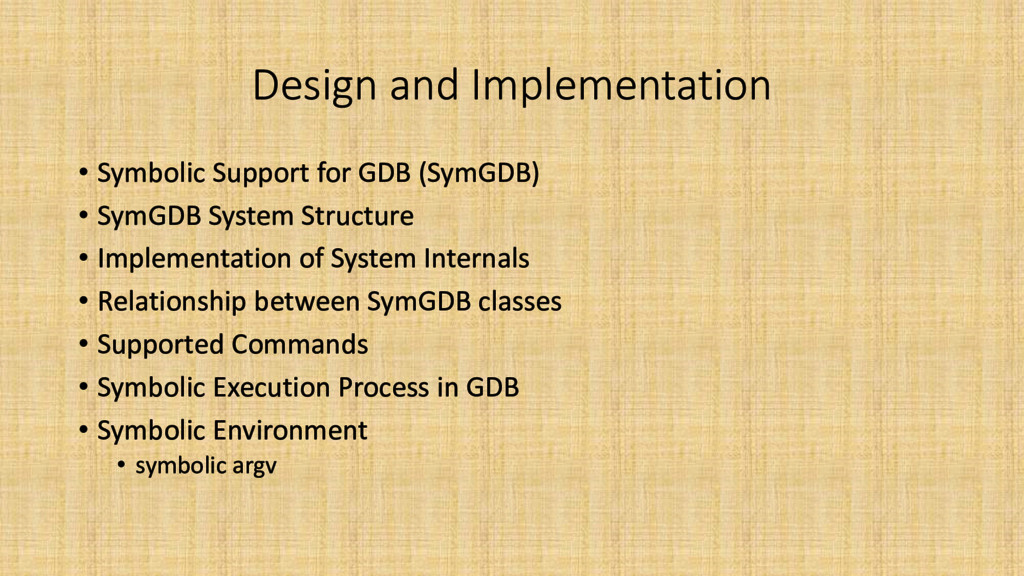
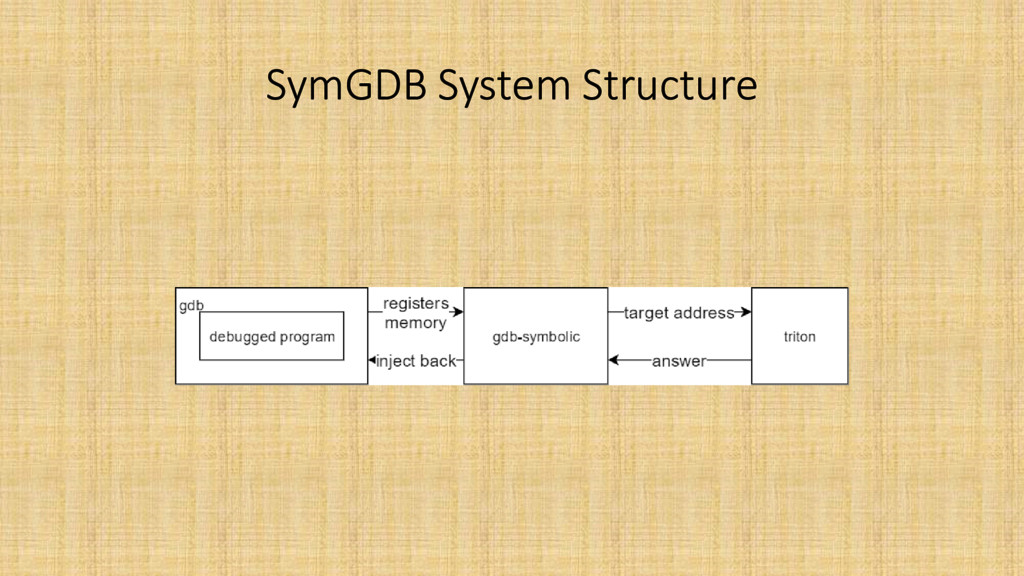
    SymGDB System Structure • Implementation of System Internals • Relationship between SymGDB classes • Supported Commands • Symbolic Execution Process in GDB • Symbolic Environment • symbolic argv
  22. Symbolic Support for GDB (SymGDB) • Using python API for

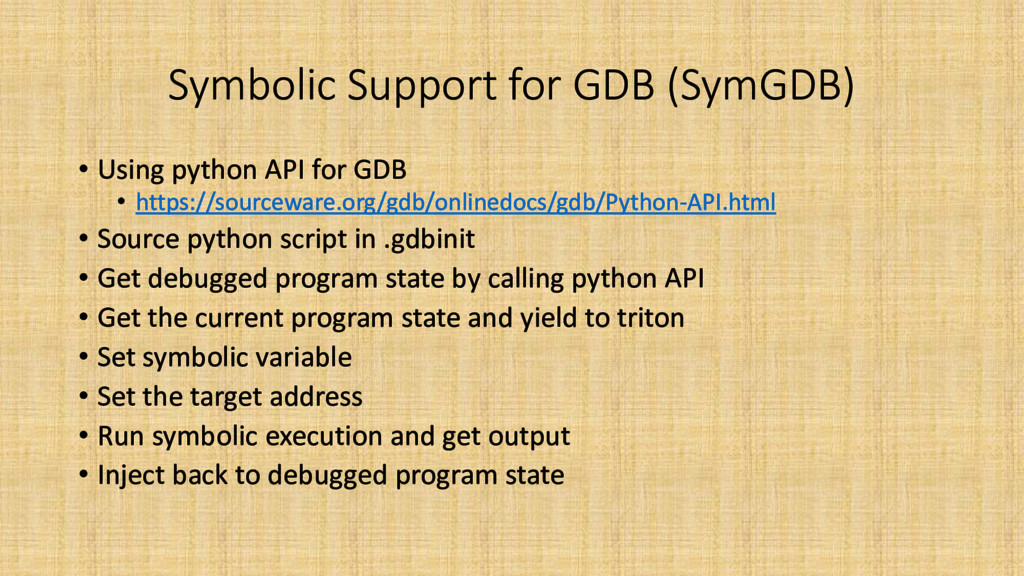
    GDB • https://sourceware.org/gdb/onlinedocs/gdb/Python-API.html • Source python script in .gdbinit • Get debugged program state by calling python API • Get the current program state and yield to triton • Set symbolic variable • Set the target address • Run symbolic execution and get output • Inject back to debugged program state
  23. Implementation of System Internals • Three classes in the symGDB

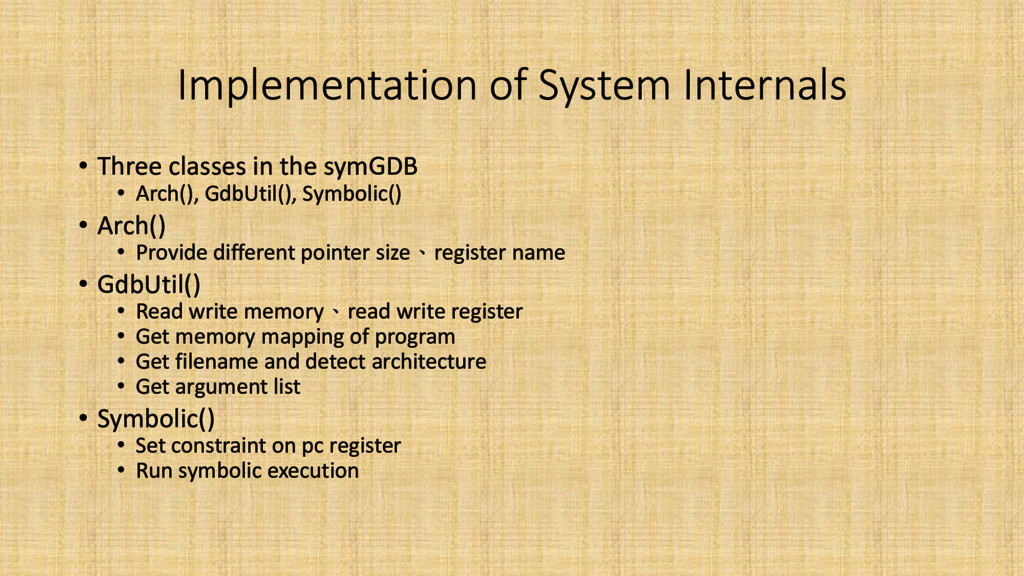
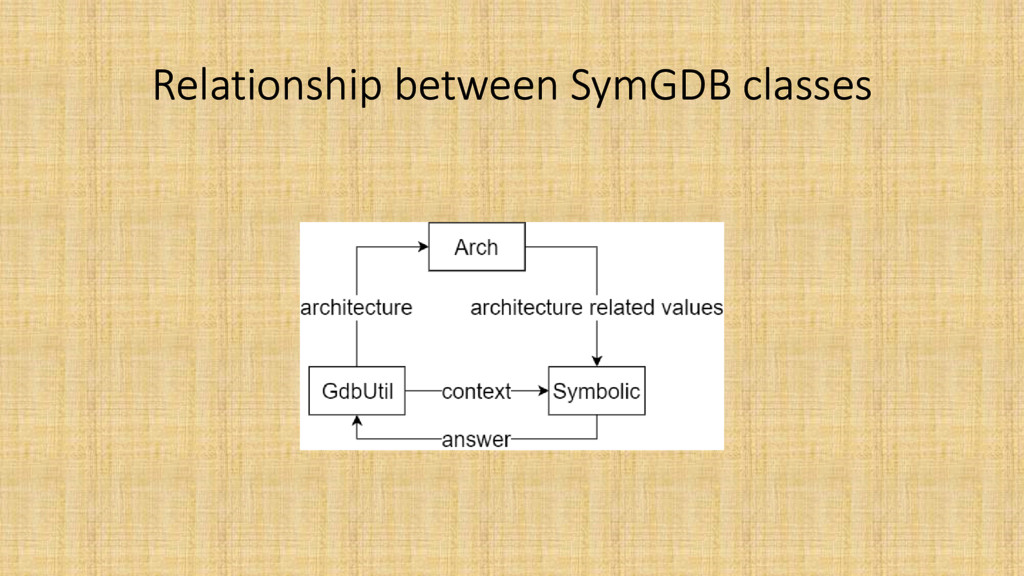
    • Arch(), GdbUtil(), Symbolic() • Arch() • Provide different pointer size、register name • GdbUtil() • Read write memory、read write register • Get memory mapping of program • Get filename and detect architecture • Get argument list • Symbolic() • Set constraint on pc register • Run symbolic execution
  24. Supported Commands • Inherit from gdb.Command class • Make symbolic

    command • symbolize • argv • memory [address] [size] • Set target address • target [address] • Run symbolic execution • triton
  25. Symbolic Execution Process in GDB • gdb.execute("info registers", to_string=True) to

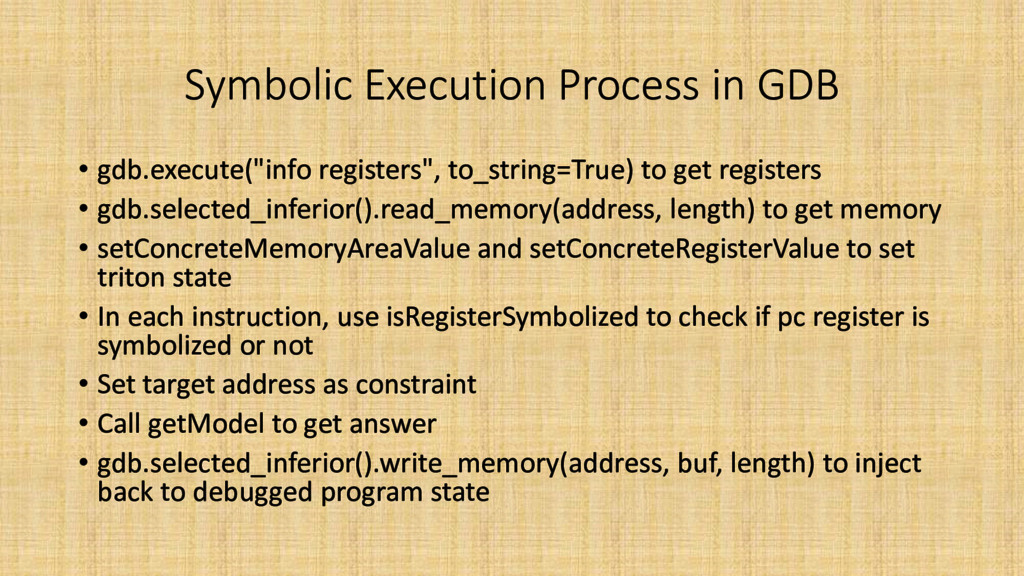
    get registers • gdb.selected_inferior().read_memory(address, length) to get memory • setConcreteMemoryAreaValue and setConcreteRegisterValue to set triton state • In each instruction, use isRegisterSymbolized to check if pc register is symbolized or not • Set target address as constraint • Call getModel to get answer • gdb.selected_inferior().write_memory(address, buf, length) to inject back to debugged program state
  26. Symbolic Environment: symbolic argv • Using "info proc all" to

    get stack start address • Examining memory content from stack start address • argc • argv[0] • argv[1] • …… • null • env[0] • env[1] • …… • null argc argument counter(integer) argv[0] program name (pointer) argv[1] program args (pointers) … argv[argc-1] null end of args (integer) env[0] environment variables (pointers) env[1] … env[n] null end of environment (integer)
  27. Outline • Motivation • Objective • Background • Design and

    Implementation • Evaluation • Conclusion • Future work
  28. Evaluations • Examples • crackme hash • crackme xor •

    GDB commands • Combined with Peda • Comparisons with triton • Comparisons with Ponce
  29. crackme hash • Source: https://github.com/illera88/Ponce/blob/master/examples/crackme_h ash.cpp • Program will pass

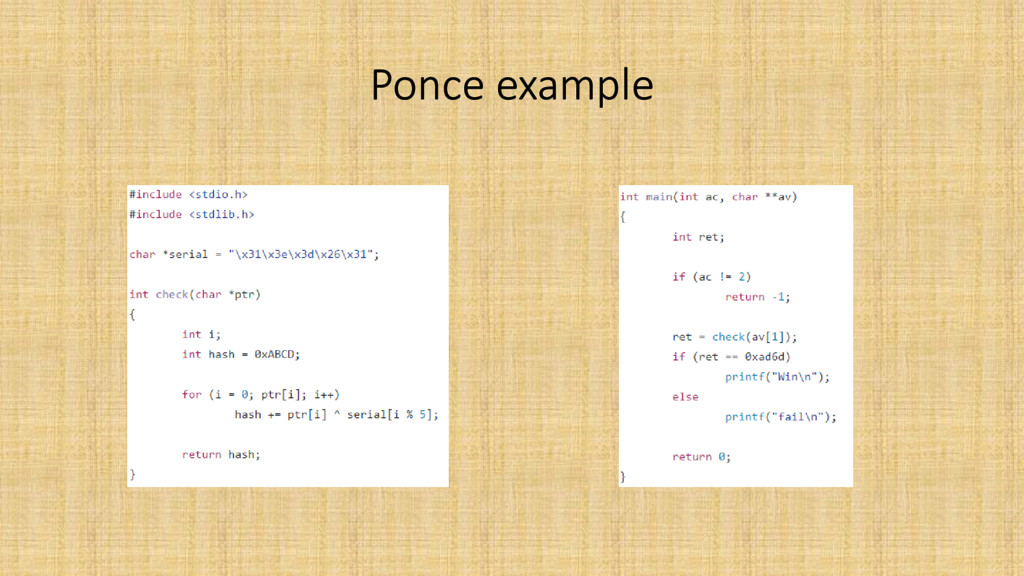
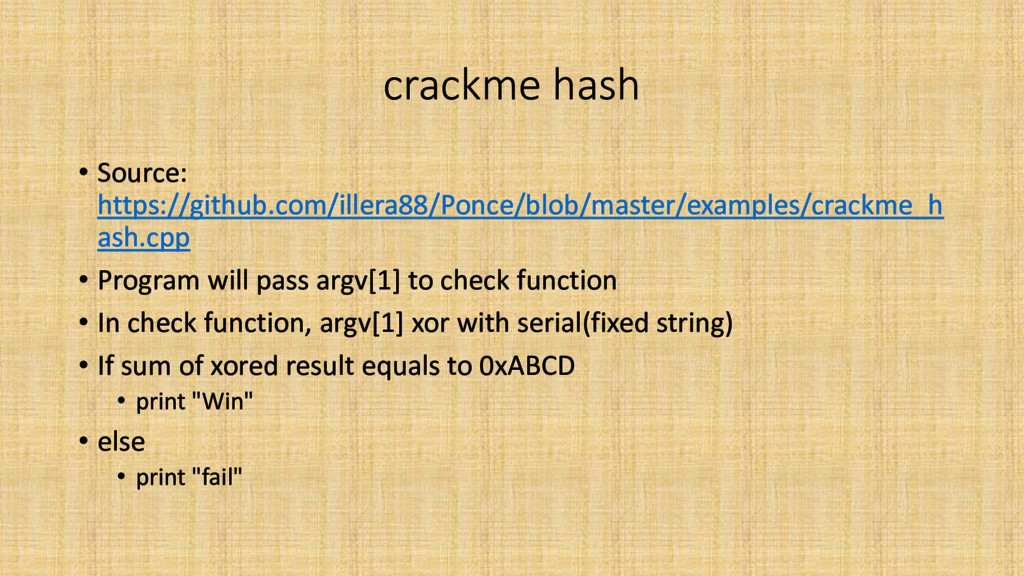
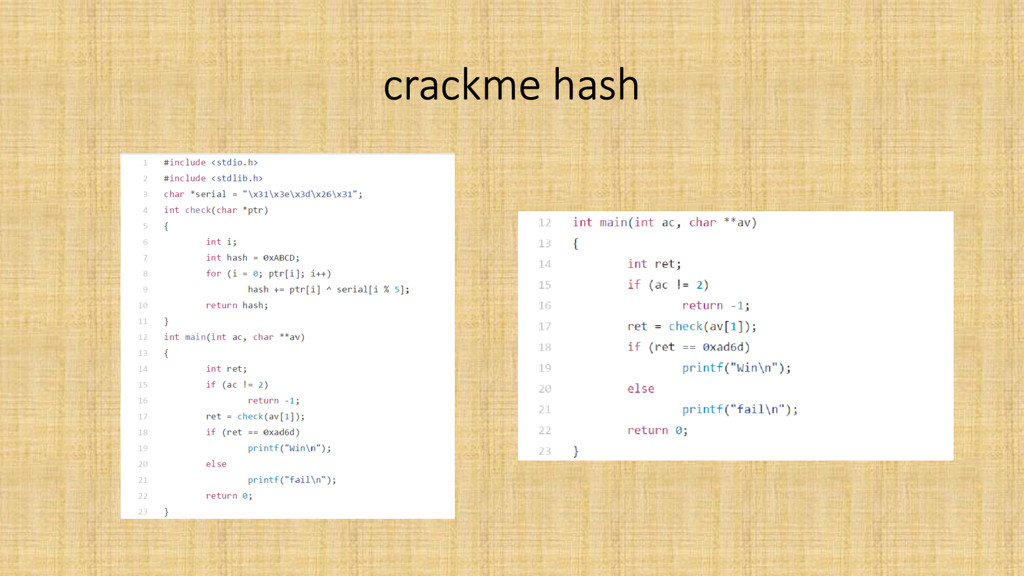
    argv[1] to check function • In check function, argv[1] xor with serial(fixed string) • If sum of xored result equals to 0xABCD • print "Win" • else • print "fail"
  30. crackme xor • Source: https://github.com/illera88/Ponce/blob/master/examples/crackme_xor.cpp • Program will pass argv[1]

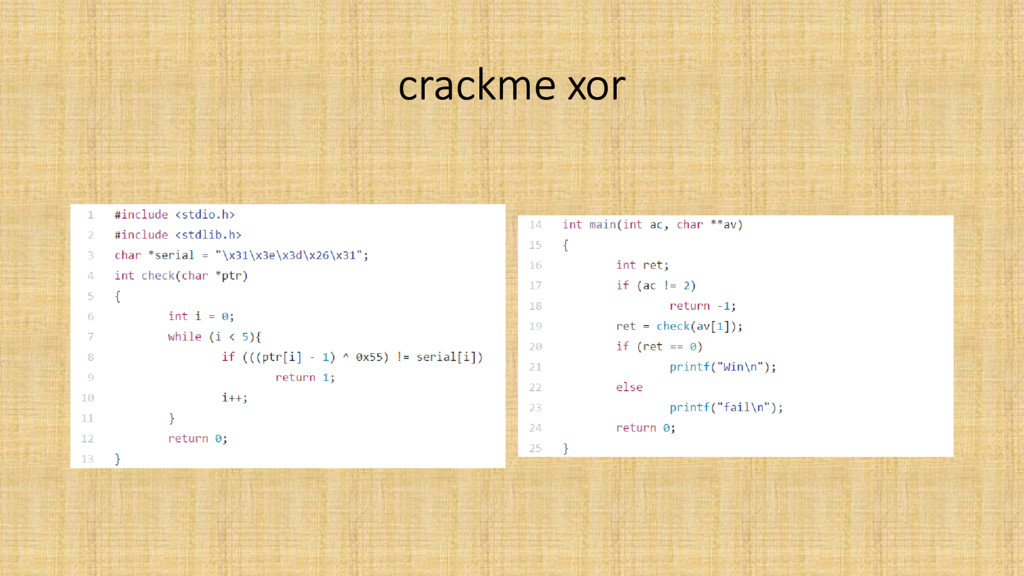
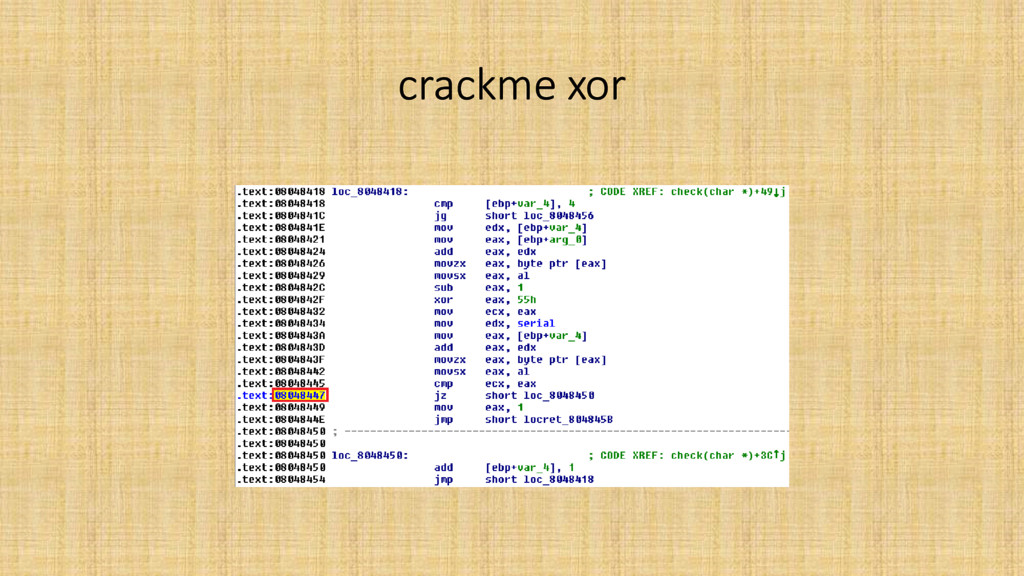
    to check function • In check function, argv[1] xor with 0x55 • If xored result not equals to serial(fixed string) • return 1 • print "fail" • else • go to next loop • If program go through all the loop • return 0 • print "Win"
  31. Combined with Peda • Same demo video of crackme hash

    • Using find(peda command) to find argv[1] address • Using symbolize memory argv[1]_address argv[1]_length to symbolic argv[1] memory
  32. Comparisons with triton • triton’s pre-written script with more than

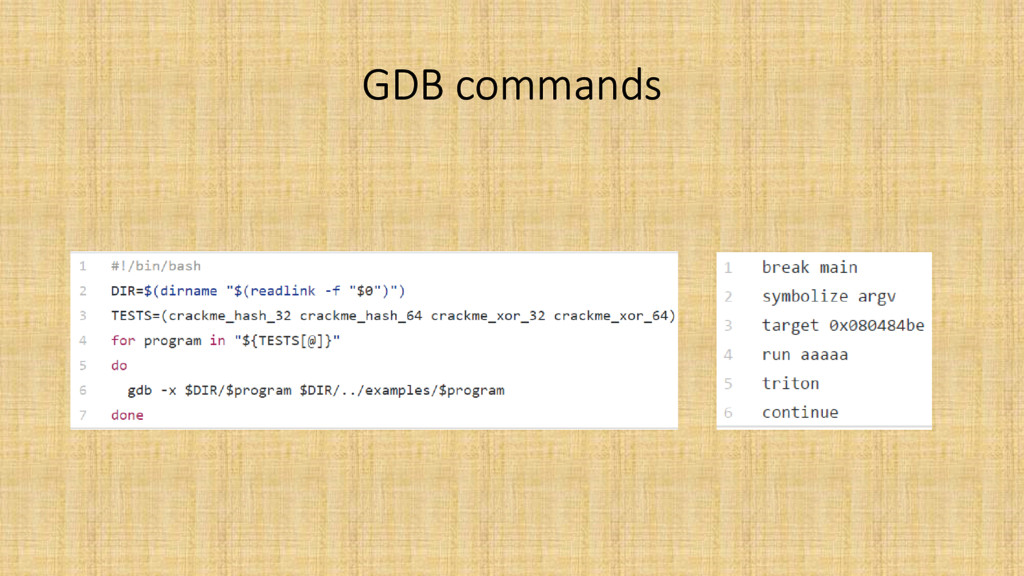
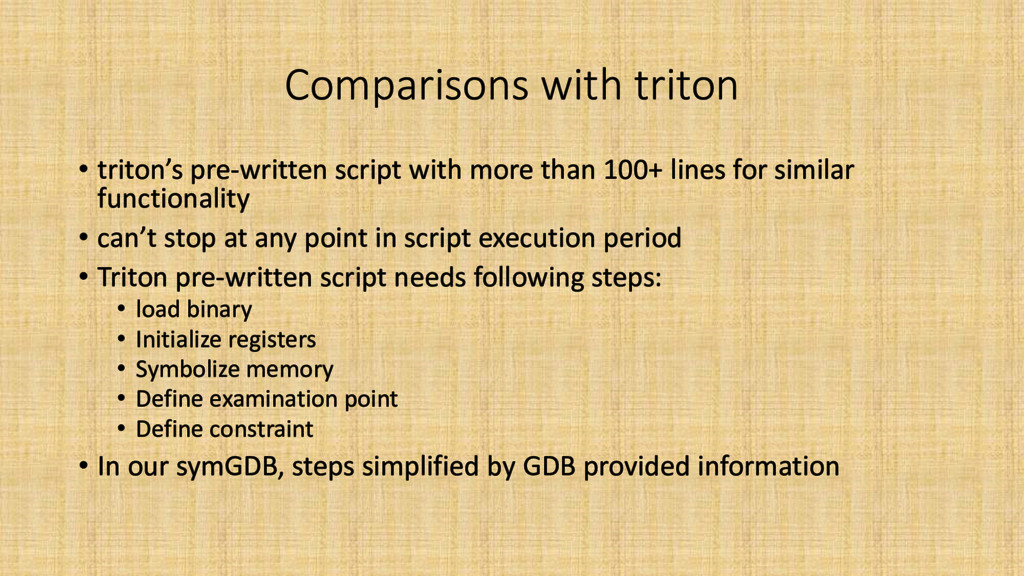
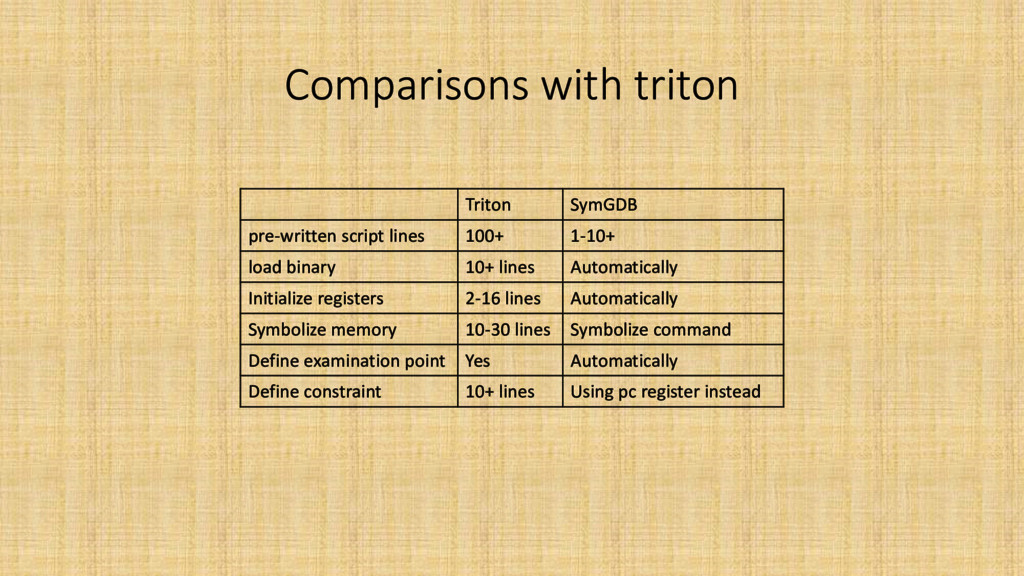
    100+ lines for similar functionality • can’t stop at any point in script execution period • Triton pre-written script needs following steps: • load binary • Initialize registers • Symbolize memory • Define examination point • Define constraint • In our symGDB, steps simplified by GDB provided information
  33. Comparisons with triton Triton SymGDB pre-written script lines 100+ 1-10+

    load binary 10+ lines Automatically Initialize registers 2-16 lines Automatically Symbolize memory 10-30 lines Symbolize command Define examination point Yes Automatically Define constraint 10+ lines Using pc register instead
  34. Comparisons with Ponce • Compared with Ponce, symGDB can restart

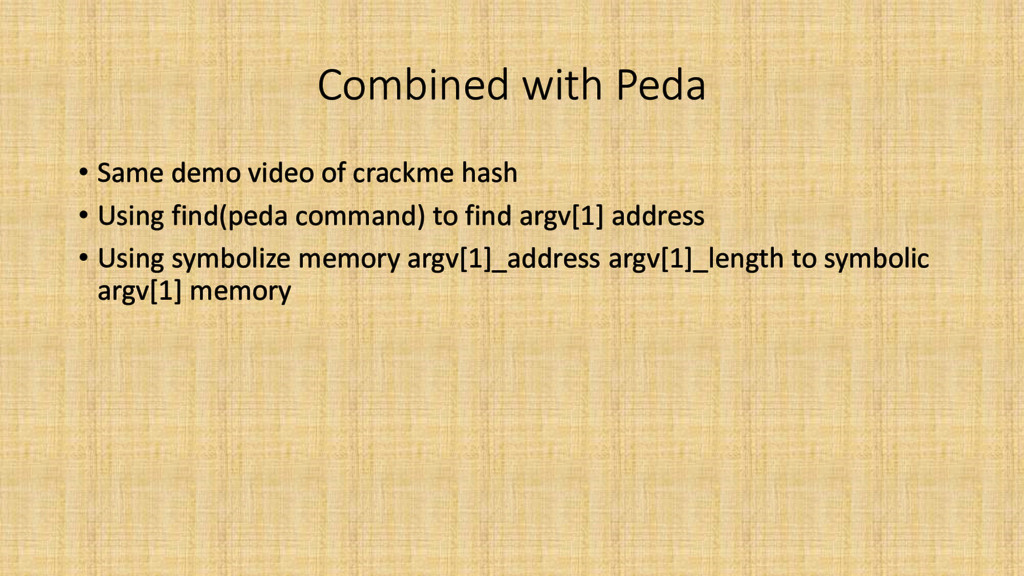
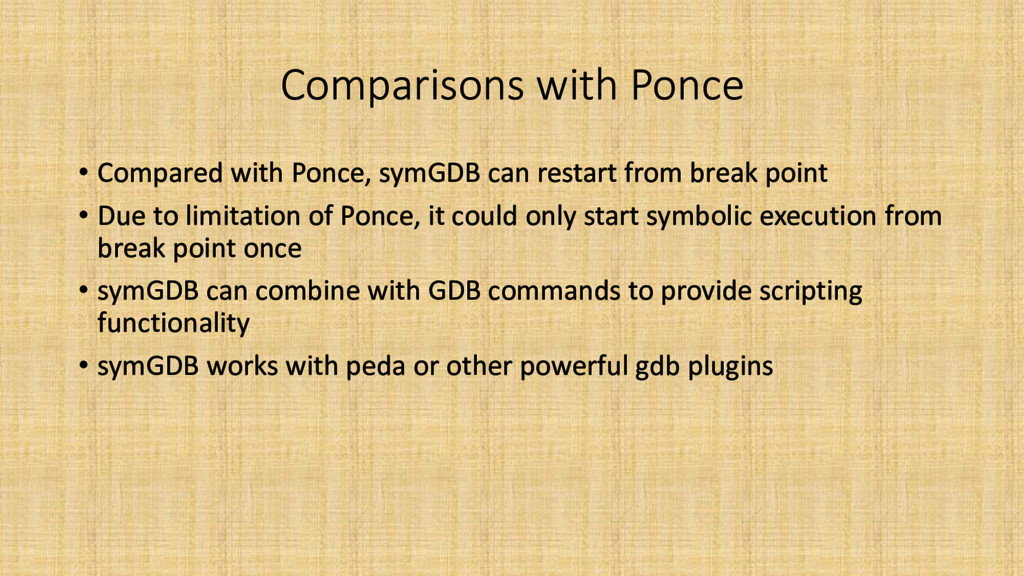
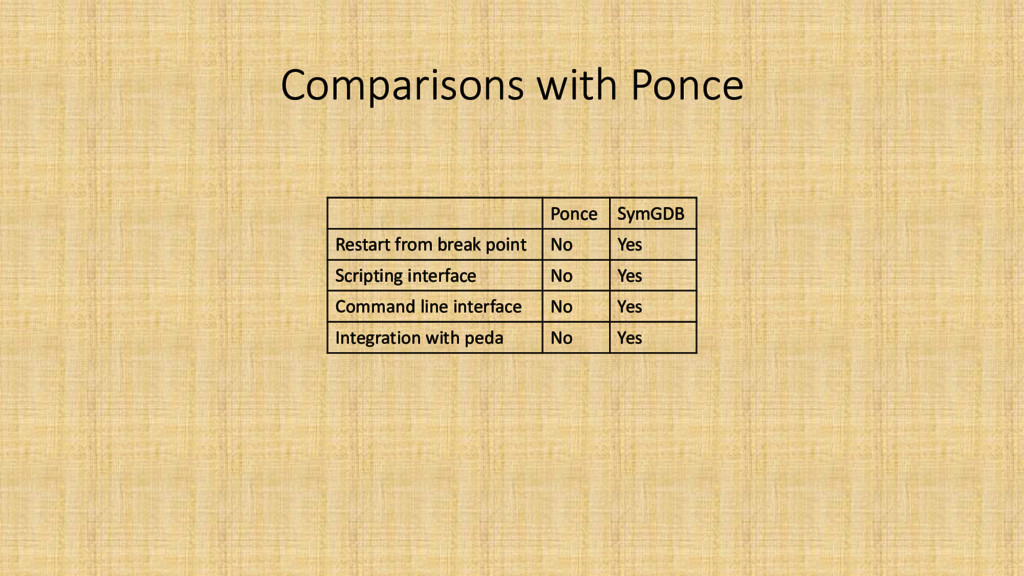
    from break point • Due to limitation of Ponce, it could only start symbolic execution from break point once • symGDB can combine with GDB commands to provide scripting functionality • symGDB works with peda or other powerful gdb plugins
  35. Comparisons with Ponce Ponce SymGDB Restart from break point No

    Yes Scripting interface No Yes Command line interface No Yes Integration with peda No Yes
  36. Outline • Motivation • Objective • Background • Design and

    Implementation • Evaluation • Conclusion • Future work
  37. Conclusions • Symbolic Execution Supports for Software Debugger • First

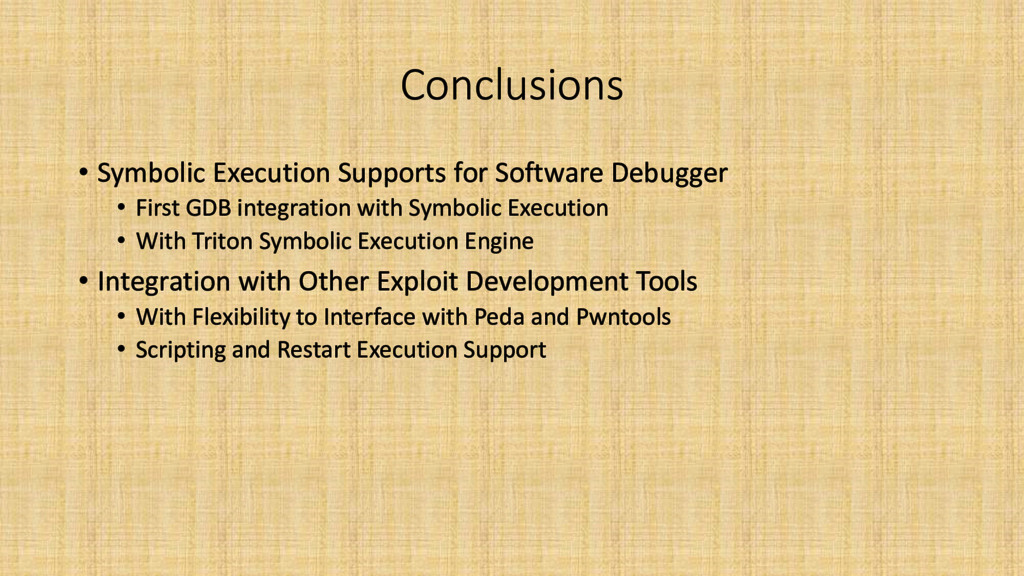
    GDB integration with Symbolic Execution • With Triton Symbolic Execution Engine • Integration with Other Exploit Development Tools • With Flexibility to Interface with Peda and Pwntools • Scripting and Restart Execution Support
  38. Outline • Motivation • Objective • Background • Design and

    Implementation • Evaluation • Conclusion • Future work
  39. Future work • Due to triton only support python2 •

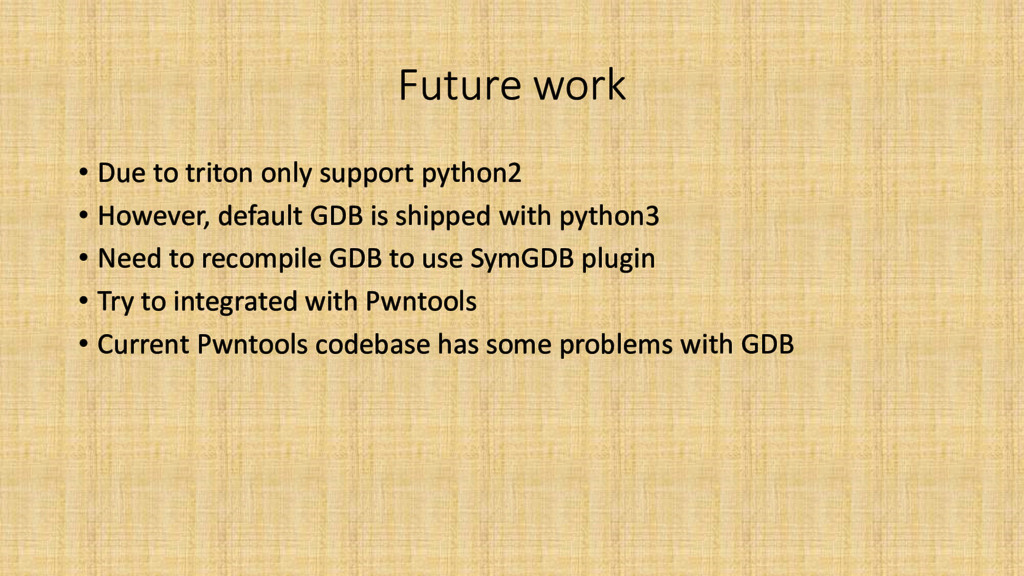
    However, default GDB is shipped with python3 • Need to recompile GDB to use SymGDB plugin • Try to integrated with Pwntools • Current Pwntools codebase has some problems with GDB