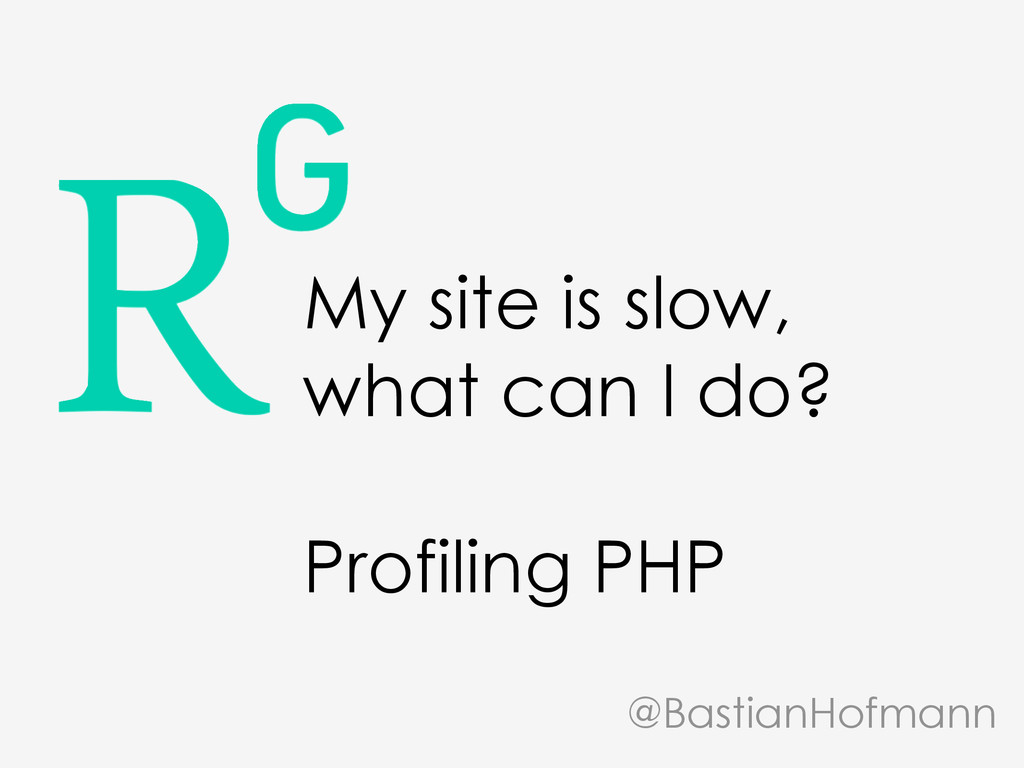
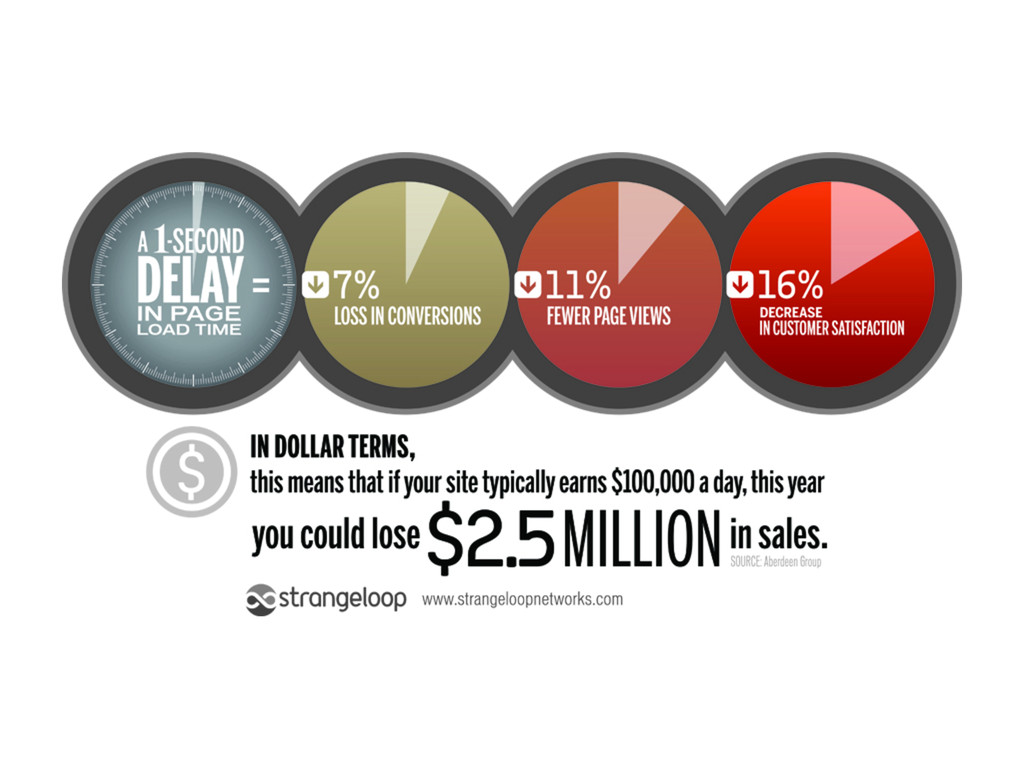
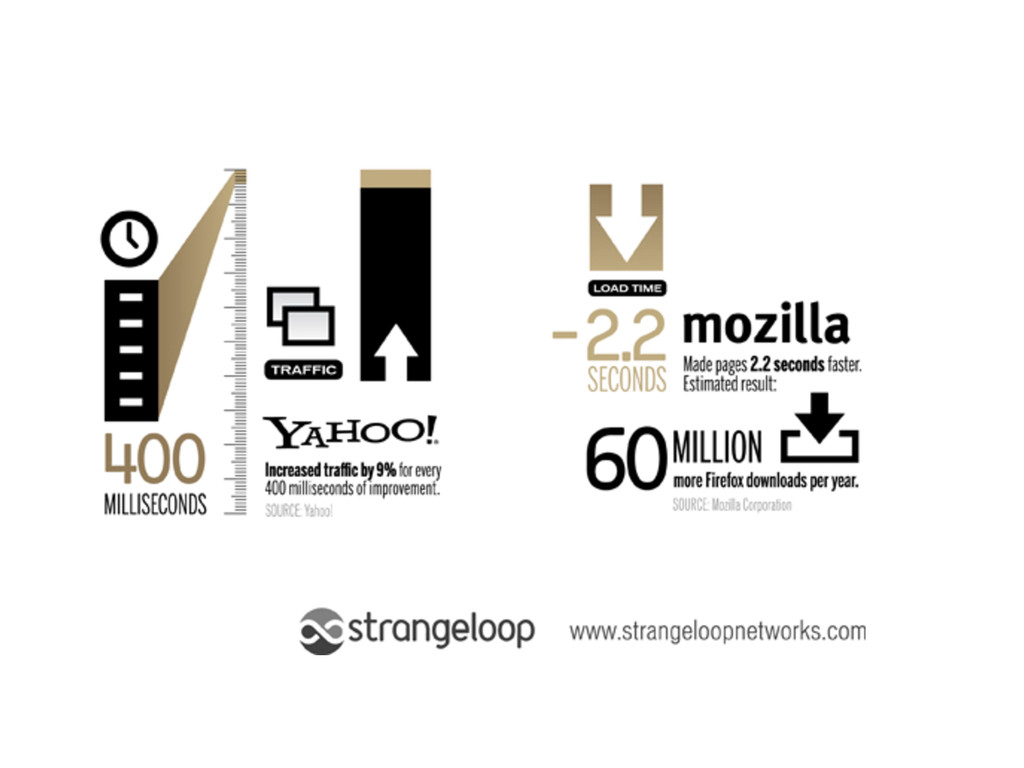
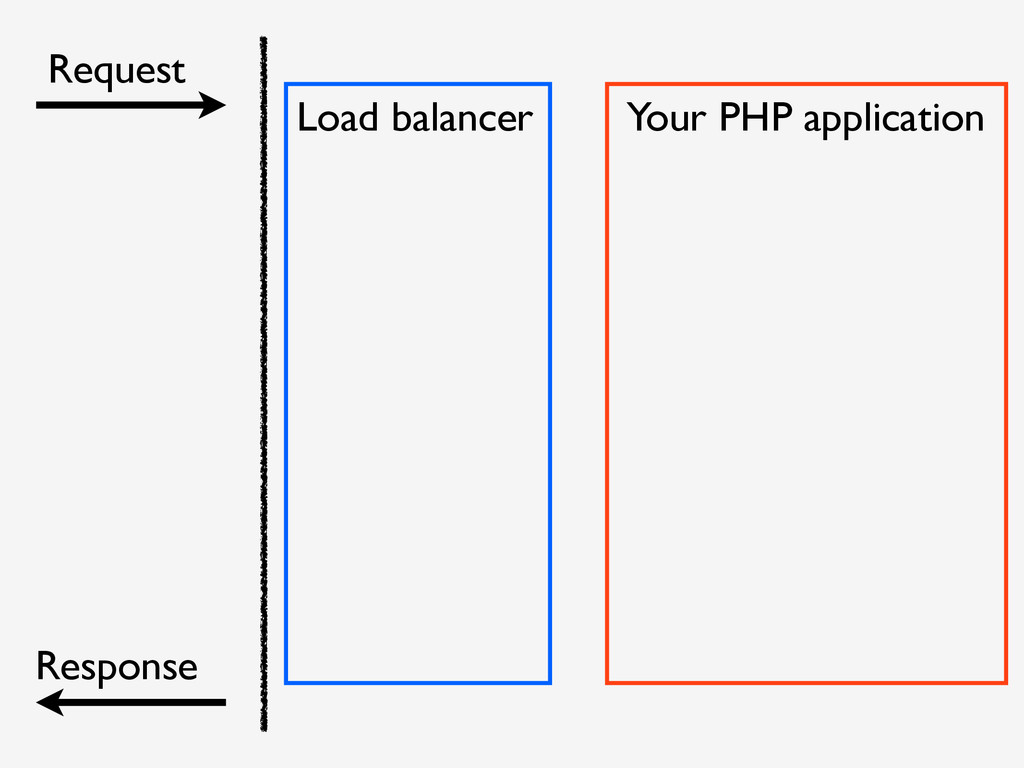
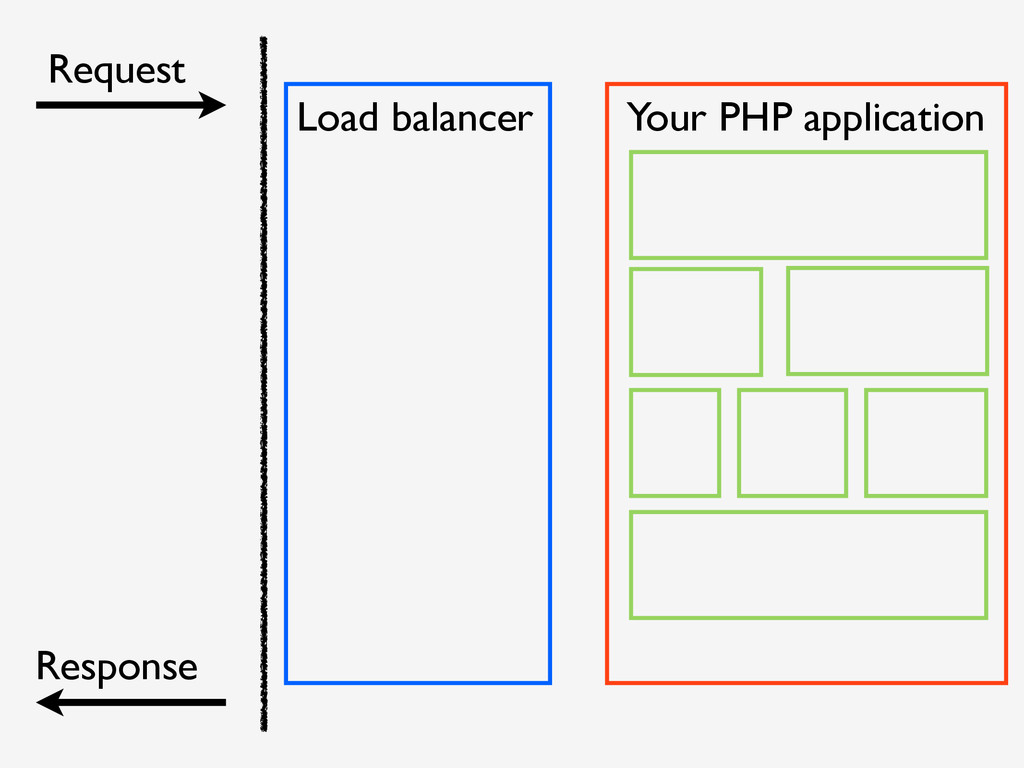
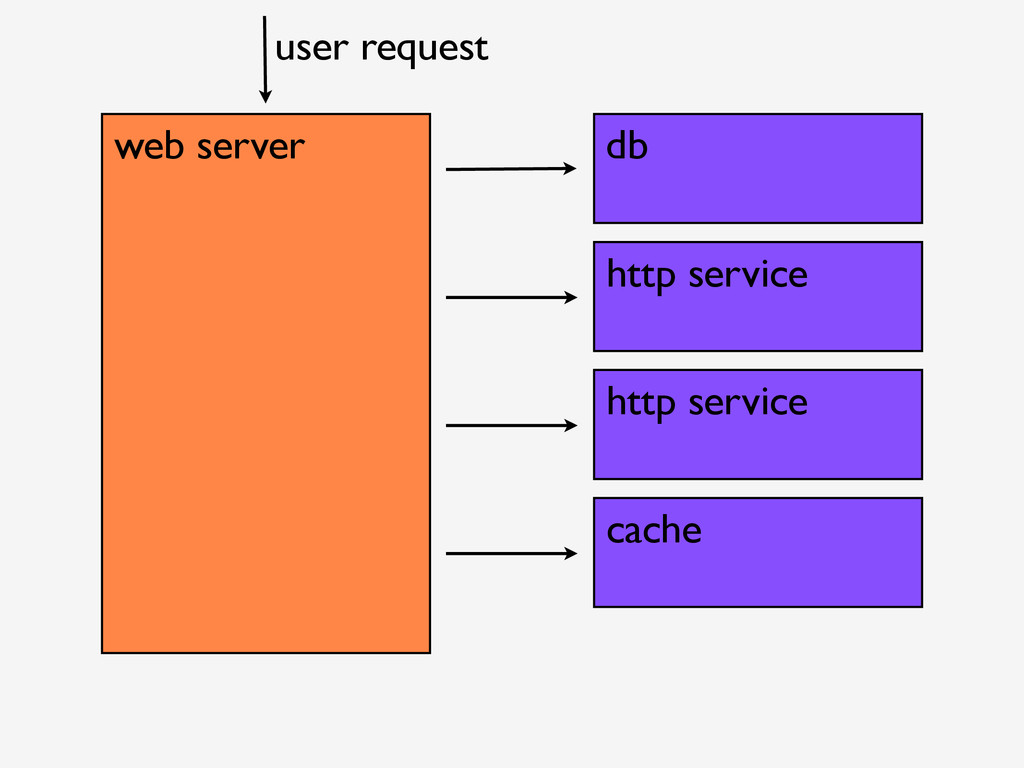
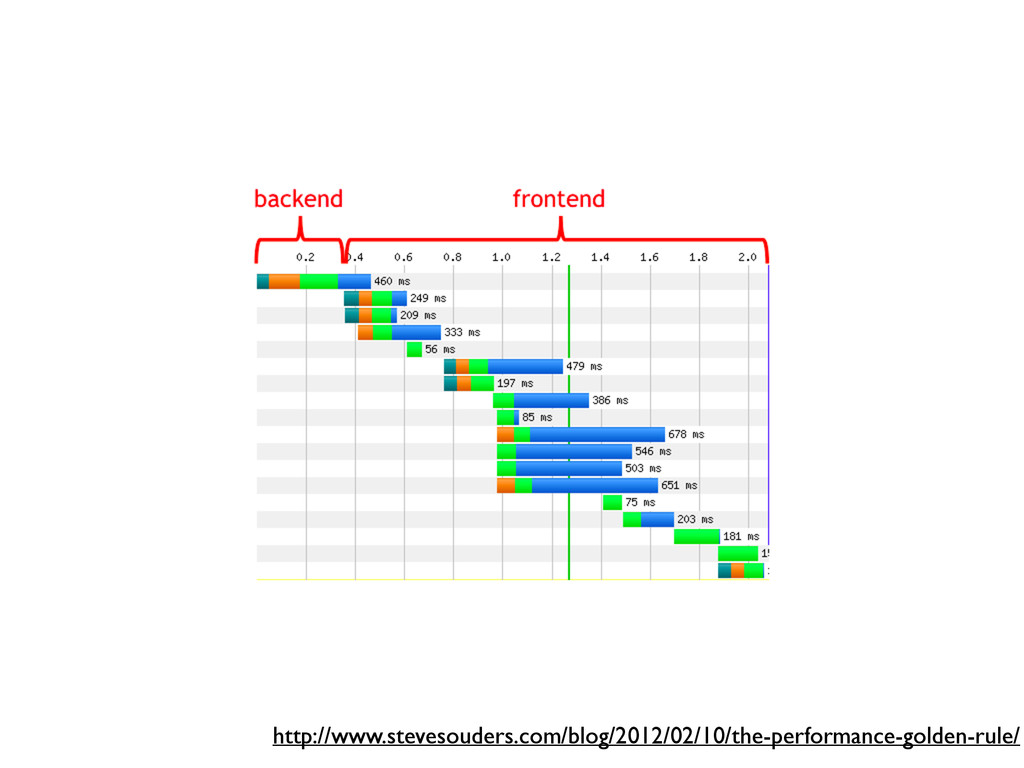
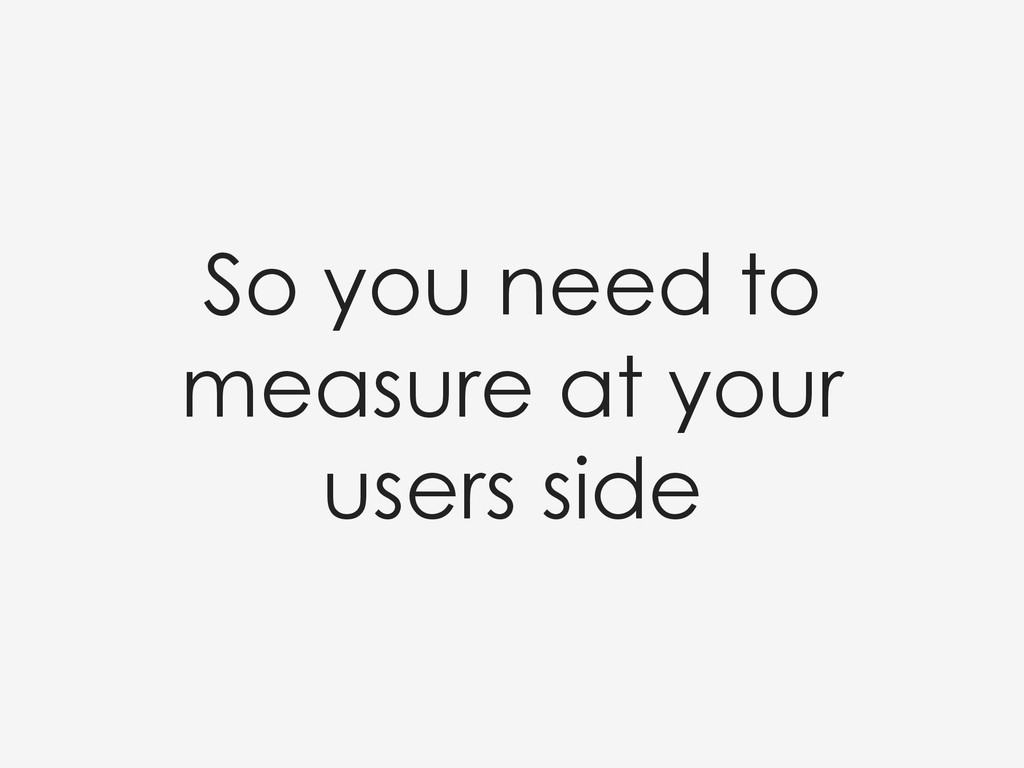
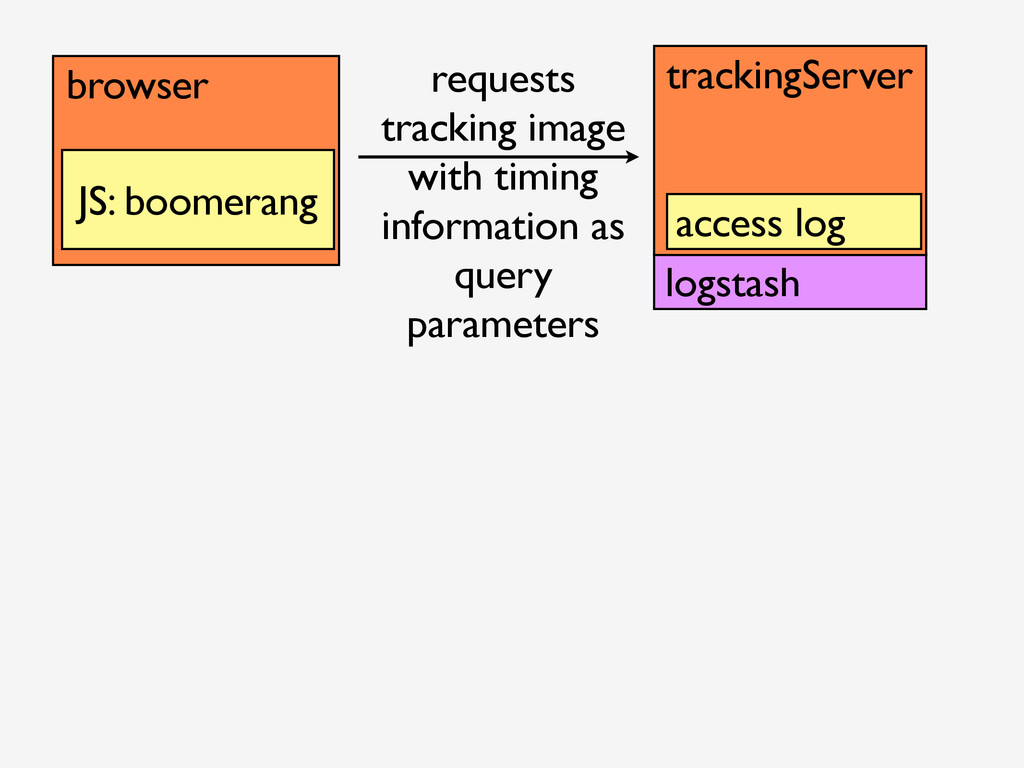
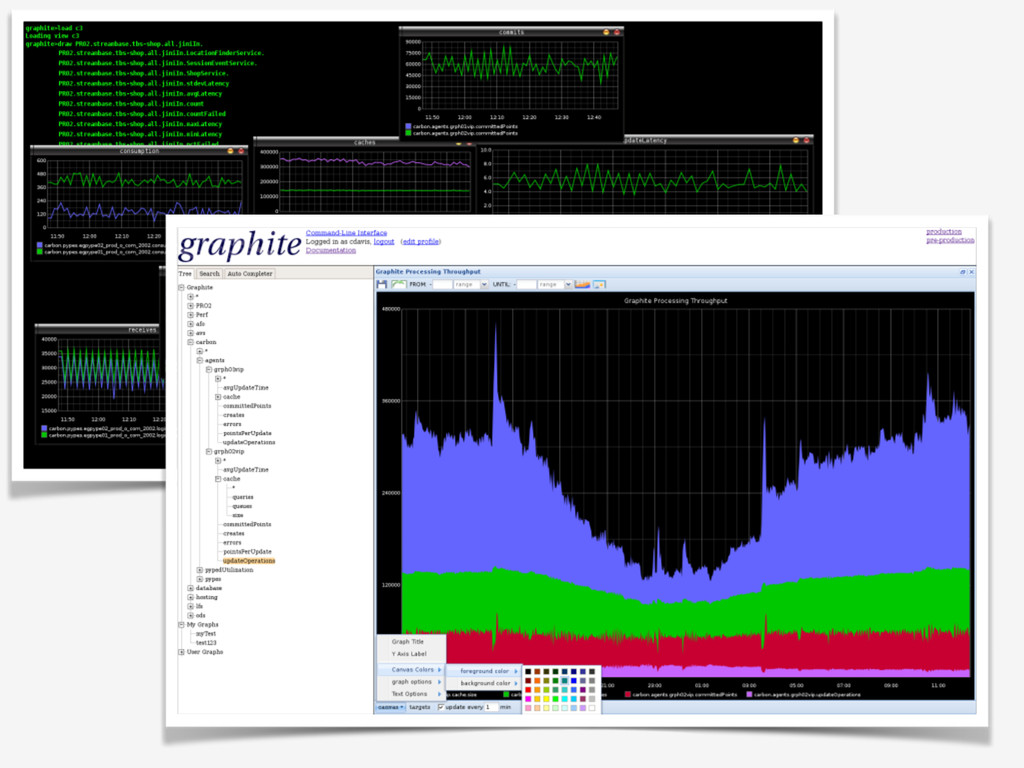
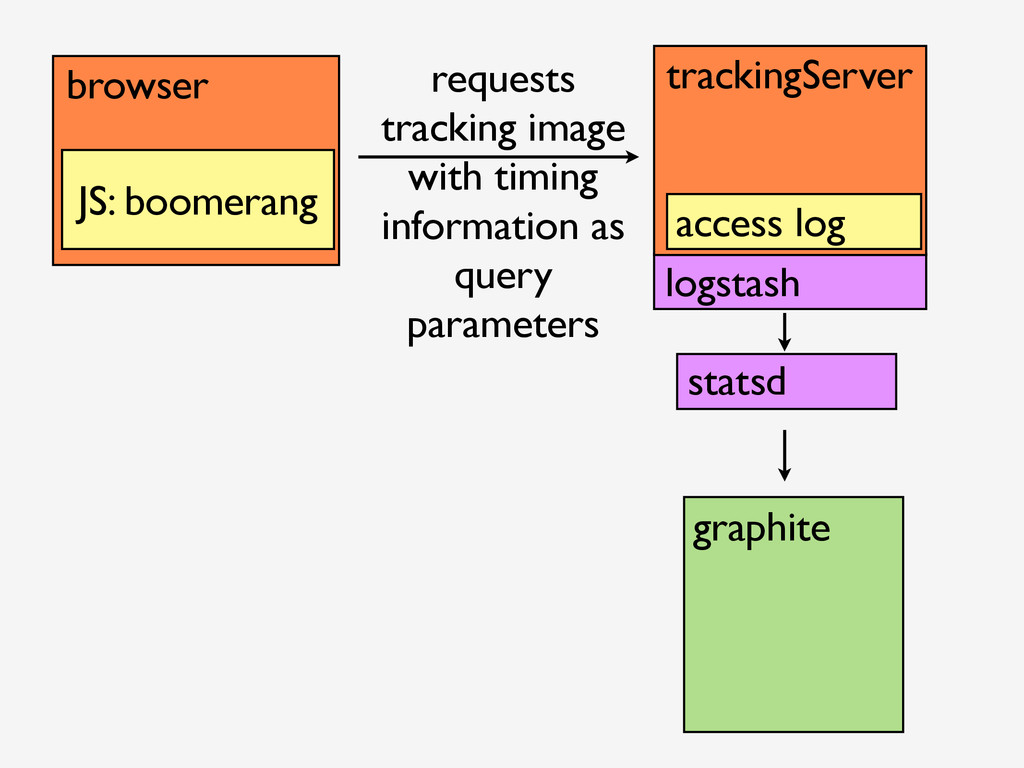
It’s nothing new that speed is important for the success of any web application. Only a few hundred milliseconds may lie between a user leaving your site or staying. Unfortunately performance problems are oftentimes hard to fix and even harder to pinpoint.
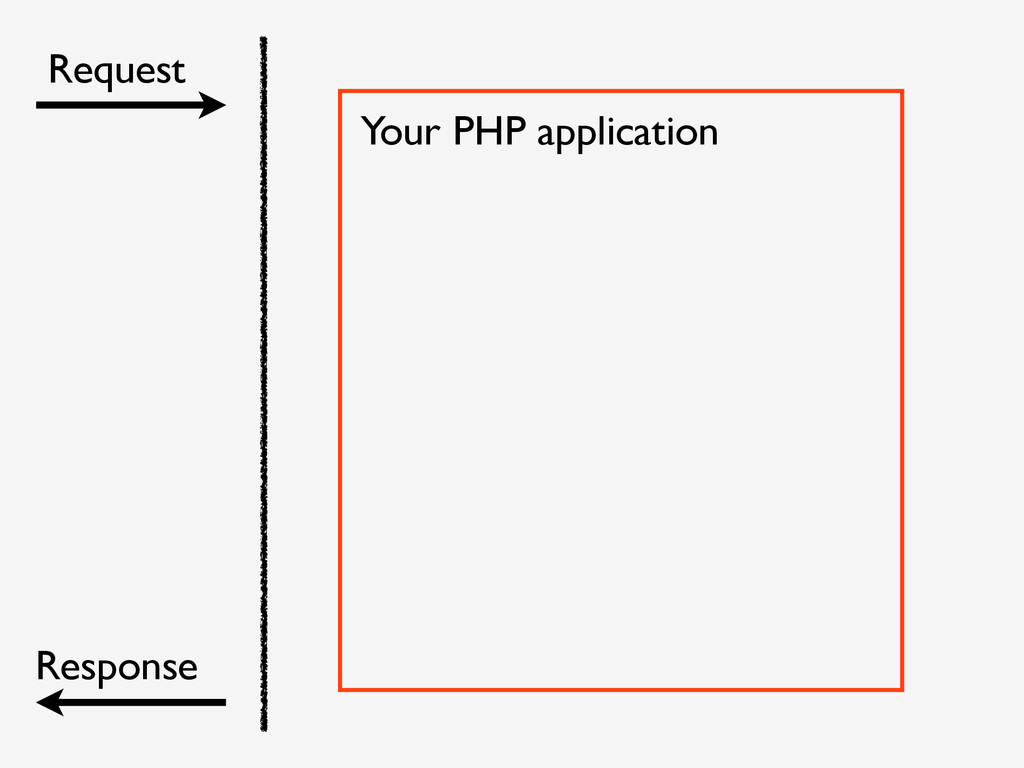
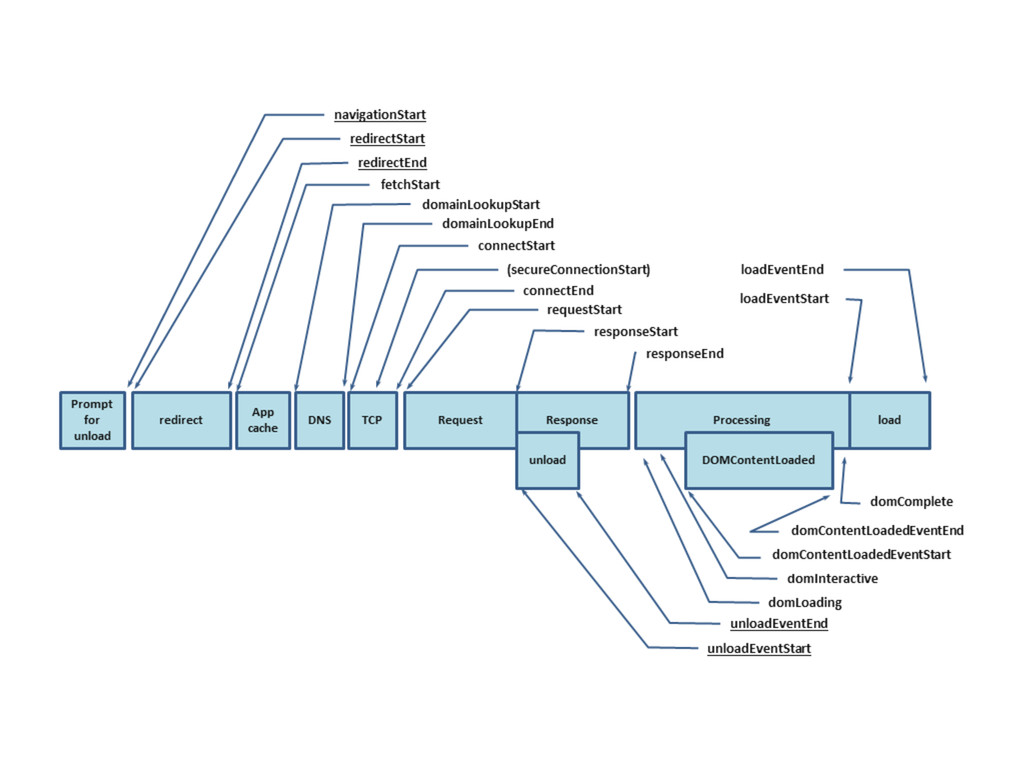
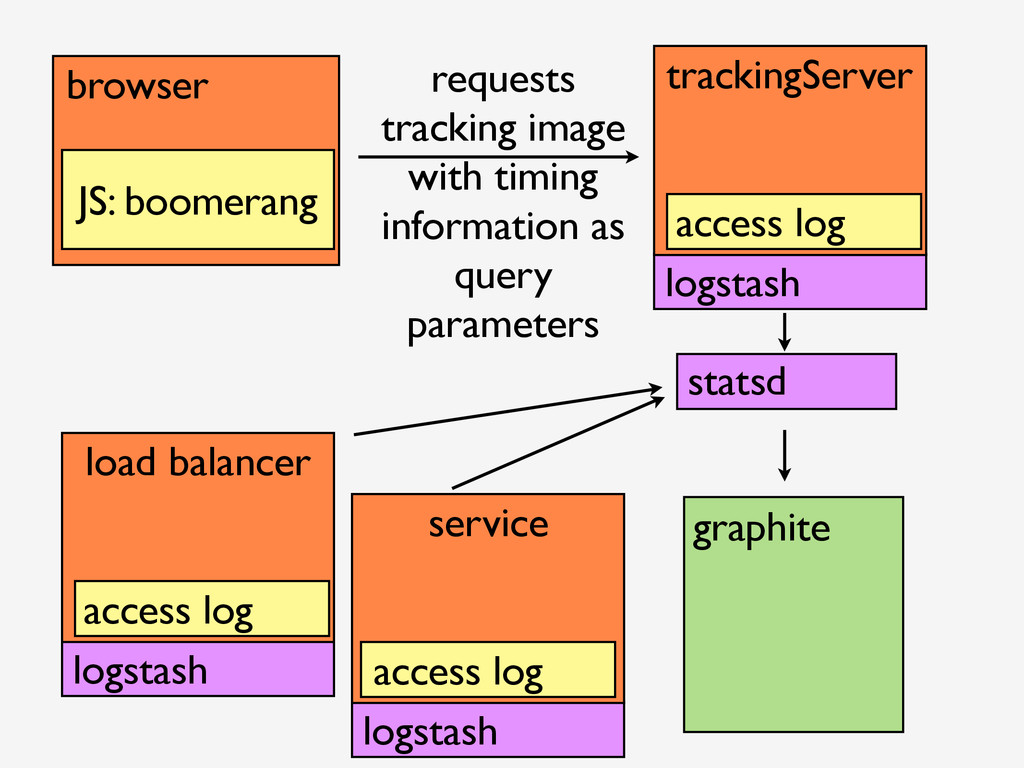
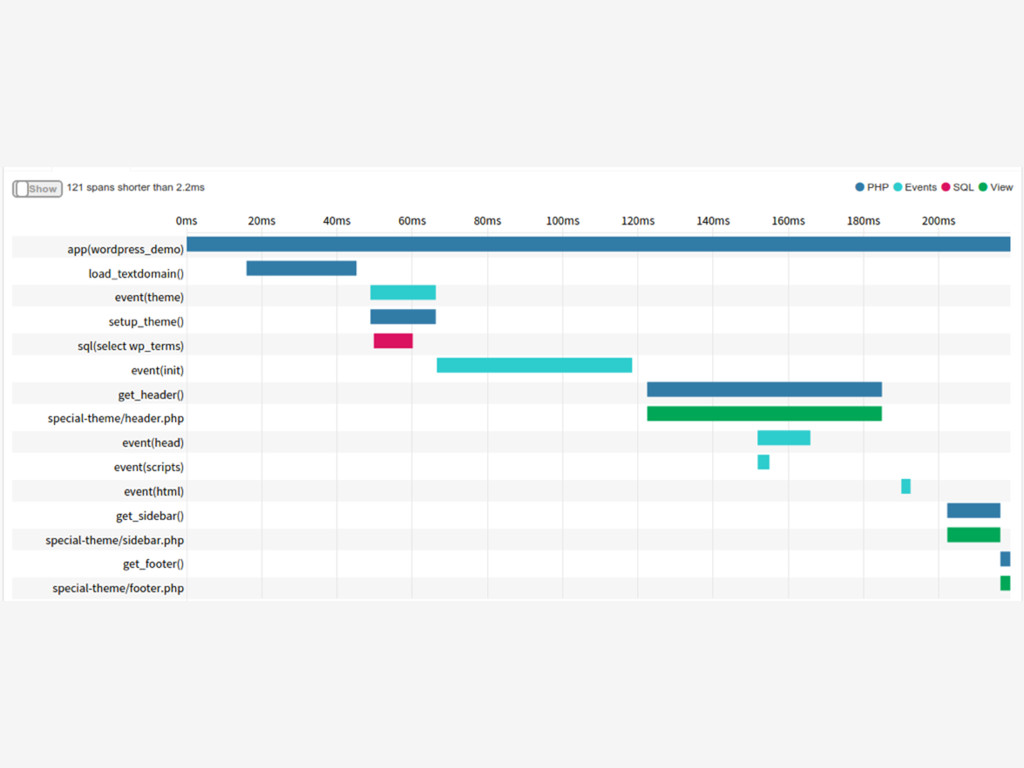
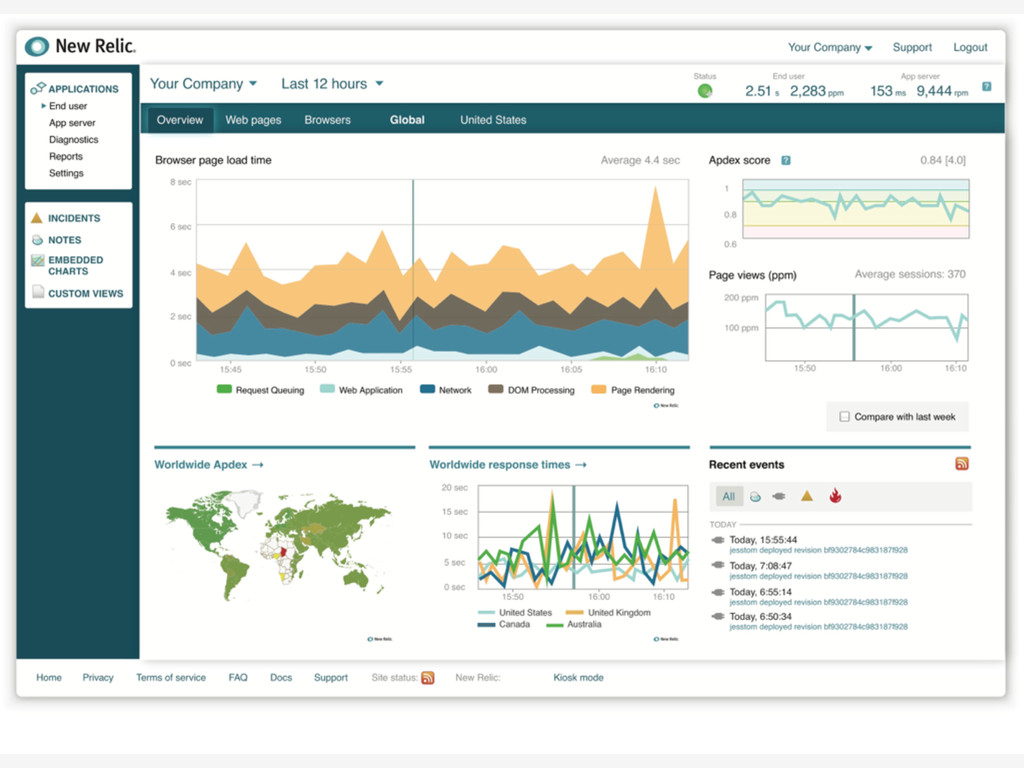
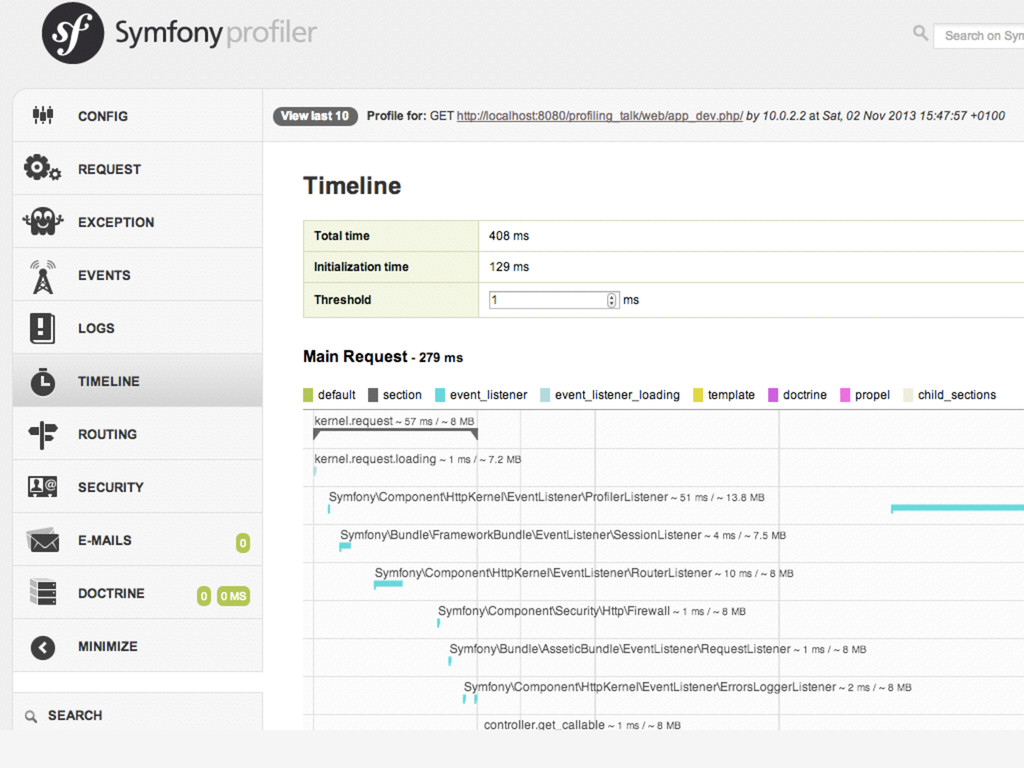
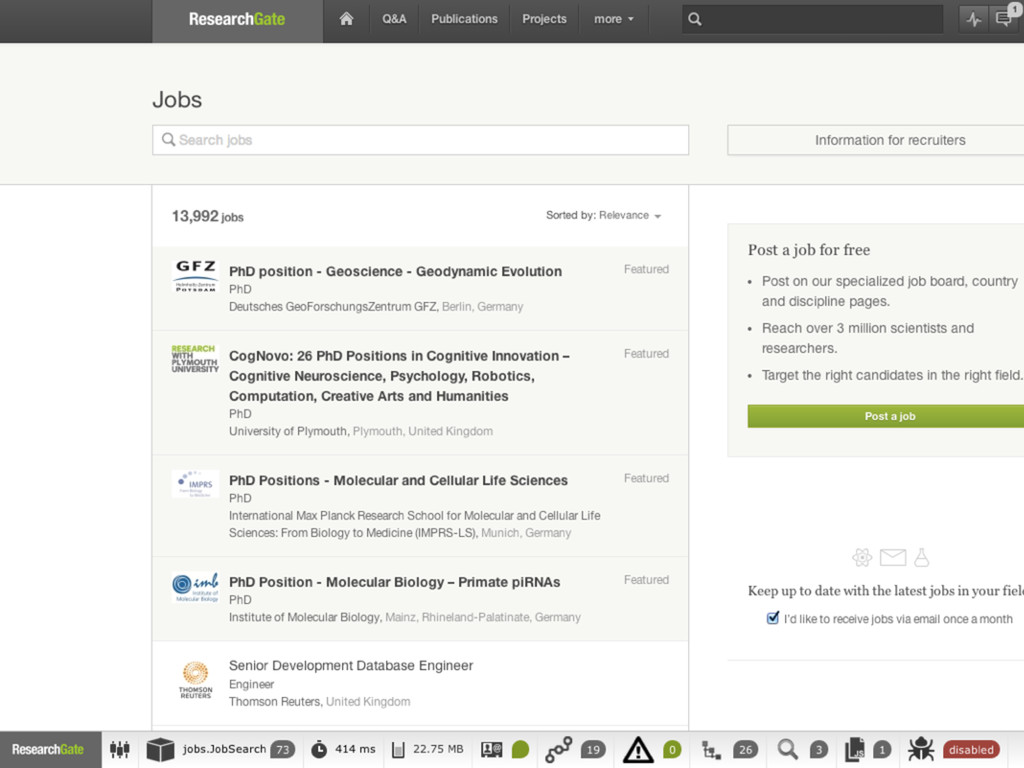
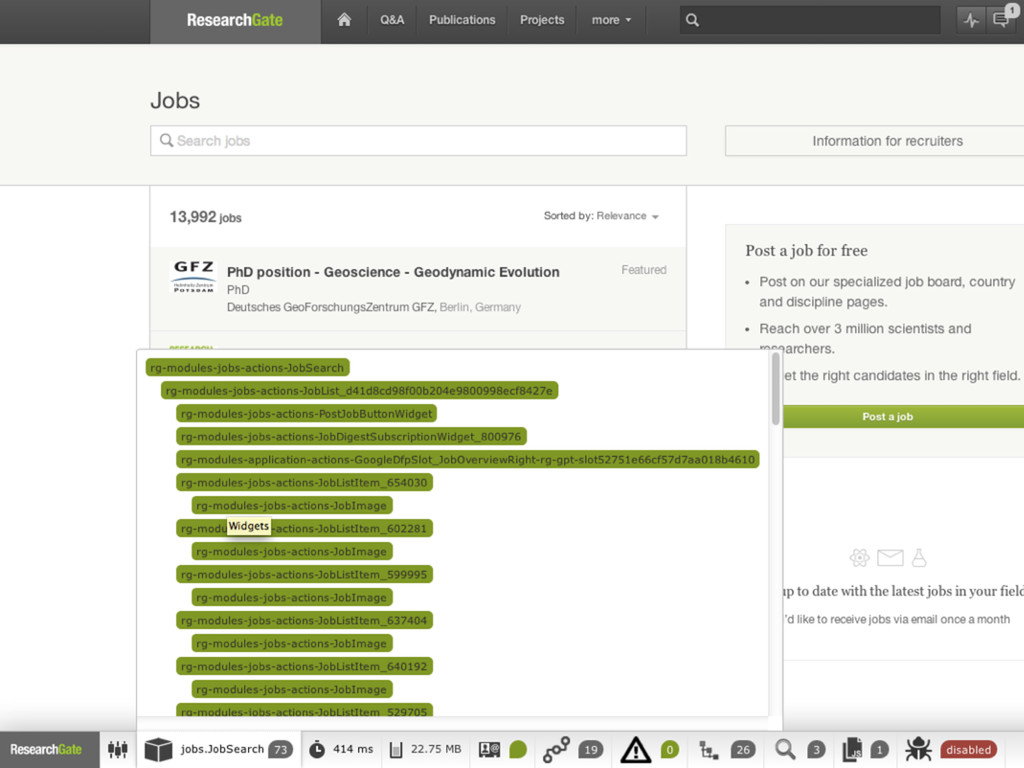
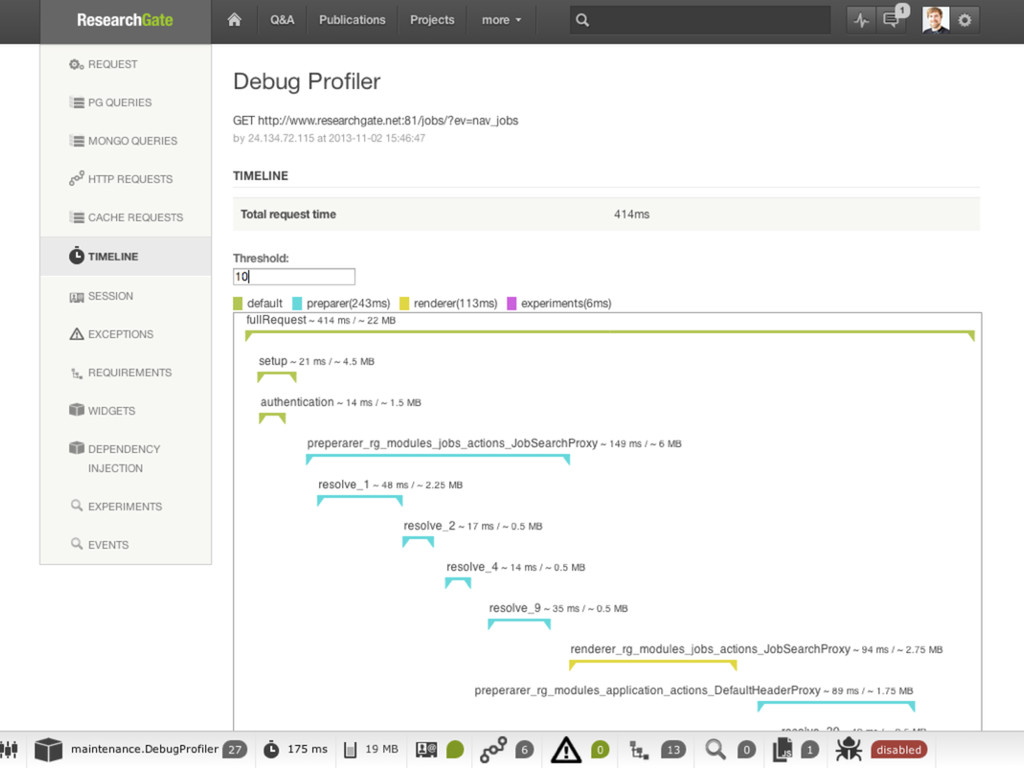
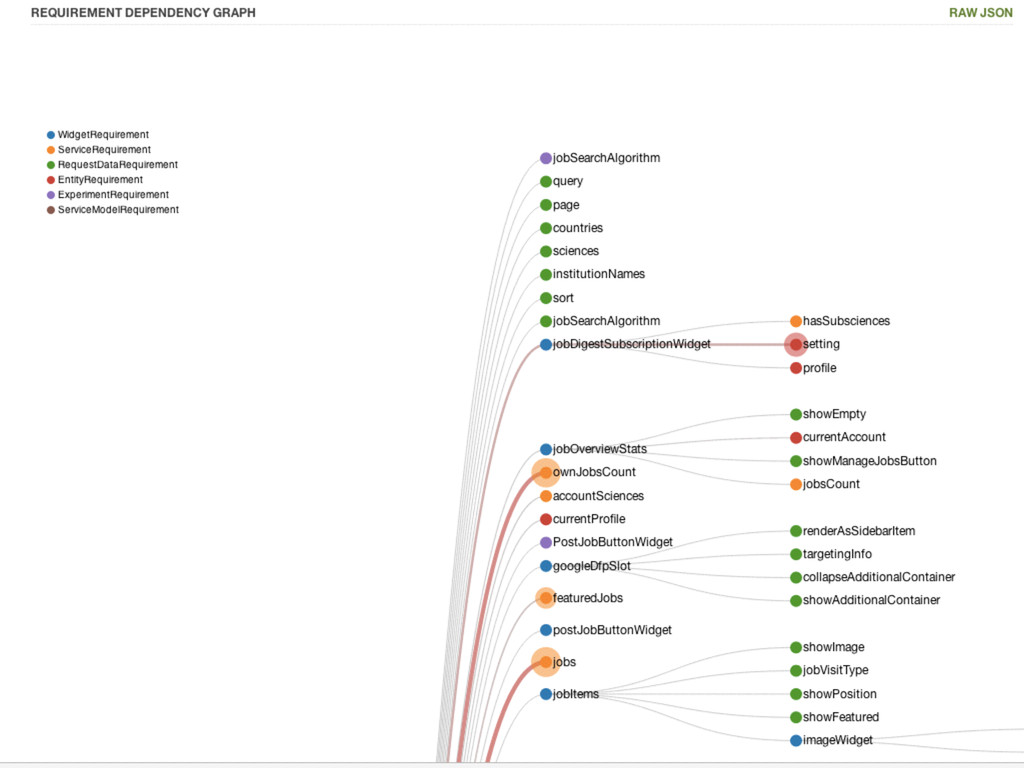
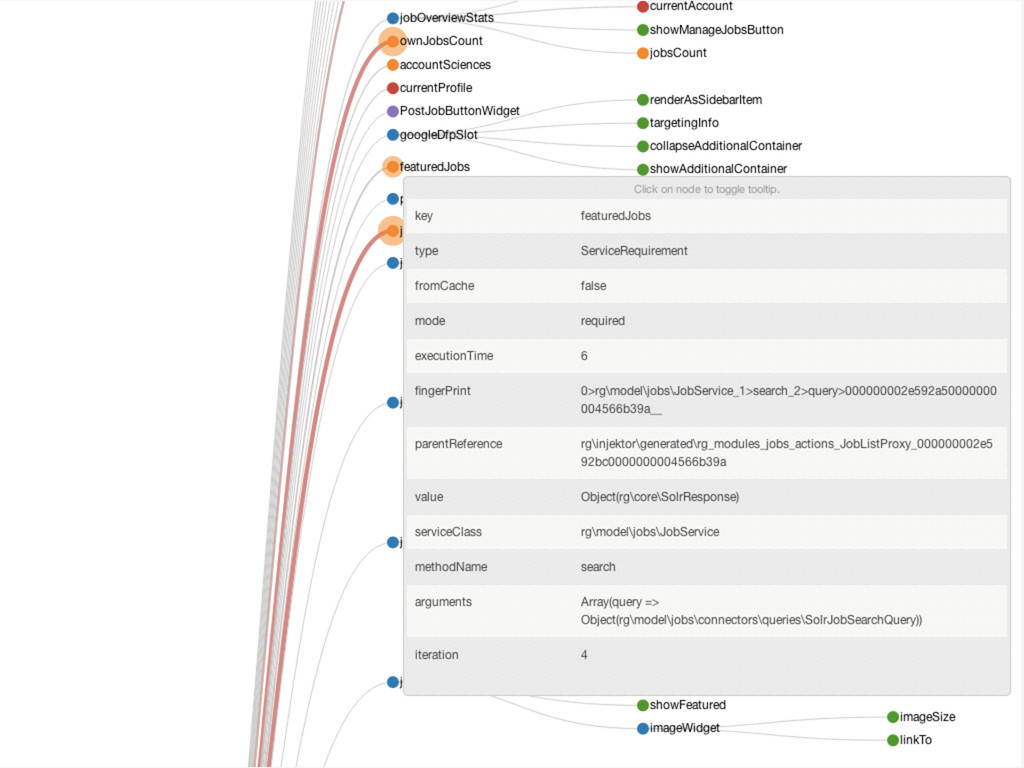
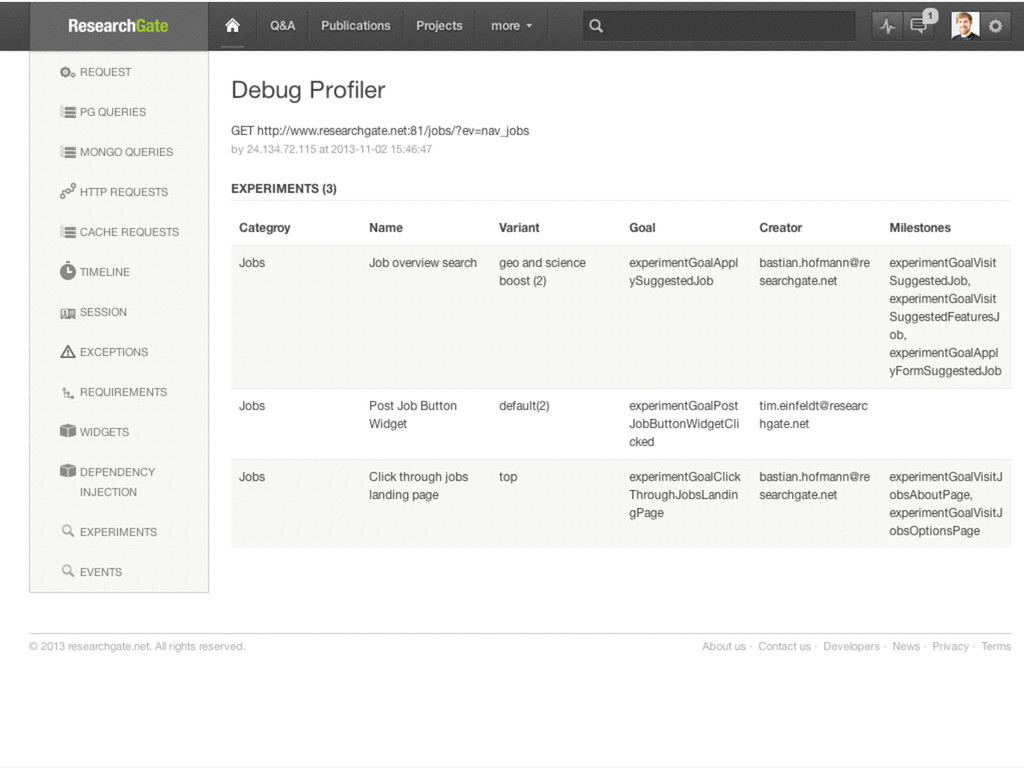
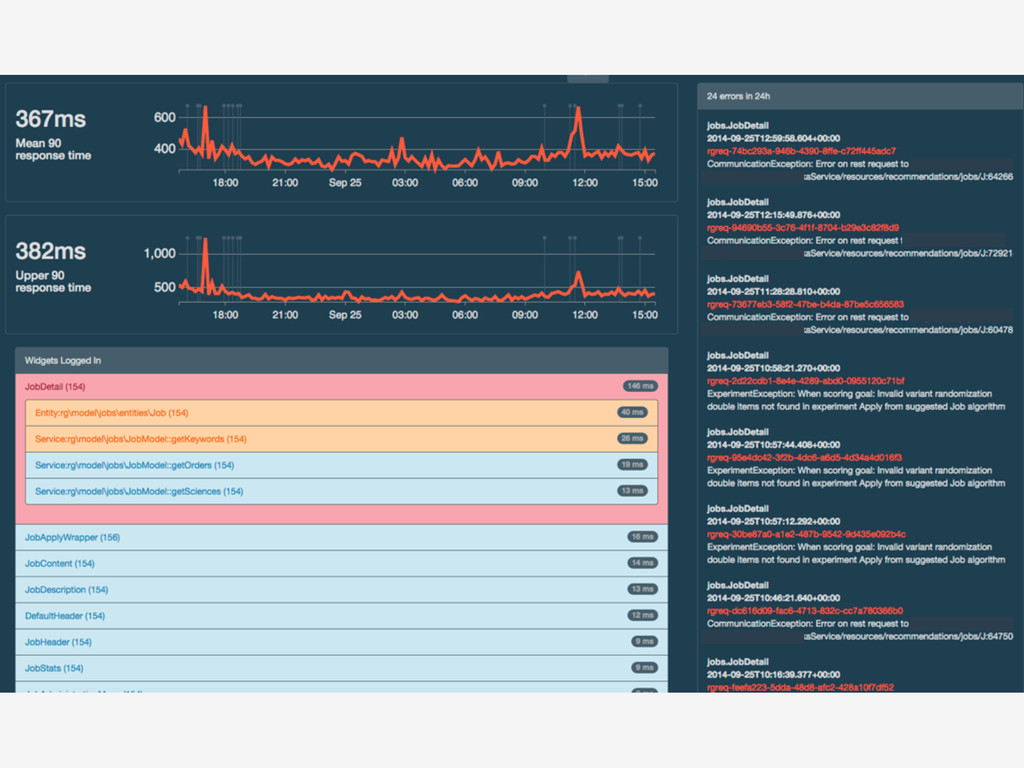
In this talk I will show you how we at ResearchGate measure web application performance, which means not only timing how long the PHP backend took to deliver a page, but also tracking the speed the users actually perceives in the browser. After that you will see how you can track down and analyze any problems you found through measuring with the help of tools like Xdebug, XHProf, Blackfire.io, Tideways.io and the Symfony Debug Toolbar. And if you still need to get faster after optimizing and fixing all these issues, I’ll introduce you to some tricks, techniques and patterns to even further decrease load times.
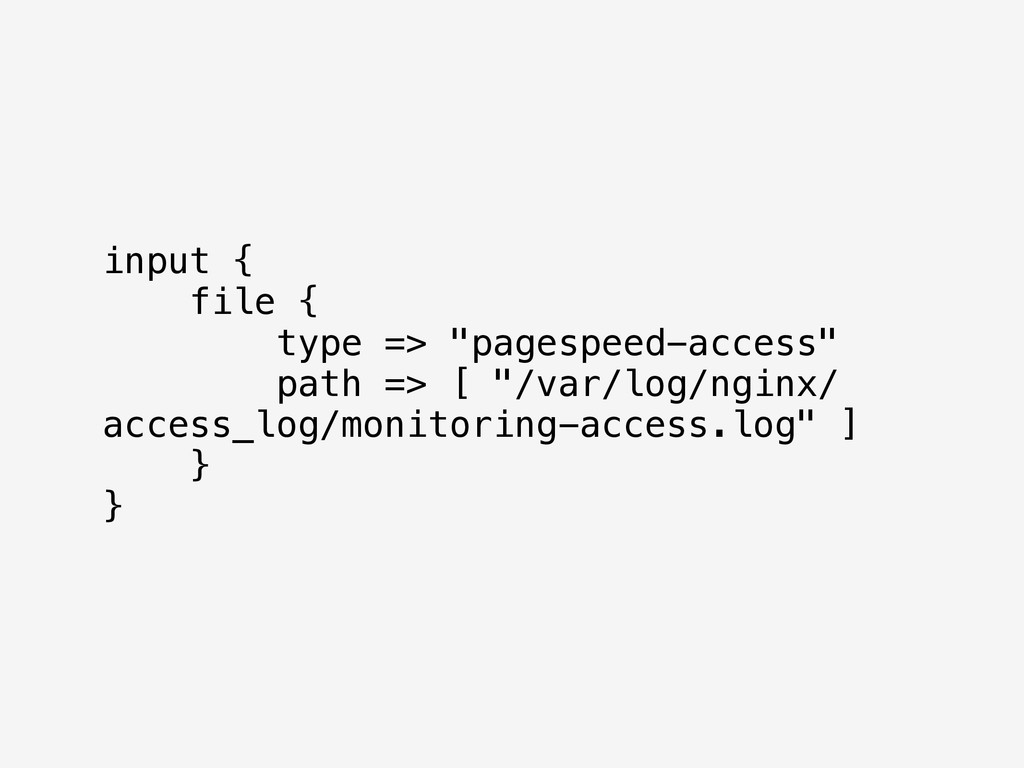
![filter{ grok { type => "pagespeed-access" pattern => "^.*\s\"[A-Z]+\s[^\?\s]+ \?page=%{DATA:page}\&connectTime=%](https://files.speakerdeck.com/presentations/6ce4afe1b8c54783bd63eceb444a8c32/slide_67.jpg)
![output { statsd { type => "pagespeed-access" exclude_tags => ["_grokparsefailure"]](https://files.speakerdeck.com/presentations/6ce4afe1b8c54783bd63eceb444a8c32/slide_68.jpg)
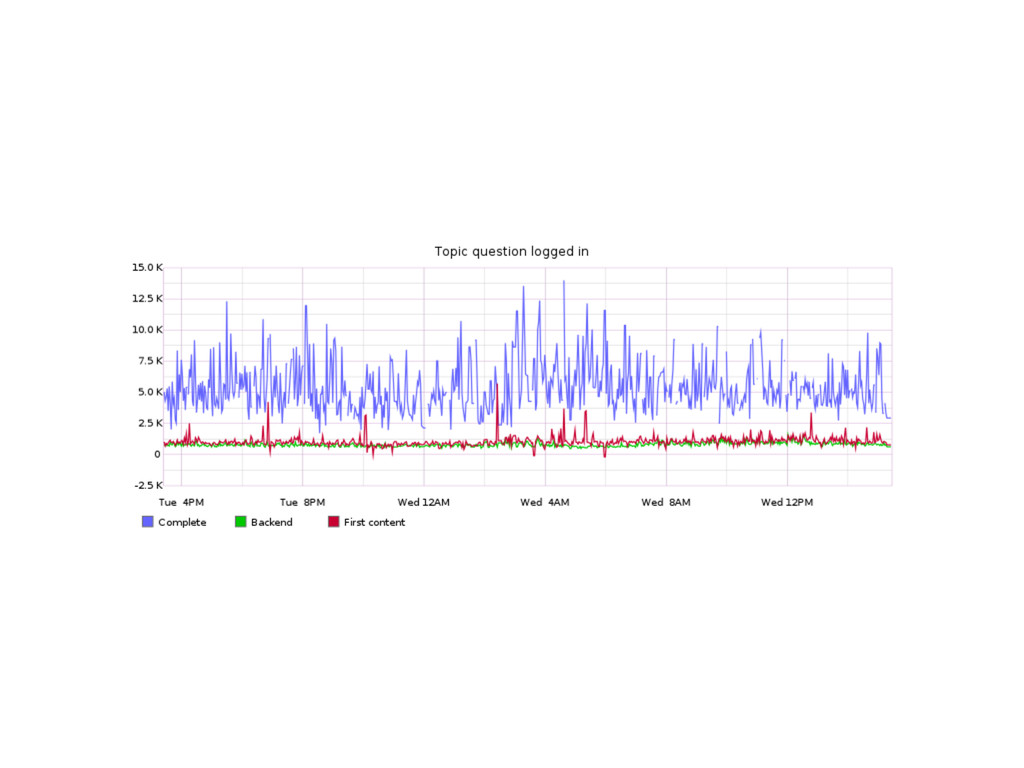
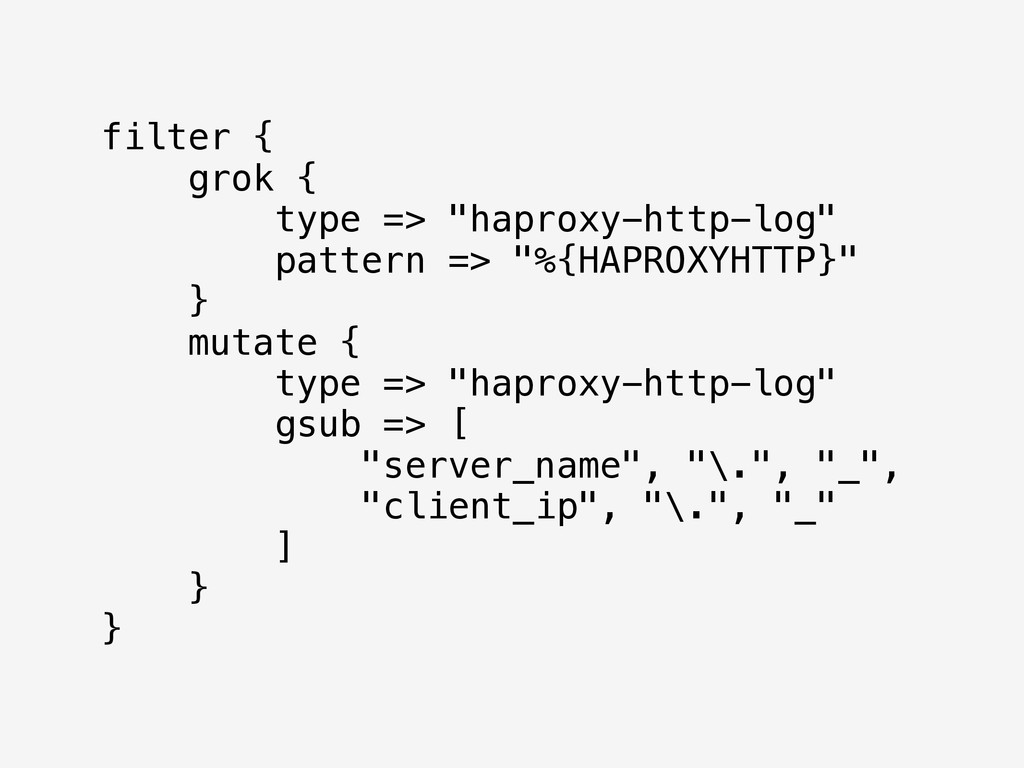
![output { statsd { type => "haproxy-http-log" exclude_tags => ["_grokparsefailure"]](https://files.speakerdeck.com/presentations/6ce4afe1b8c54783bd63eceb444a8c32/slide_74.jpg)
![http://twitter.com/BastianHofmann http://lanyrd.com/people/BastianHofmann http://speakerdeck.com/u/bastianhofmann [email protected]](https://files.speakerdeck.com/presentations/6ce4afe1b8c54783bd63eceb444a8c32/slide_182.jpg)