Upgrade to Pro
— share decks privately, control downloads, hide ads and more …
Speaker Deck
Features
Speaker Deck
PRO
Sign in
Sign up for free
Search
Search
Debugging and profiling jvm applications
Search
Bhuvan Rawal
September 13, 2017
Technology
1.5k
1
Share
Embed
Copy iframe code
Copy JS code
Copy link
Start on current slide
Debugging and profiling jvm applications
Bhuvan Rawal
September 13, 2017
Other Decks in Technology
See All in Technology
技術イベント終了後、運営の 事後タスクは丁寧に (心がけています)/ #tamagawadev
nishiuma
1
100
LLM/Agent評価:トップ営業の発言を「正解」にする 〜暗黙的正解による評価を営業資産に変える〜
takkuhiro
1
210
しぶいSRE: サーバから見えない障害にどう向き合うか。ラストワンマイルのデバッグ実践 / Shibui SRE
kanny
13
6.1k
SRE Lounge Hiroshimaへの招待
grimoh
0
640
インフラと開発の垣根を超えていき!〜元AWSインフラエンジニアがAWS開発で奮闘している話〜
hatahata021
2
180
AI時代の EM への処方箋
staka121
PRO
0
140
ZOZOTOWNの進化と信頼性を両立する負荷試験
zozotech
PRO
2
160
なぜ私たちのSREプラクティスはなかなか機能しないのか 〜システムより先に組織を見る〜 / Why our SRE practices aren't really working
vtryo
3
3.7k
AI Driven AI Governance
pict3
0
350
ボーイスカウトルールでメモリやスキルを改善しよう
azukiazusa1
2
990
Devsumi 2026 Summer 人もAIも使える共通基盤を事業の加速装置にする~デザインシステム運用に学ぶ組織レバレッジ~ 渡辺 凌央
legalontechnologies
PRO
0
120
AI Agent SaaS を支える自社仮想化基盤への挑戦と実運用 / ai-agent-saas-virtualization
flatt_security
2
3.9k
Featured
See All Featured
Why Mistakes Are the Best Teachers: Turning Failure into a Pathway for Growth
auna
0
180
Bootstrapping a Software Product
garrettdimon
PRO
307
120k
Future Trends and Review - Lecture 12 - Web Technologies (1019888BNR)
signer
PRO
0
3.6k
Fantastic passwords and where to find them - at NoRuKo
philnash
52
3.8k
ラッコキーワード サービス紹介資料
rakko
1
3.9M
Unlocking the hidden potential of vector embeddings in international SEO
frankvandijk
0
870
Rebuilding a faster, lazier Slack
samanthasiow
85
9.6k
The Art of Programming - Codeland 2020
erikaheidi
57
14k
Noah Learner - AI + Me: how we built a GSC Bulk Export data pipeline
techseoconnect
PRO
0
220
Helping Users Find Their Own Way: Creating Modern Search Experiences
danielanewman
31
3.2k
Paper Plane
katiecoart
PRO
2
52k
Product Roadmaps are Hard
iamctodd
55
12k
Transcript
Debugging JVM Applications
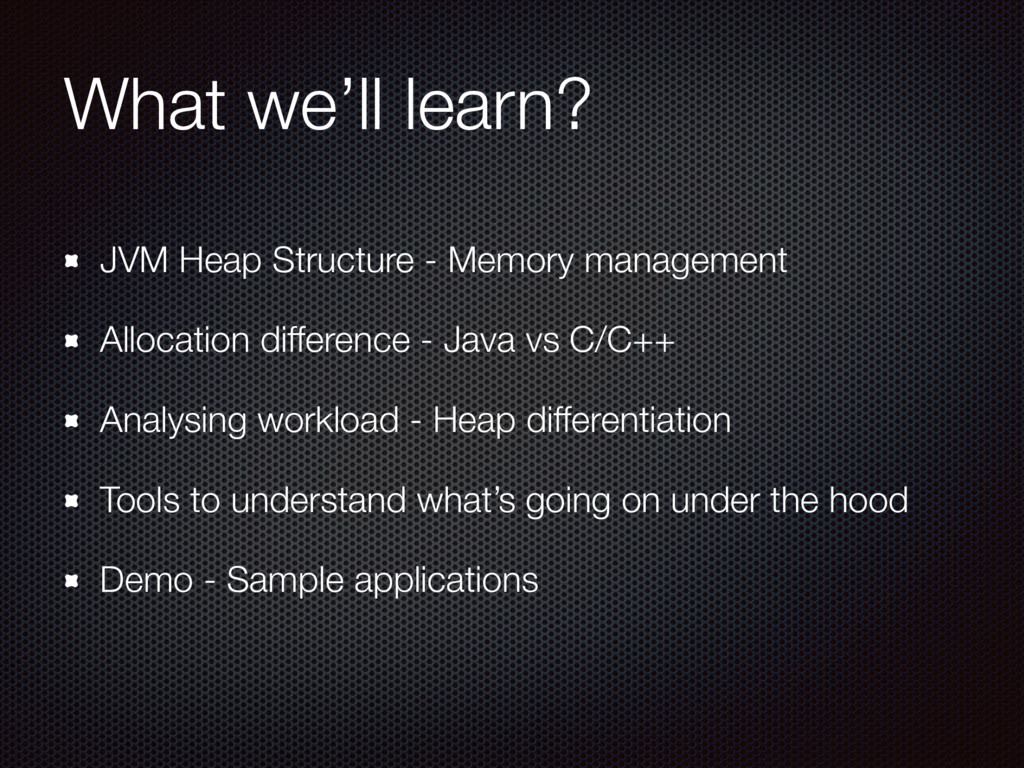
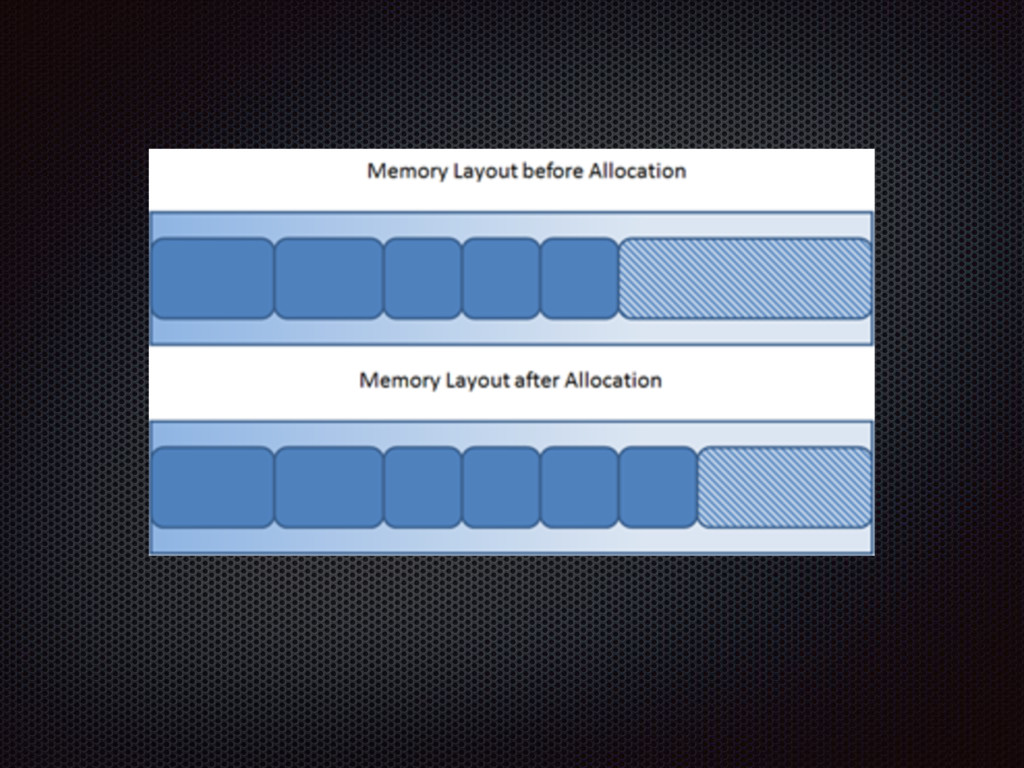
What we’ll learn? JVM Heap Structure - Memory management Allocation
difference - Java vs C/C++ Analysing workload - Heap differentiation Tools to understand what’s going on under the hood Demo - Sample applications
None
Types of GC collectors Serial Collector Parallel Garbage Collector CMS
Garbage Collector G1 Garbage Collector - New guy on the block
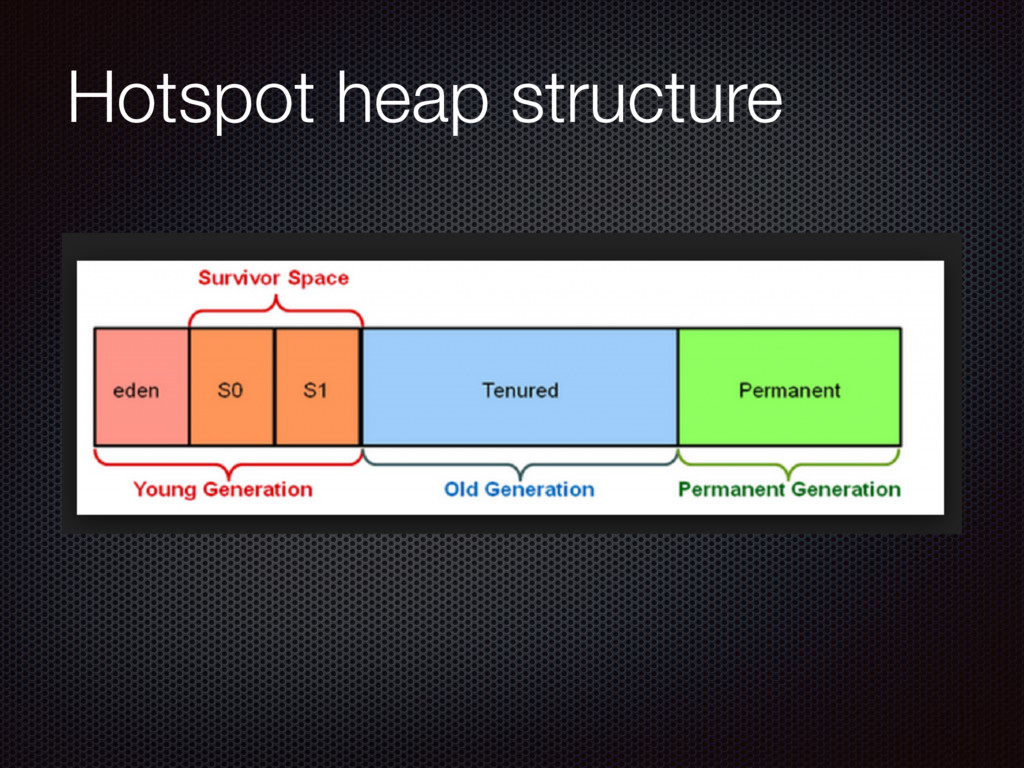
Hotspot heap structure
None
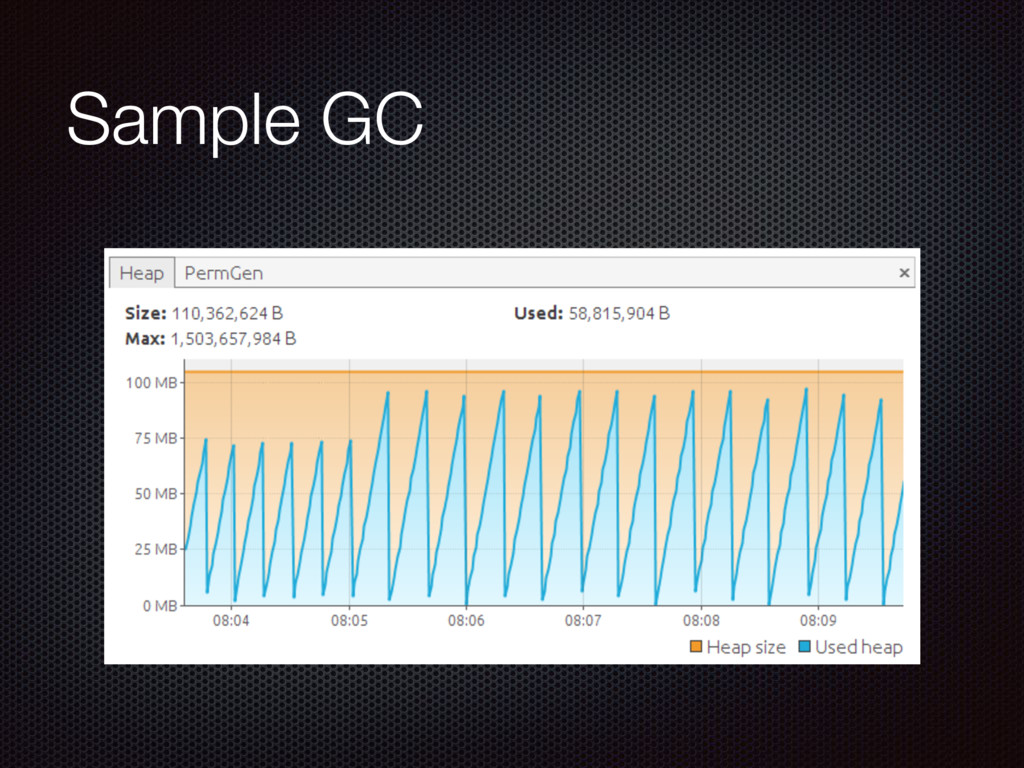
Sample GC
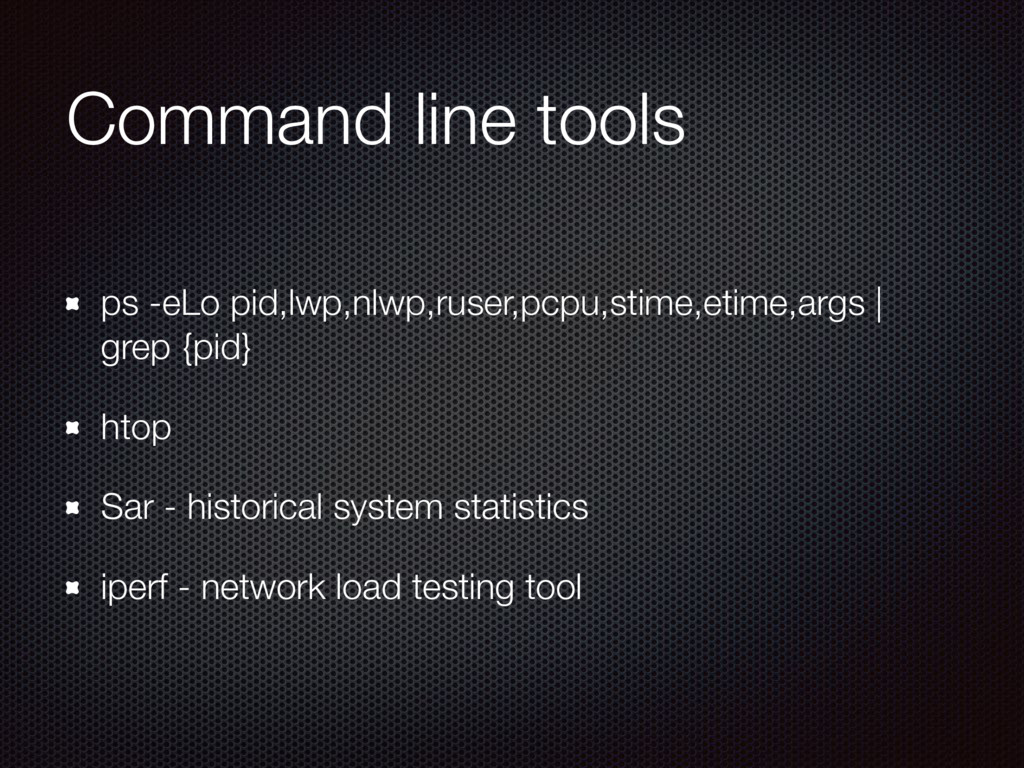
Command line tools ps -eLo pid,lwp,nlwp,ruser,pcpu,stime,etime,args | grep {pid} htop
Sar - historical system statistics iperf - network load testing tool
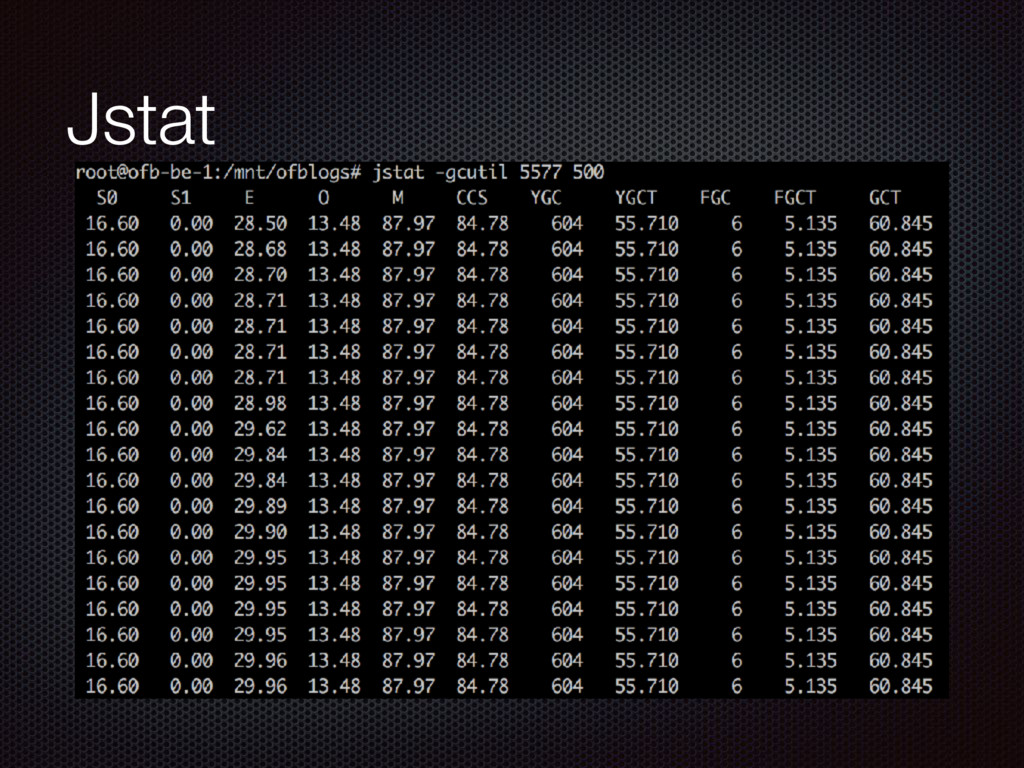
Jstat
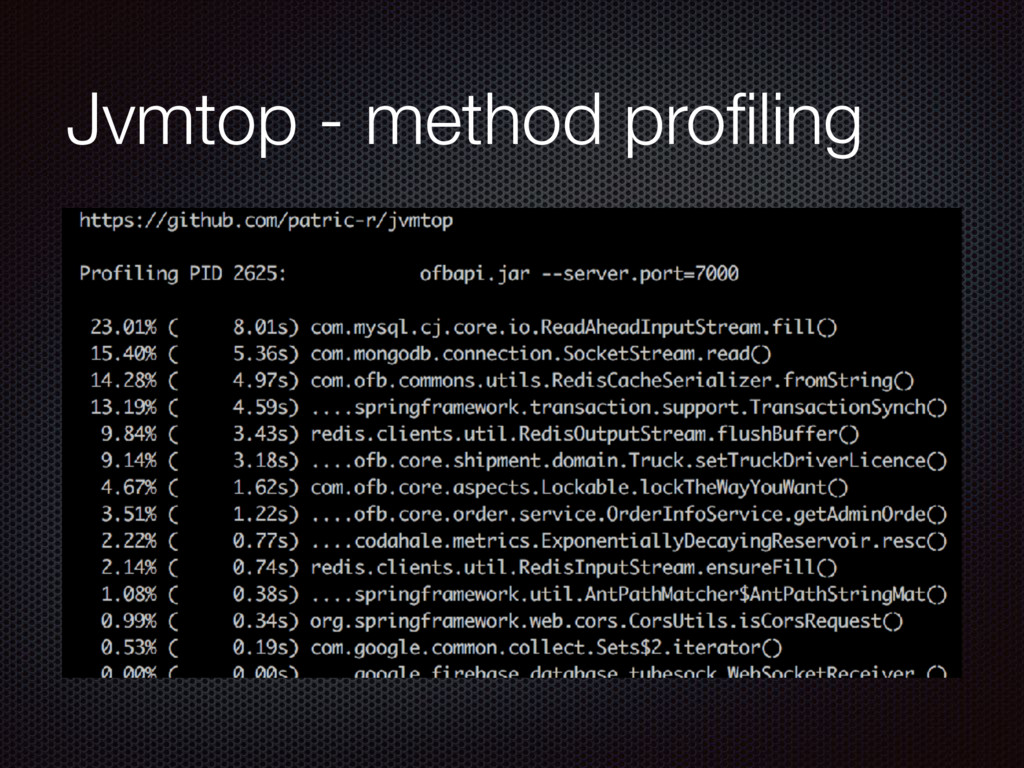
Jvmtop - method profiling
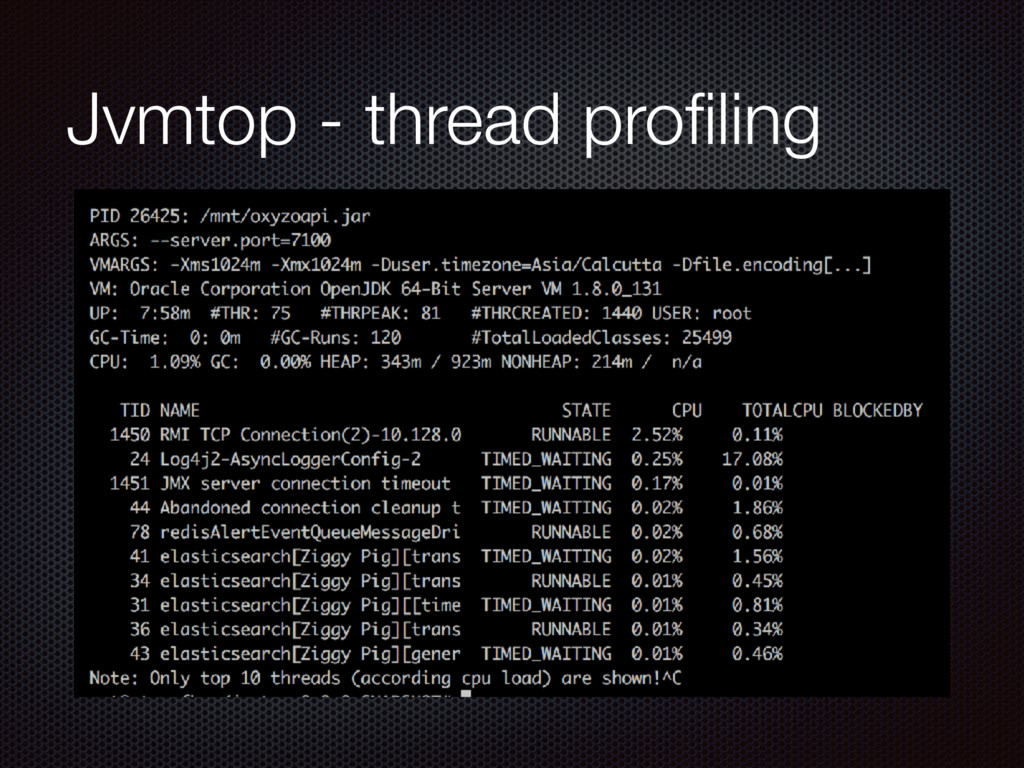
Jvmtop - thread profiling
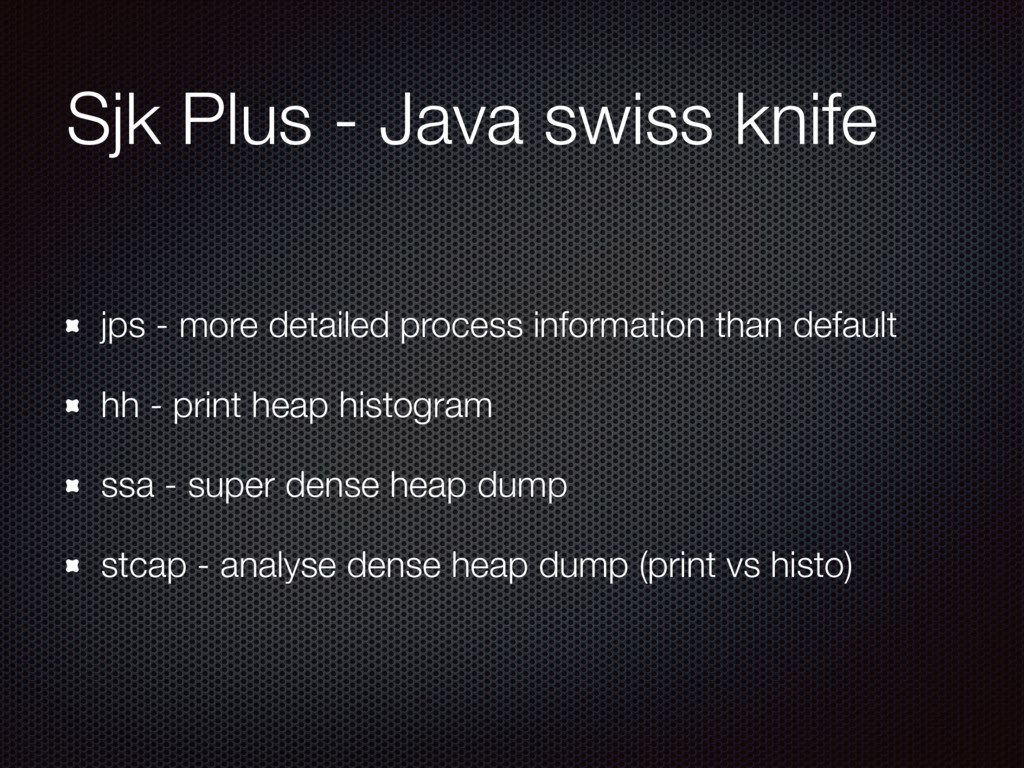
Sjk Plus - Java swiss knife jps - more detailed
process information than default hh - print heap histogram ssa - super dense heap dump stcap - analyse dense heap dump (print vs histo)
None
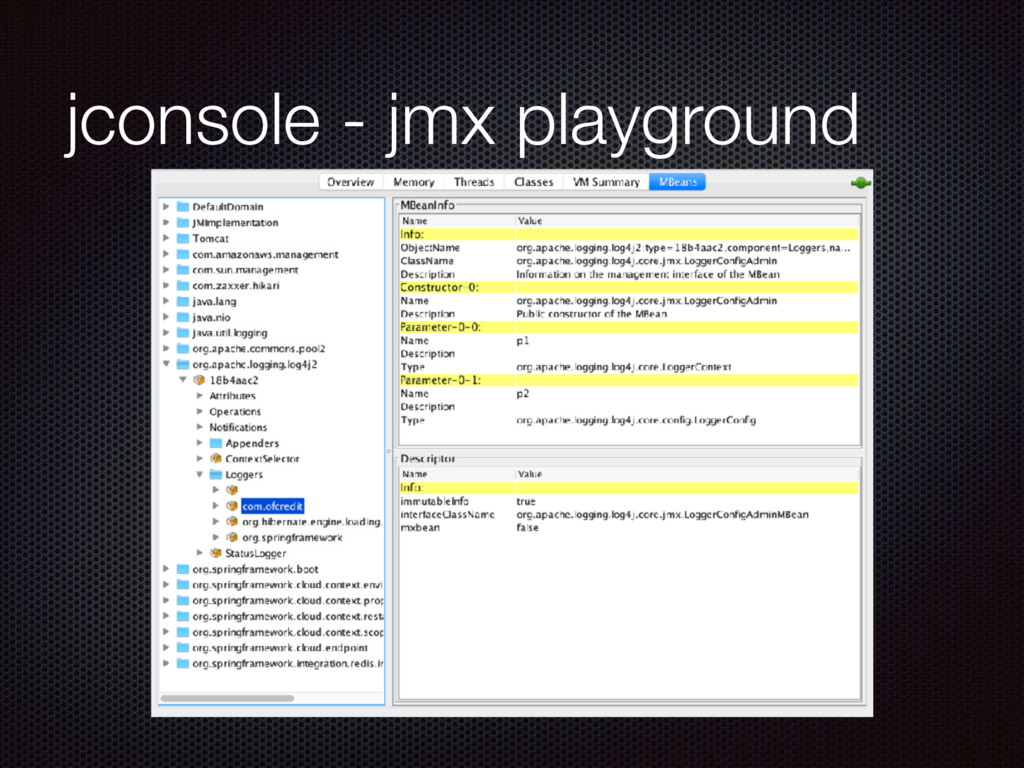
jconsole - jmx playground
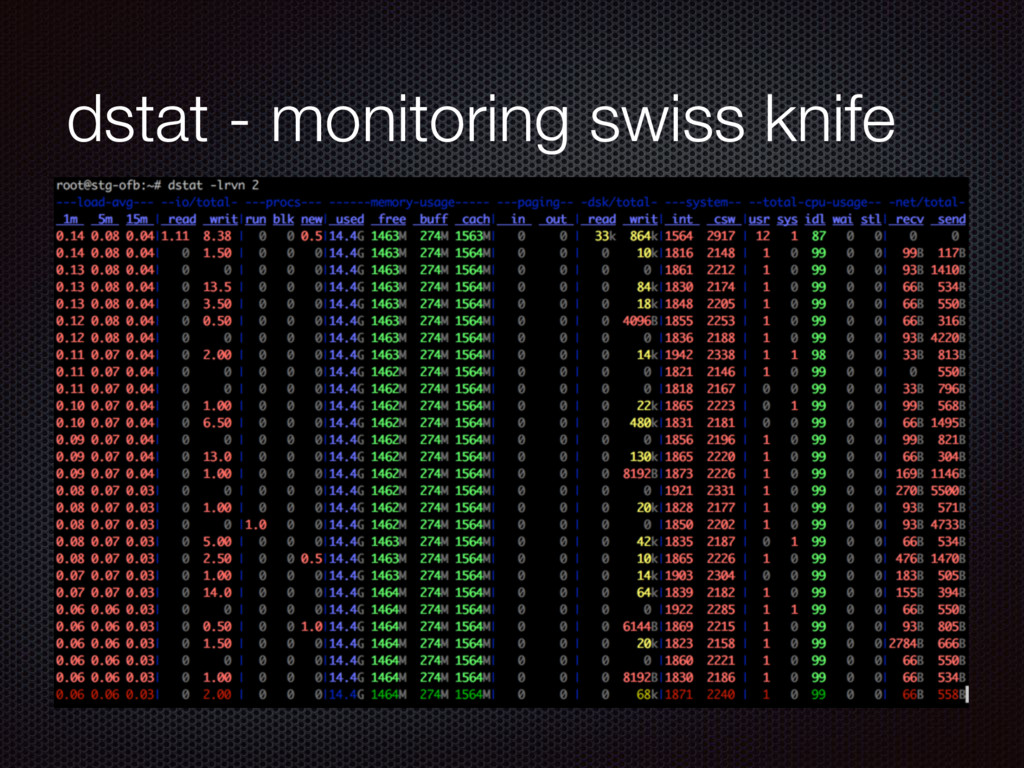
dstat - monitoring swiss knife
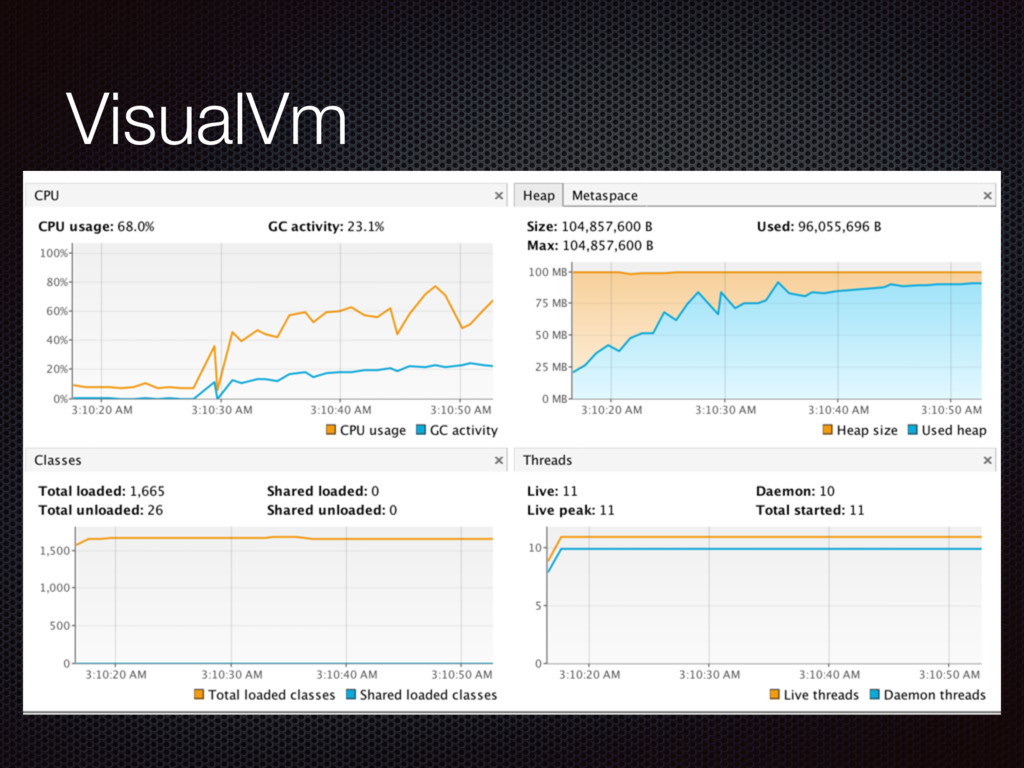
VisualVm
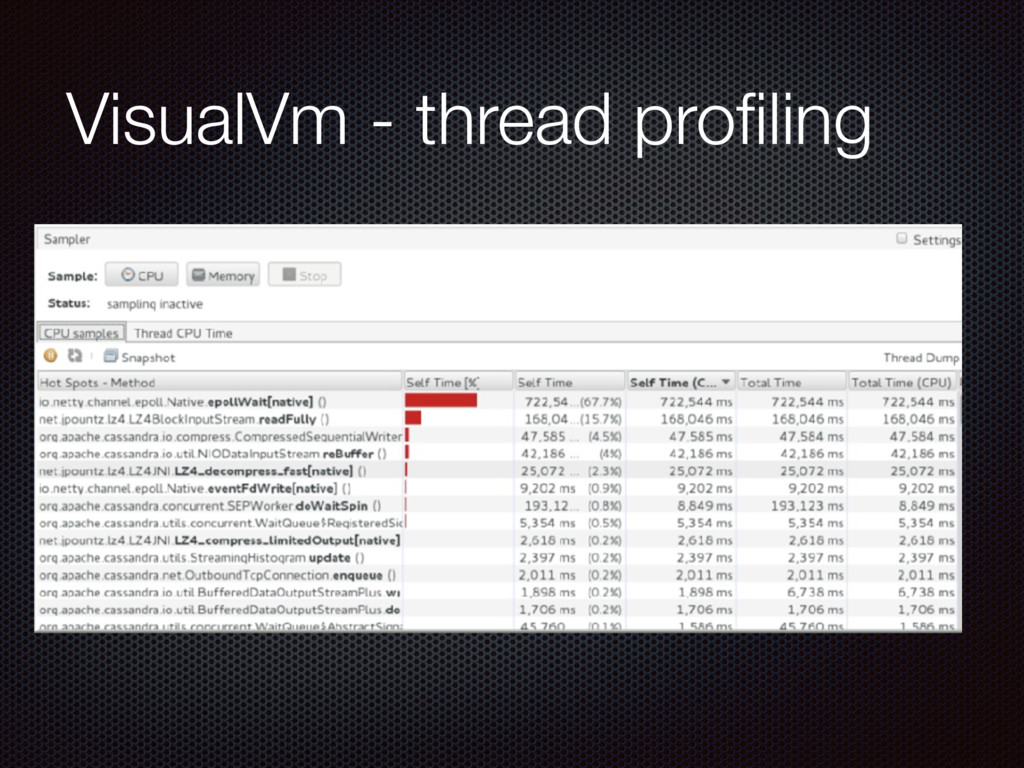
VisualVm - thread profiling
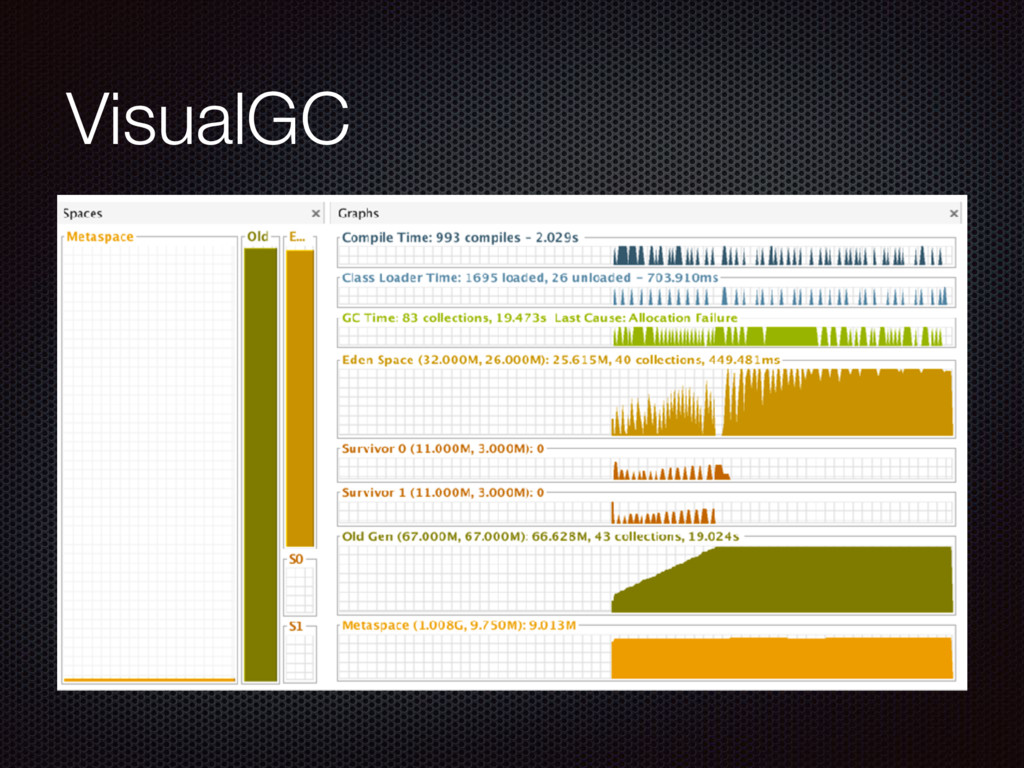
VisualGC
Demo Normal new gen demo Normal new+oldgen demo OOM demo
Sample with locking Demo of deadlock
Thank you!