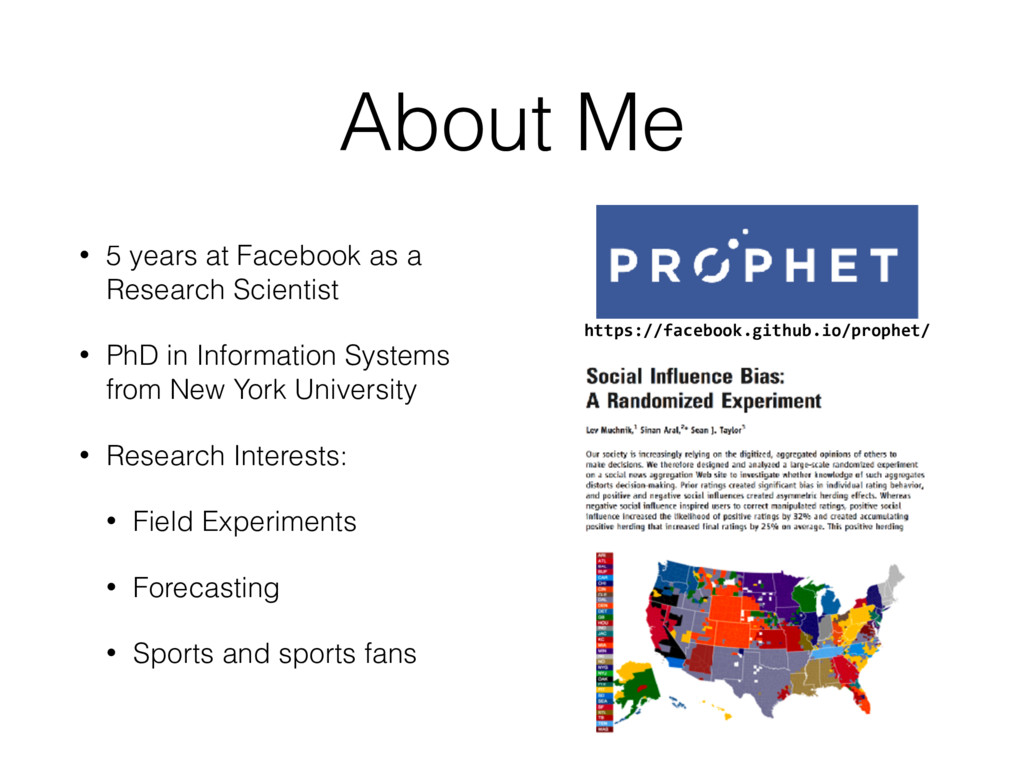
Scientist • PhD in Information Systems from New York University • Research Interests: • Field Experiments • Forecasting • Sports and sports fans https://facebook.github.io/prophet/
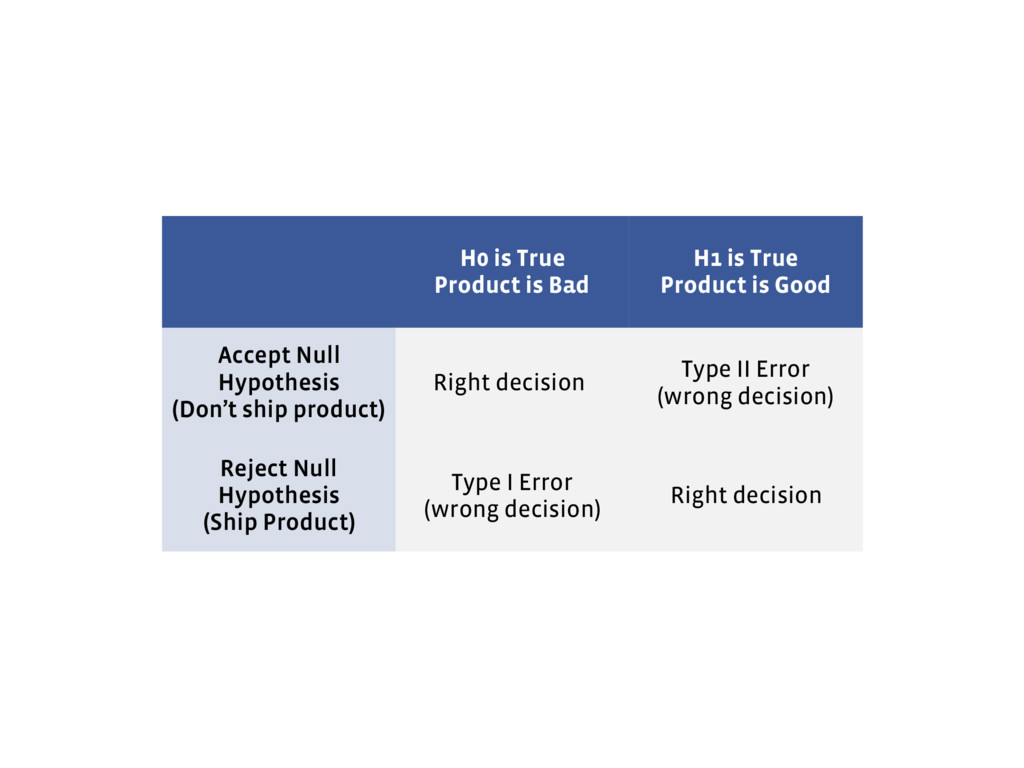
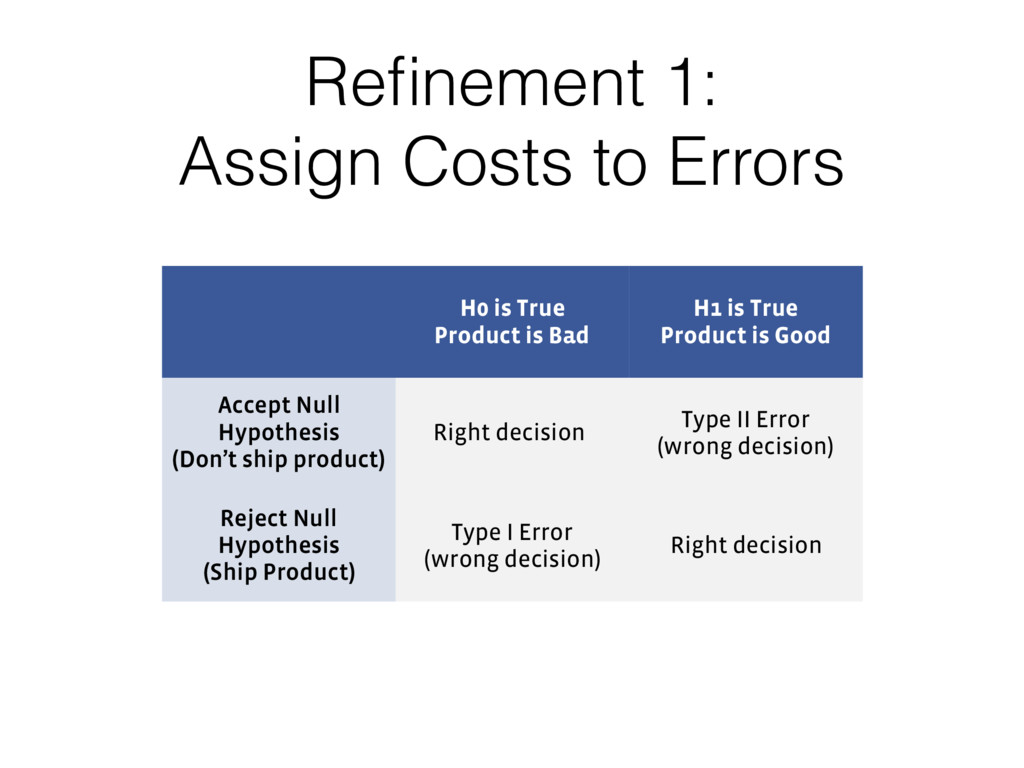
is Good Accept Null Hypothesis (Don’t ship product) Right decision Type II Error (wrong decision) Reject Null Hypothesis (Ship Product) Type I Error (wrong decision) Right decision
is Bad H1 is True Product is Good Accept Null Hypothesis (Don’t ship product) Right decision Type II Error (wrong decision) Reject Null Hypothesis (Ship Product) Type I Error (wrong decision) Right decision
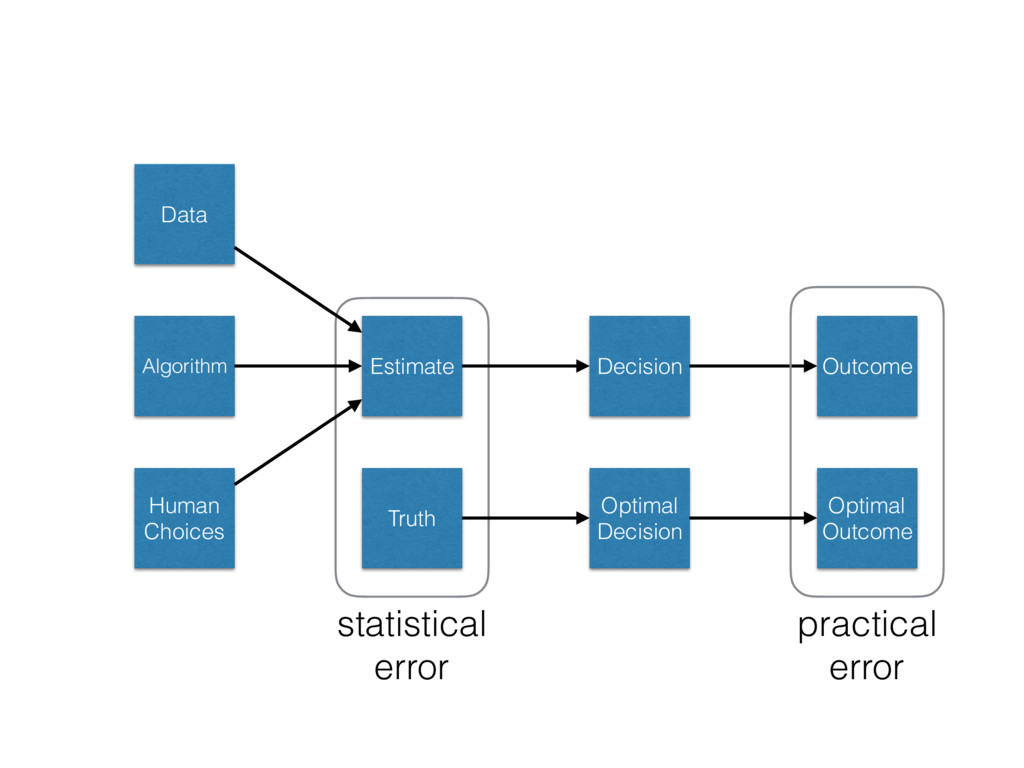
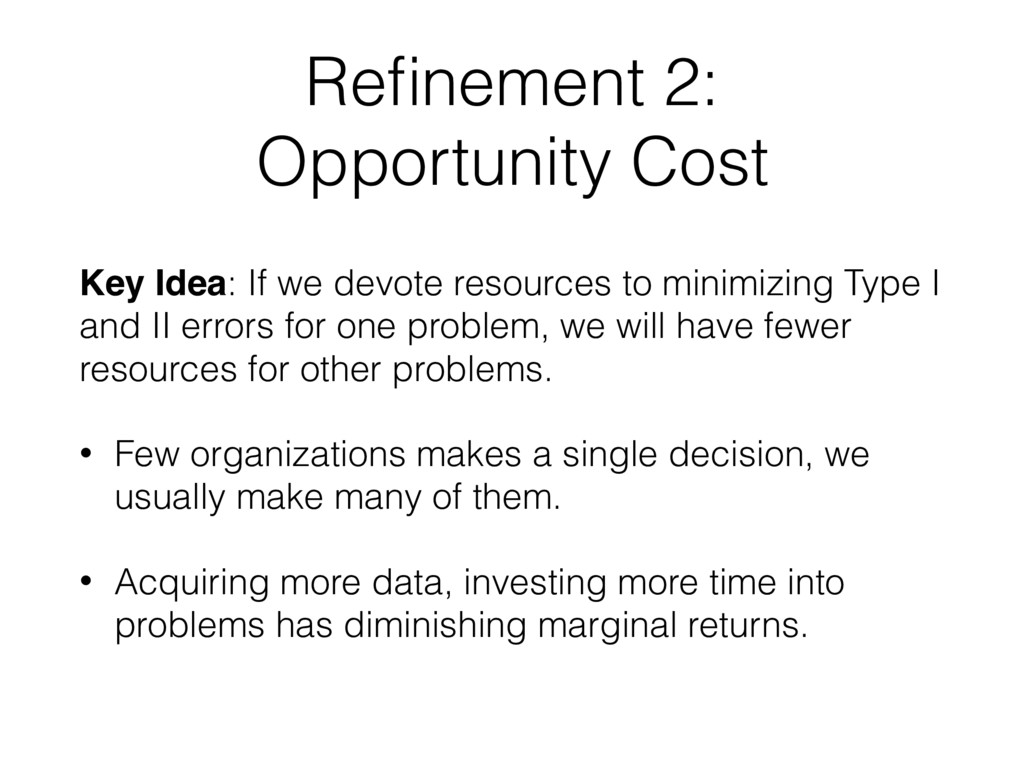
to minimizing Type I and II errors for one problem, we will have fewer resources for other problems. • Few organizations makes a single decision, we usually make many of them. • Acquiring more data, investing more time into problems has diminishing marginal returns.
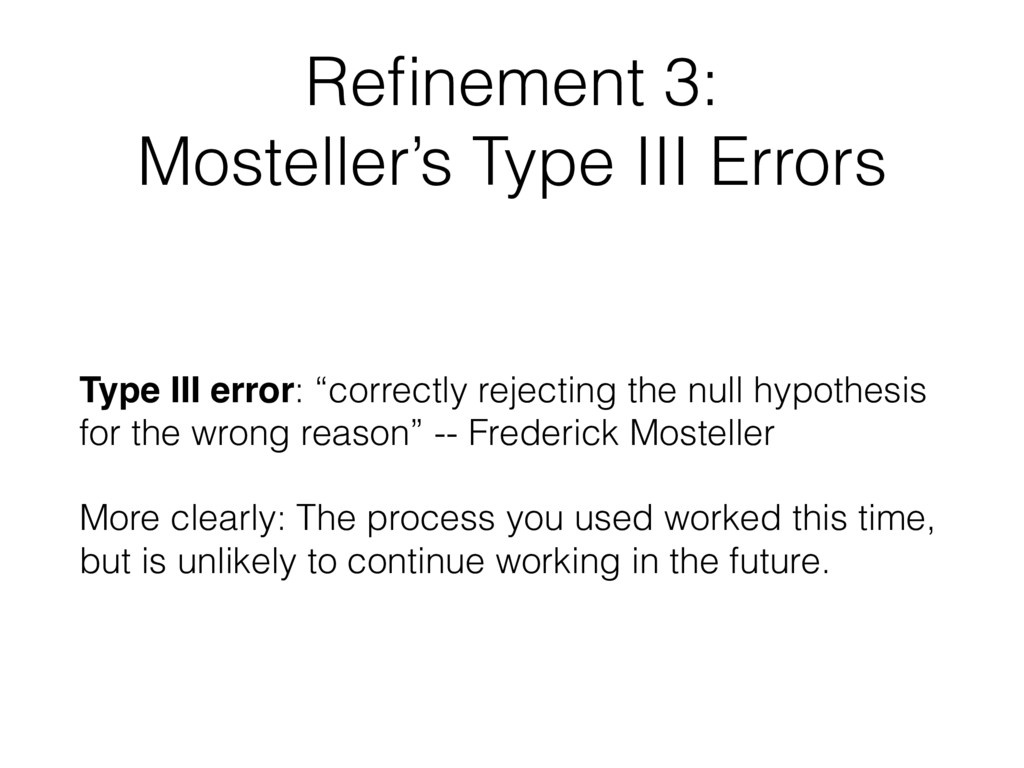
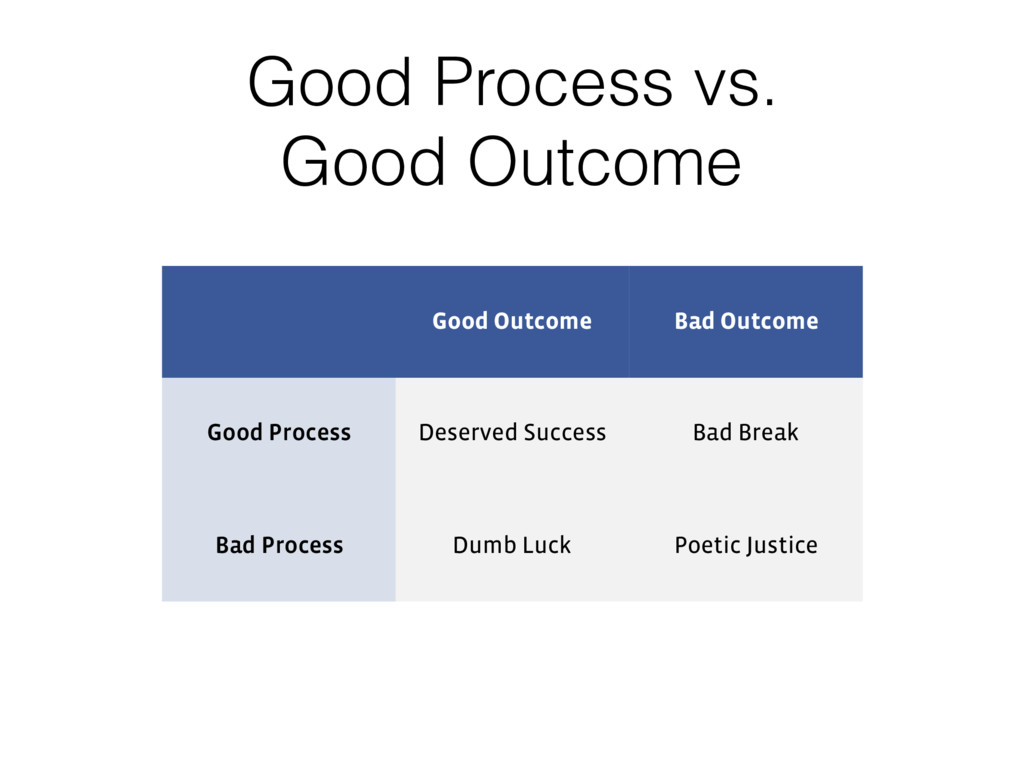
“correctly rejecting the null hypothesis for the wrong reason” -- Frederick Mosteller More clearly: The process you used worked this time, but is unlikely to continue working in the future.
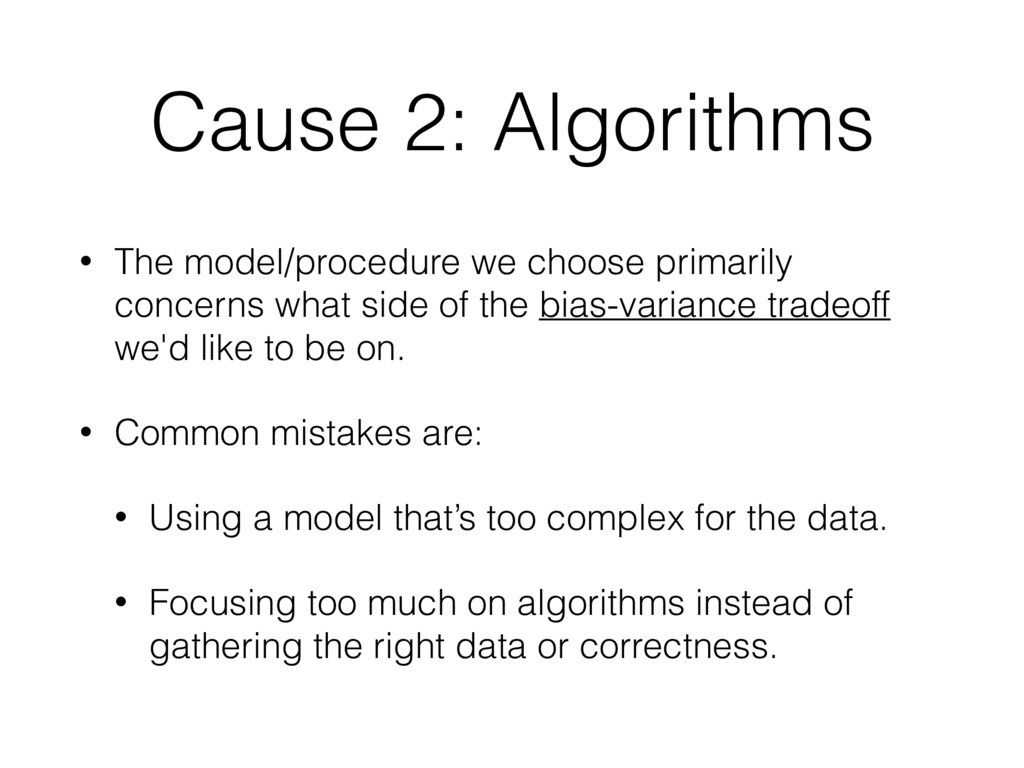
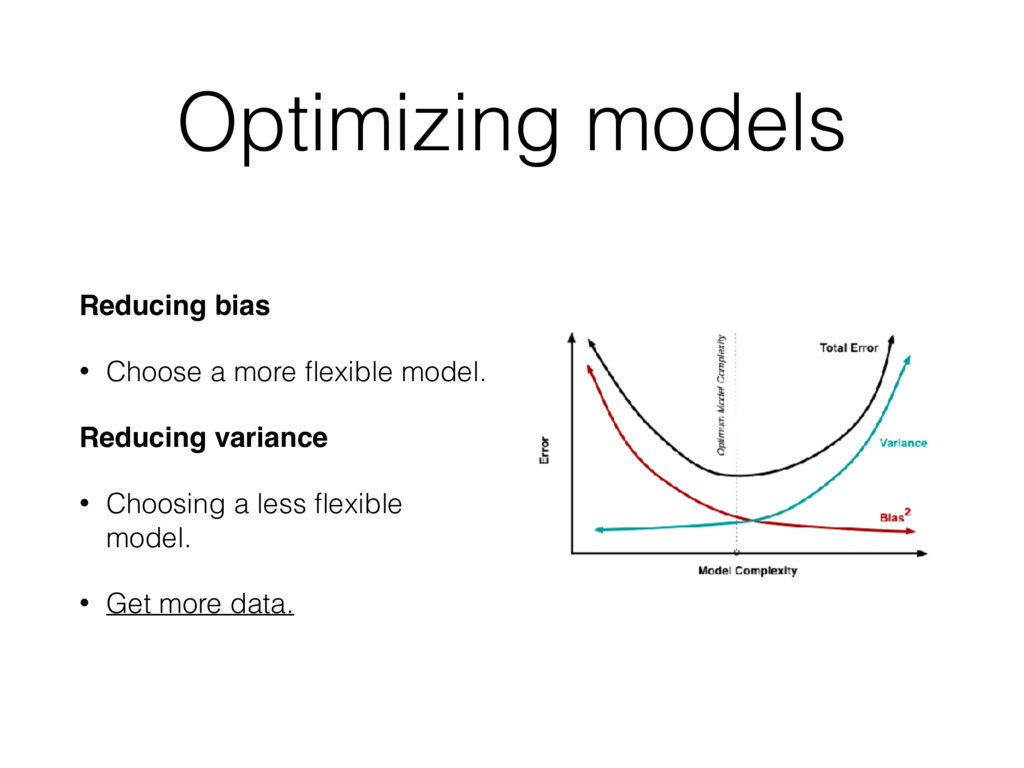
what side of the bias-variance tradeoff we'd like to be on. • Common mistakes are: • Using a model that’s too complex for the data. • Focusing too much on algorithms instead of gathering the right data or correctness.
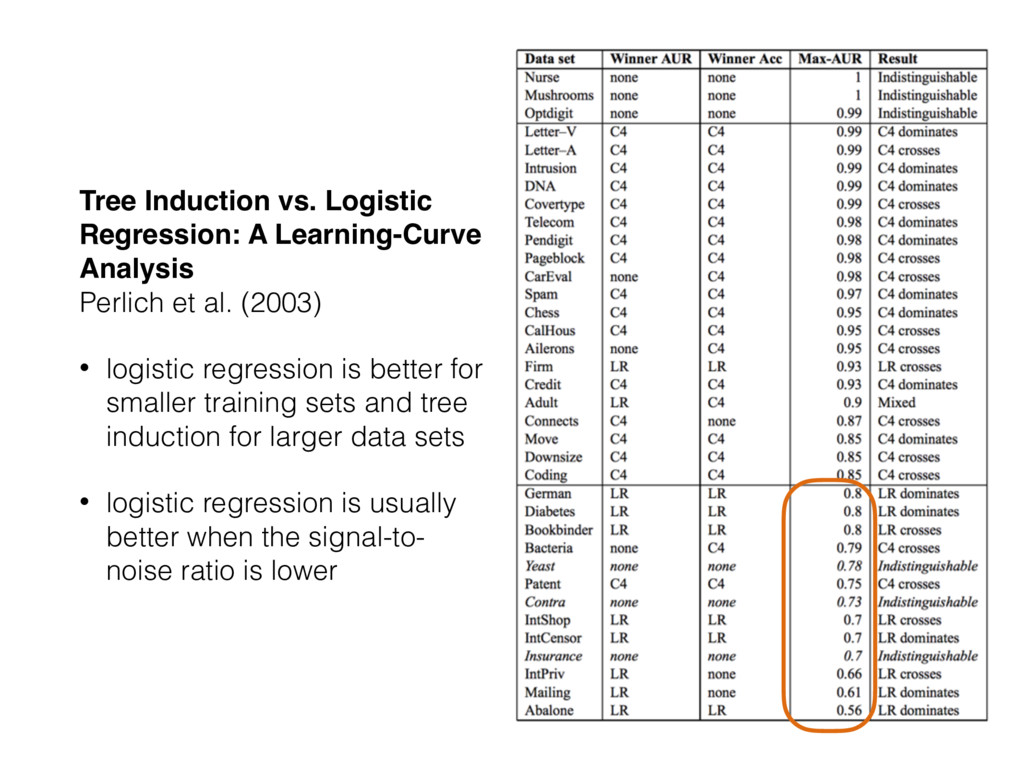
al. (2003) • logistic regression is better for smaller training sets and tree induction for larger data sets • logistic regression is usually better when the signal-to- noise ratio is lower
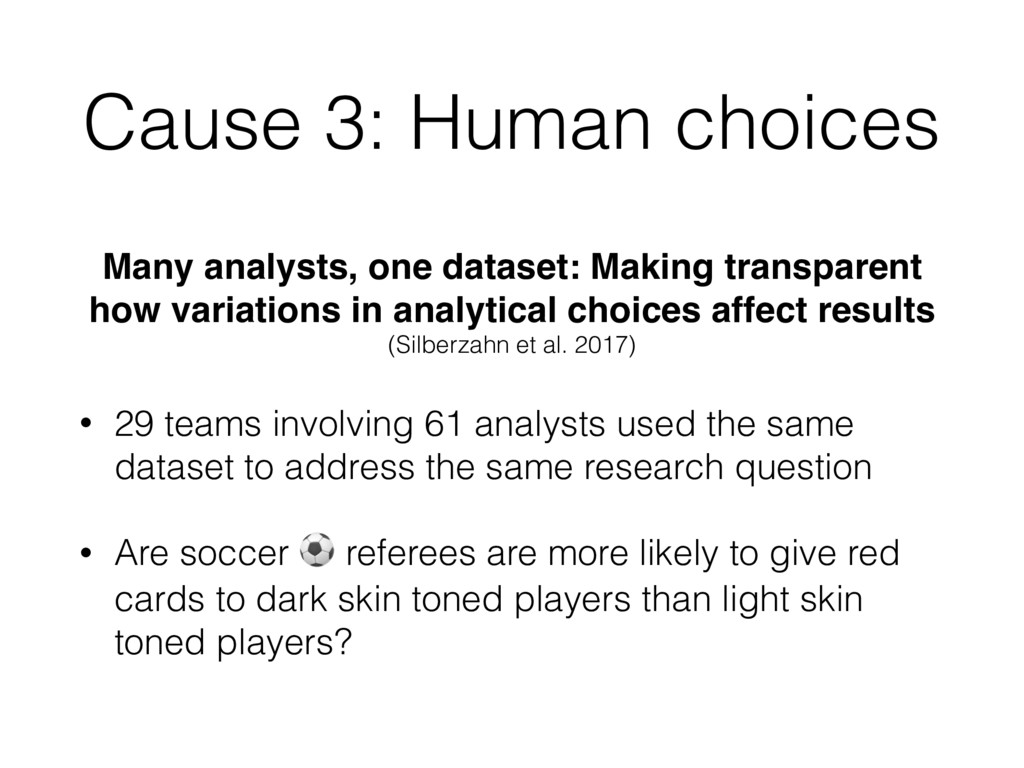
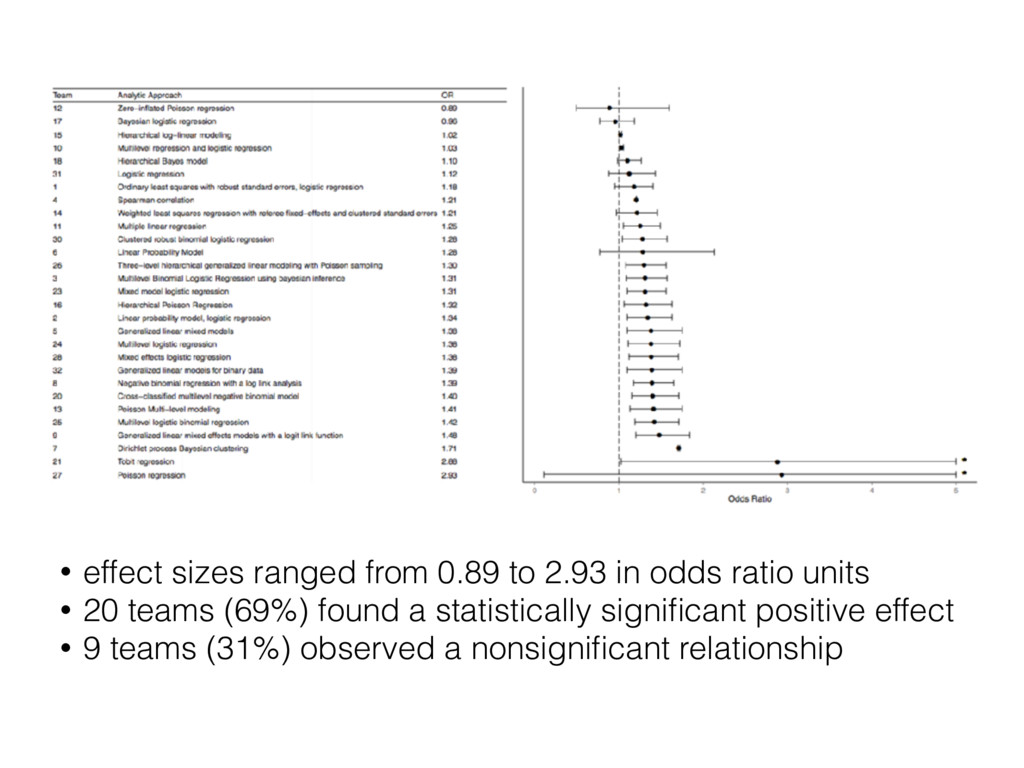
how variations in analytical choices affect results (Silberzahn et al. 2017) • 29 teams involving 61 analysts used the same dataset to address the same research question • Are soccer ⚽ referees are more likely to give red cards to dark skin toned players than light skin toned players?
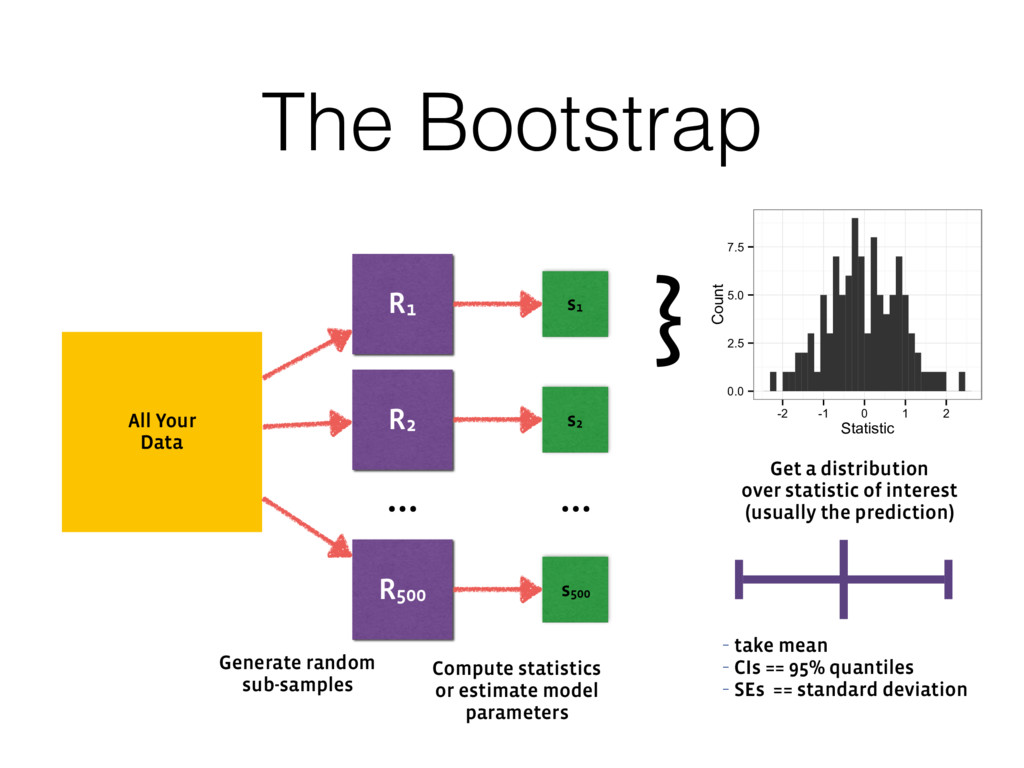
random sub-samples s1 s2 s500 Compute statistics or estimate model parameters … } 0.0 2.5 5.0 7.5 -2 -1 0 1 2 Statistic Count Get a distribution over statistic of interest (usually the prediction) - take mean - CIs == 95% quantiles - SEs == standard deviation
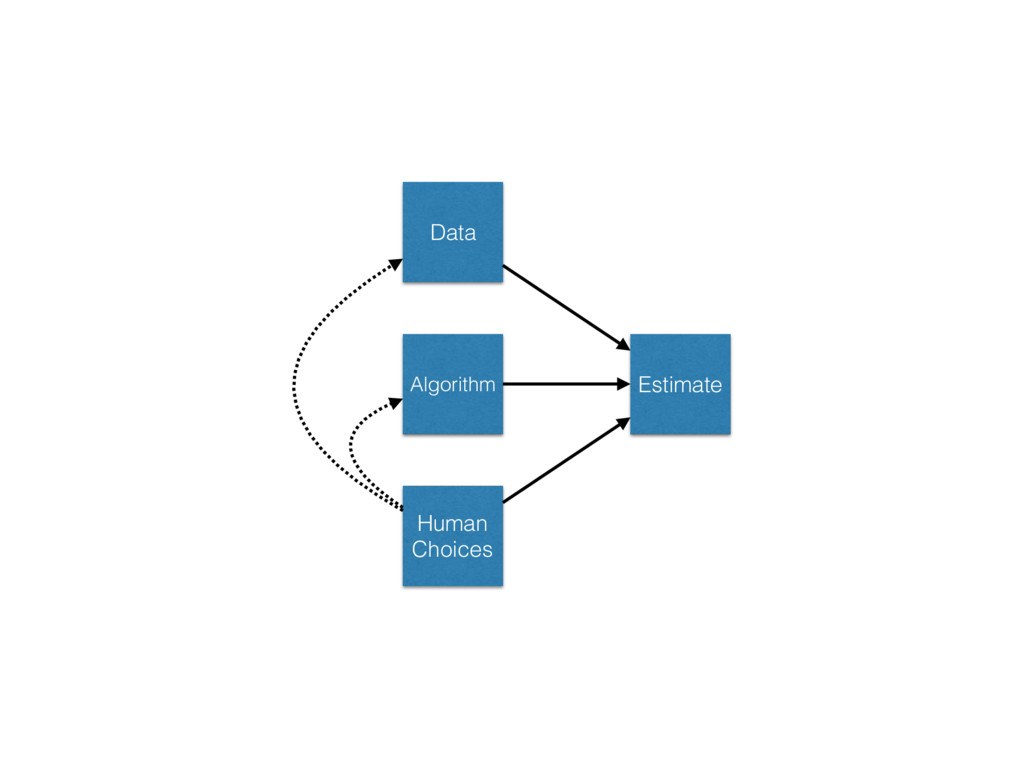
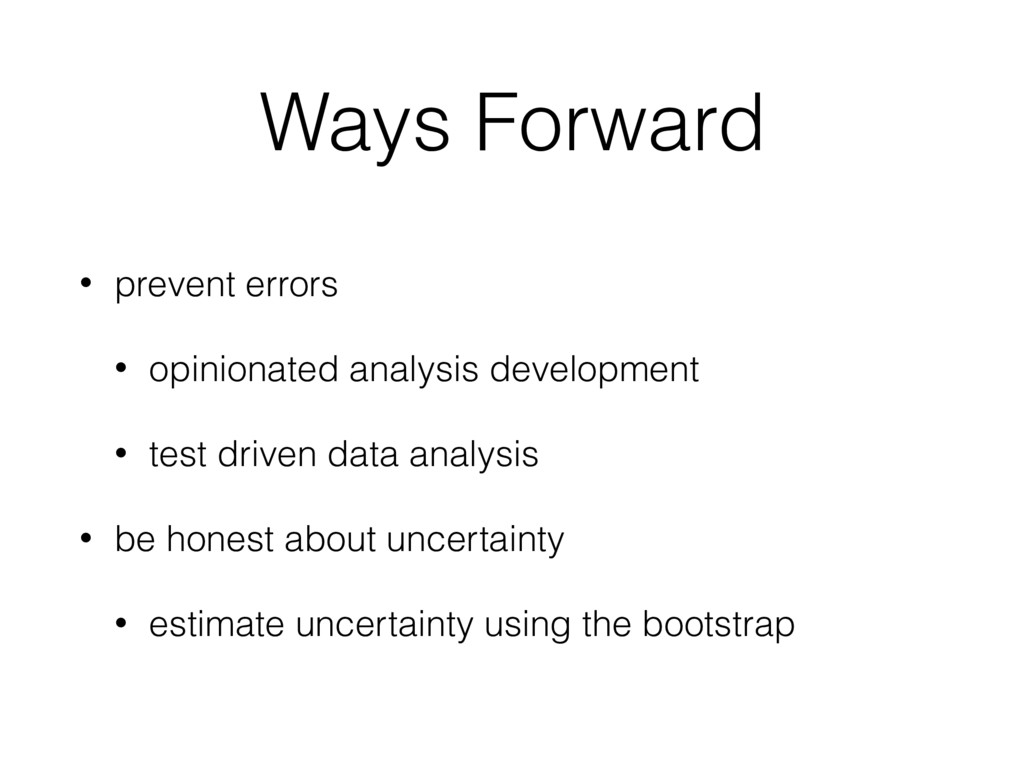
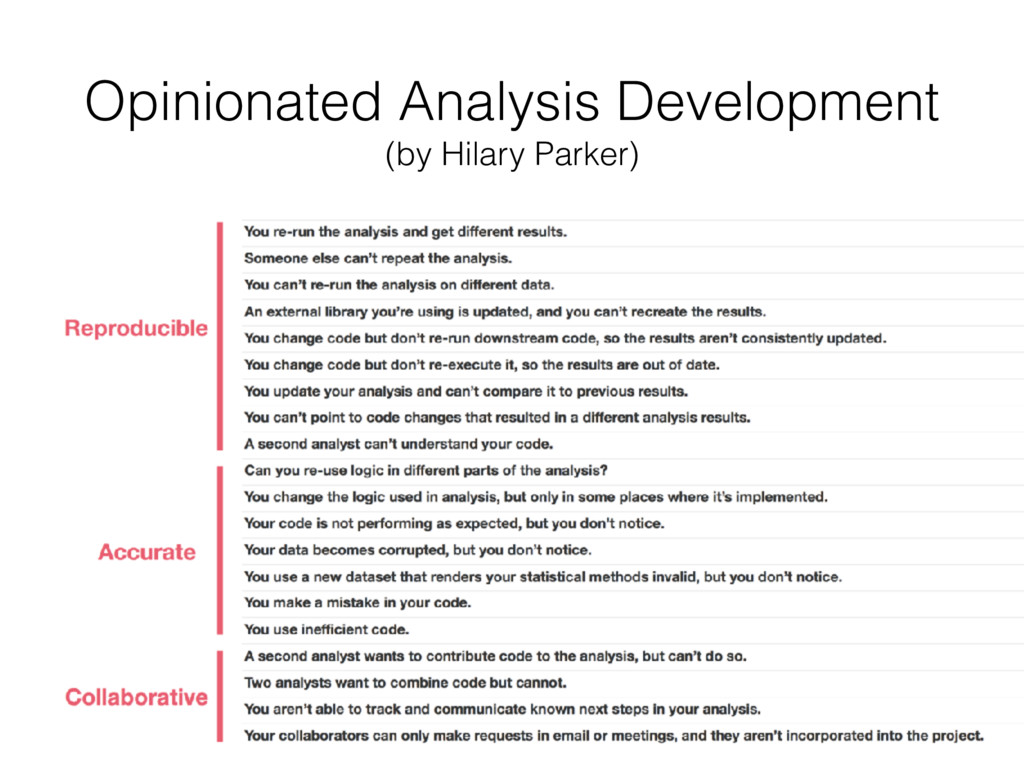
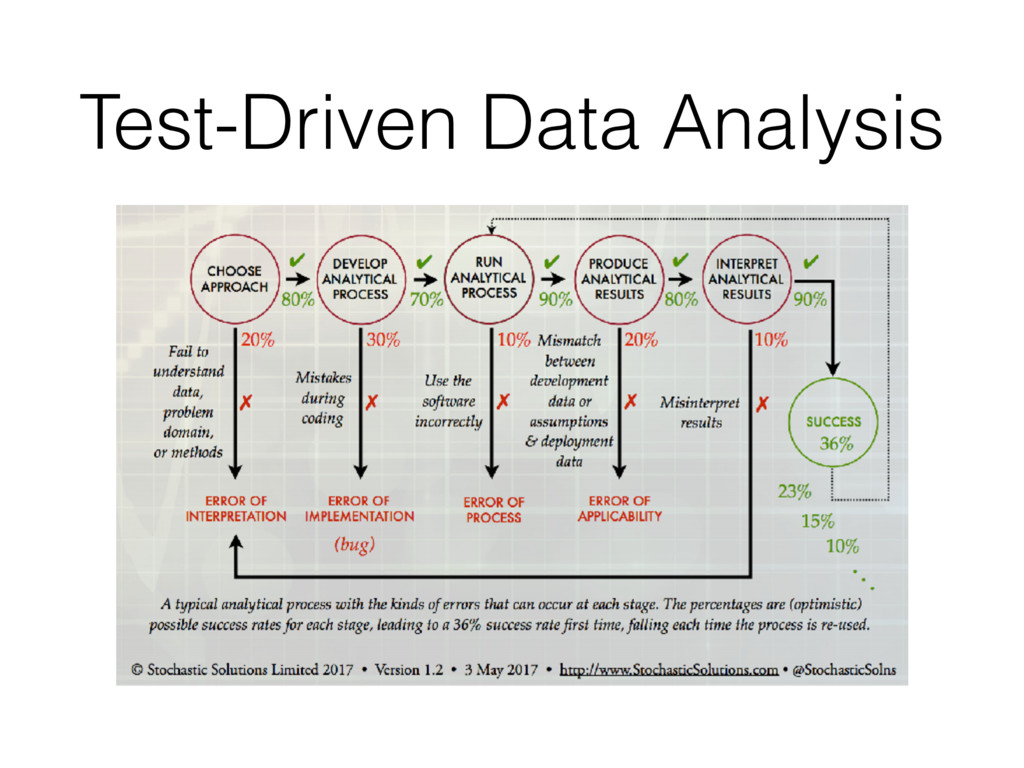
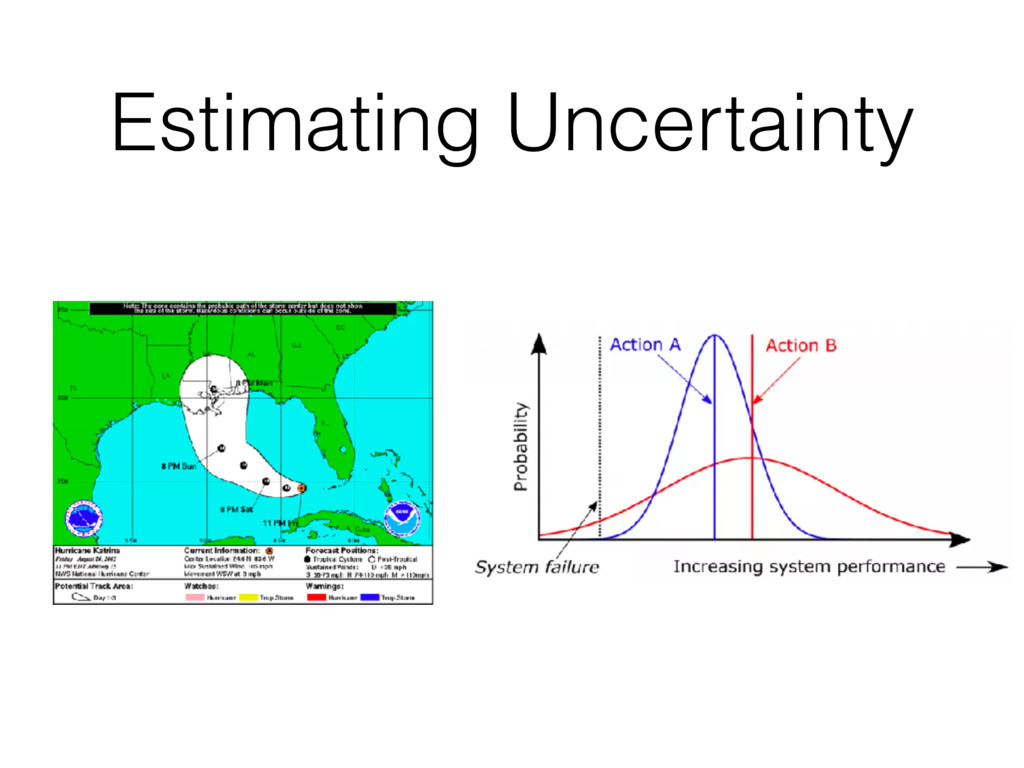
we making? • Where did the come from? Prevent errors! • Use a reasonable and reproducible process. • Test your analysis as you test your code. Estimate uncertainty! • Models that estimate uncertainty are more useful than those that don’t. • They facilitate better learning and experimentation.