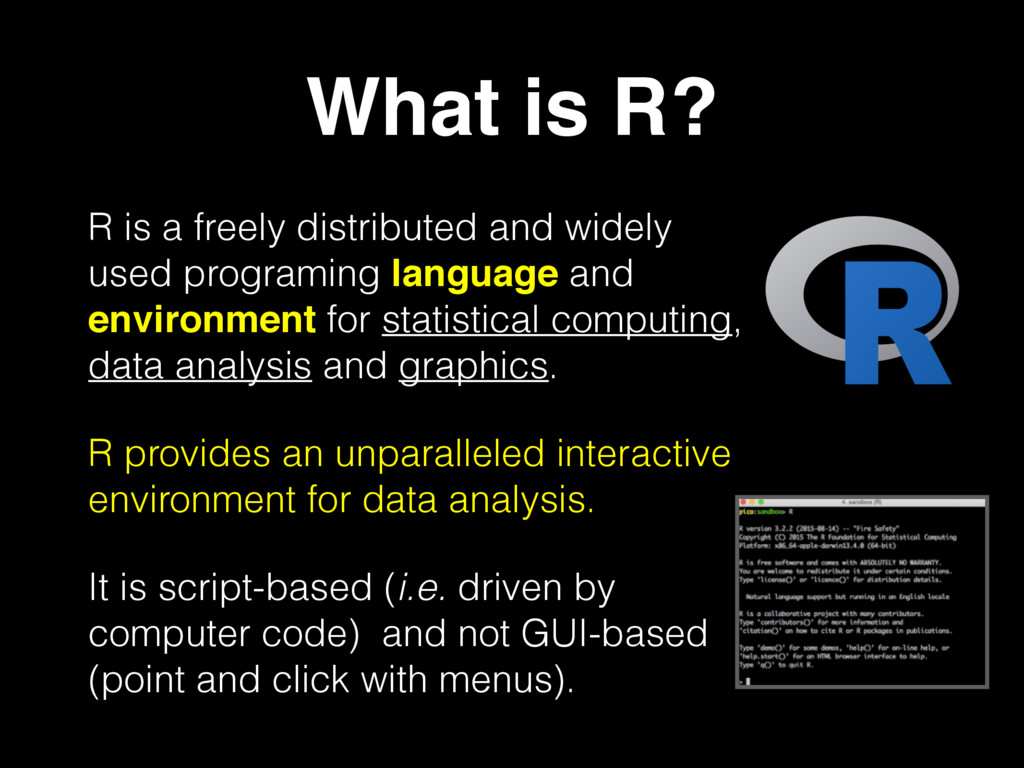
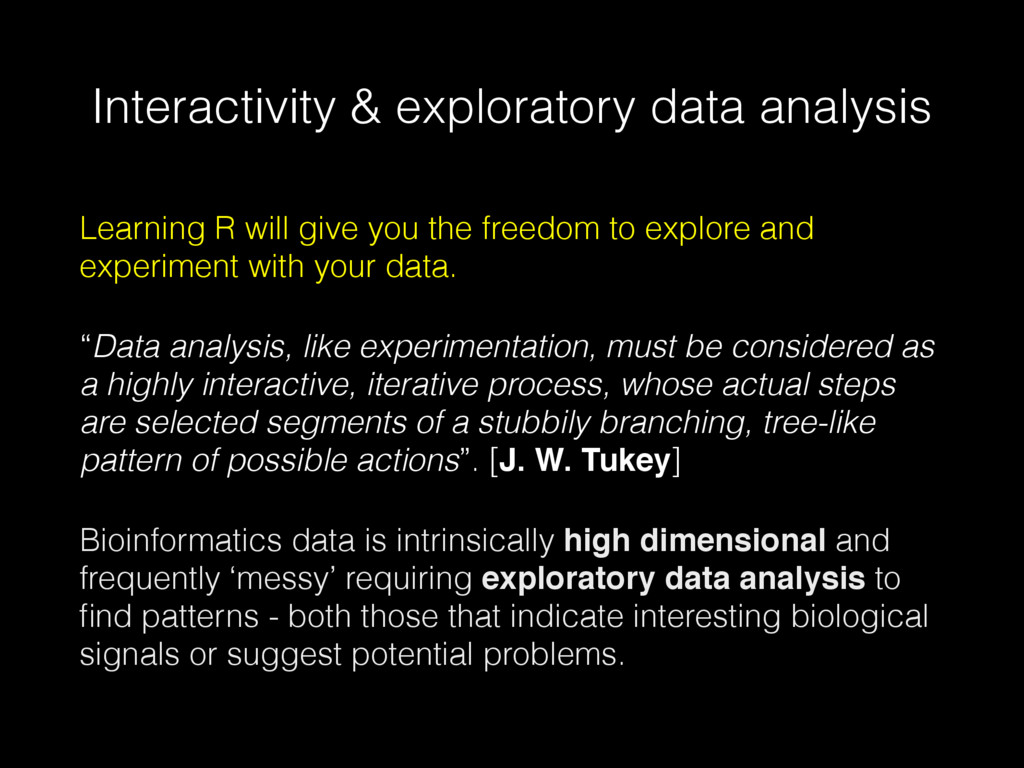
R is powerful data programming language and environment for statistical computing, data analysis and graphics. R is typically used to explore and understand data in an open-ended, highly interactive, iterative way. Learning R will give you the freedom to experiment and problem solve during data analysis — exactly what we need as bioinformaticians and data scientists. Here we cover:
- What is R?
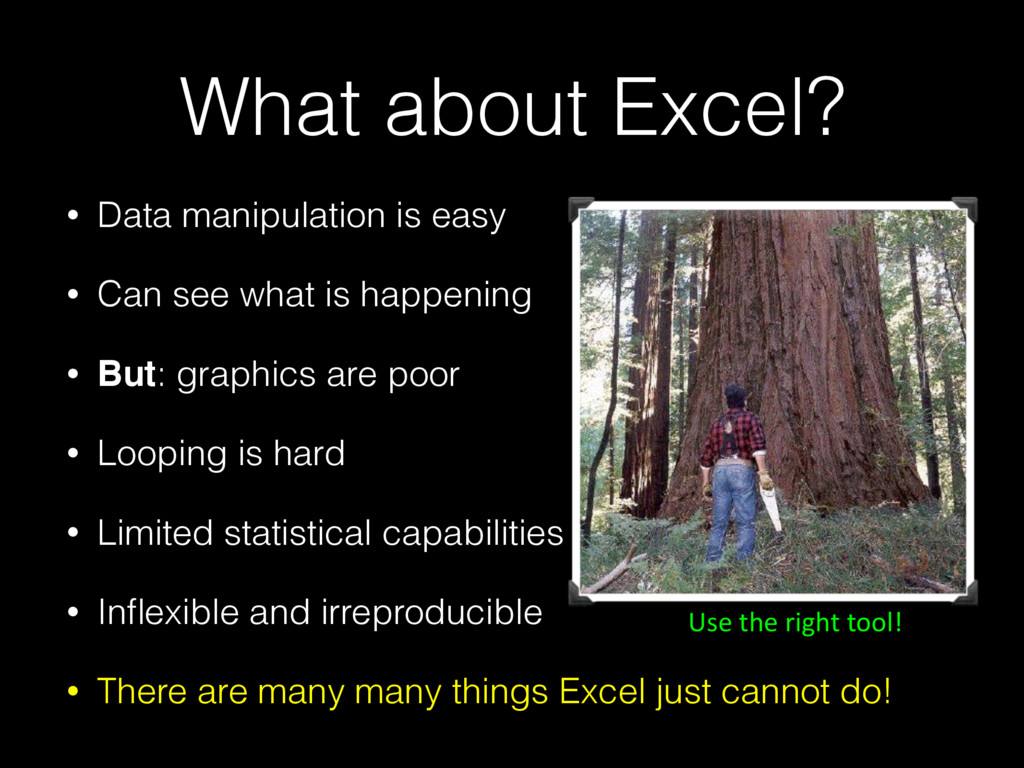
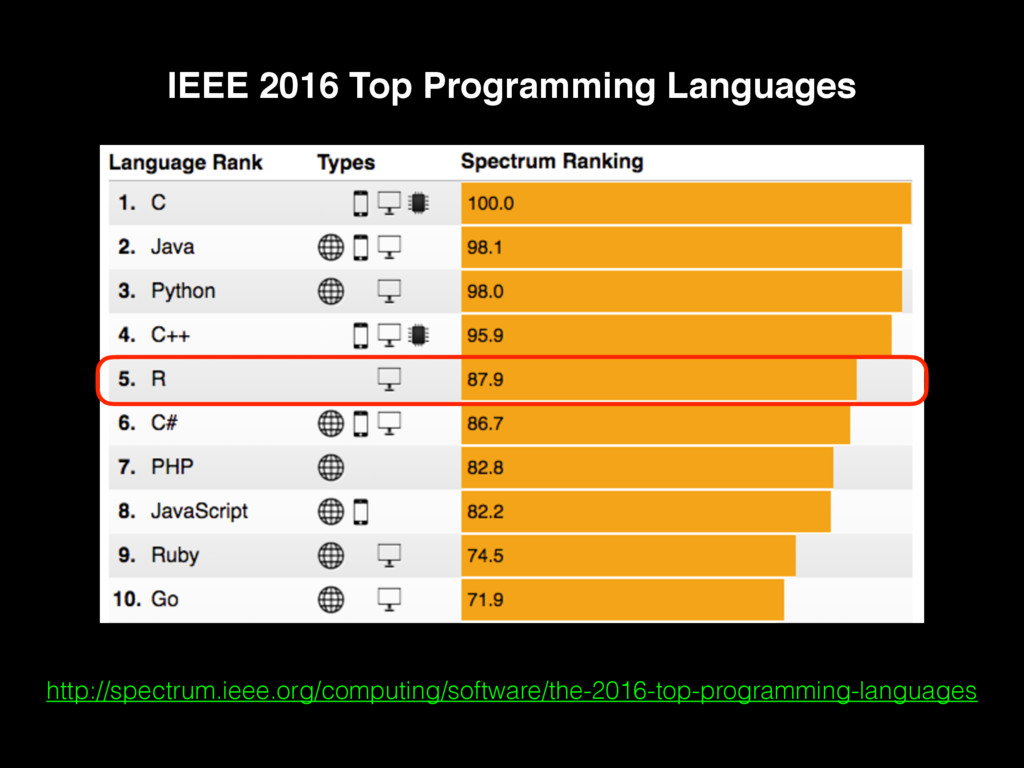
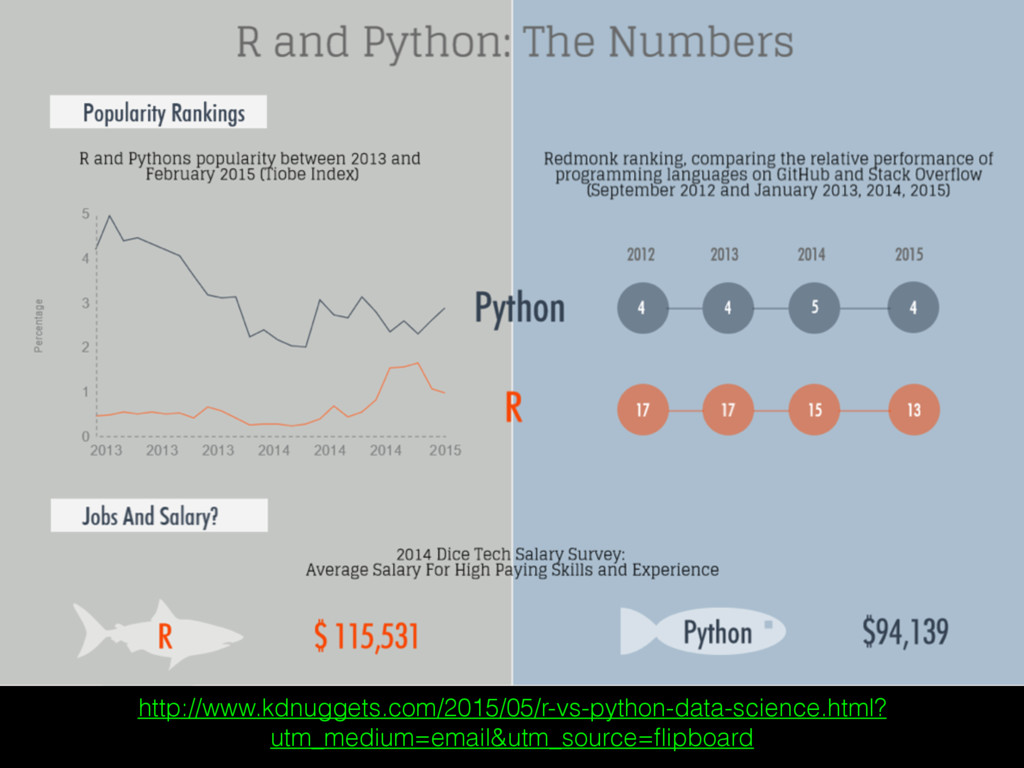
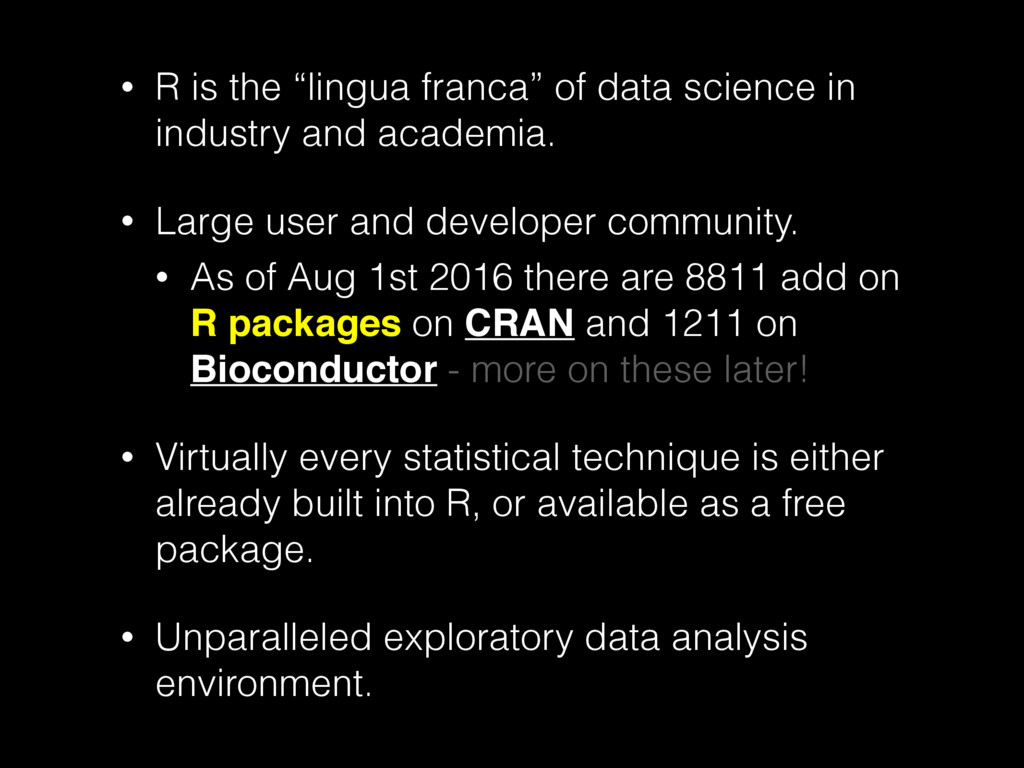
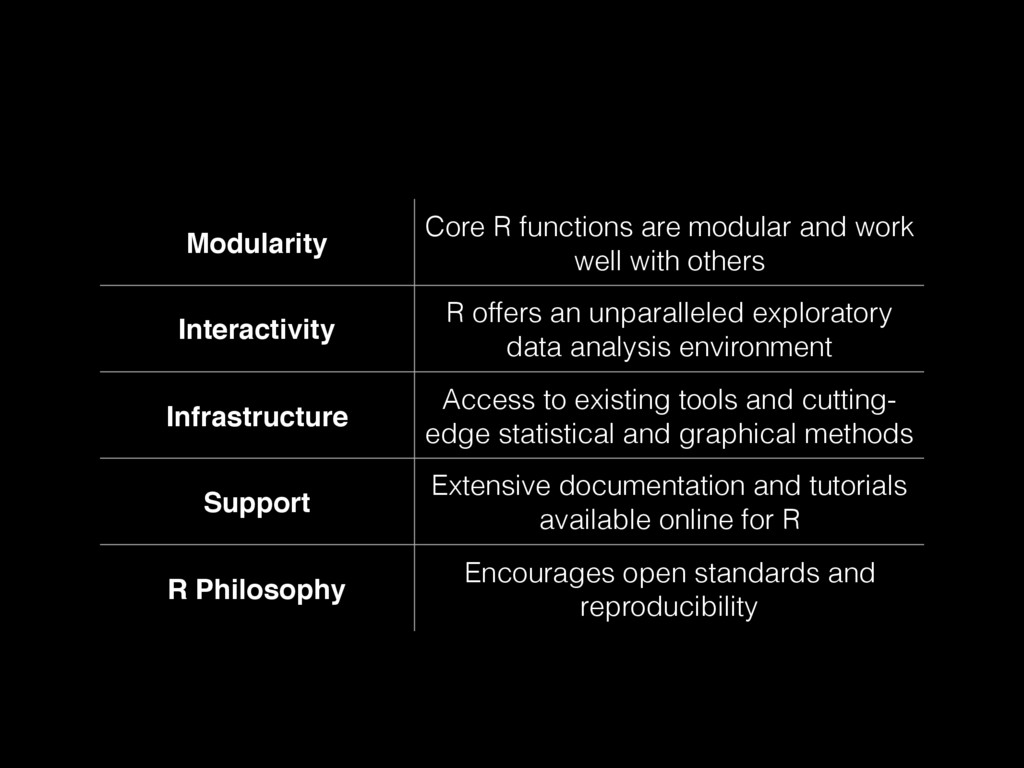
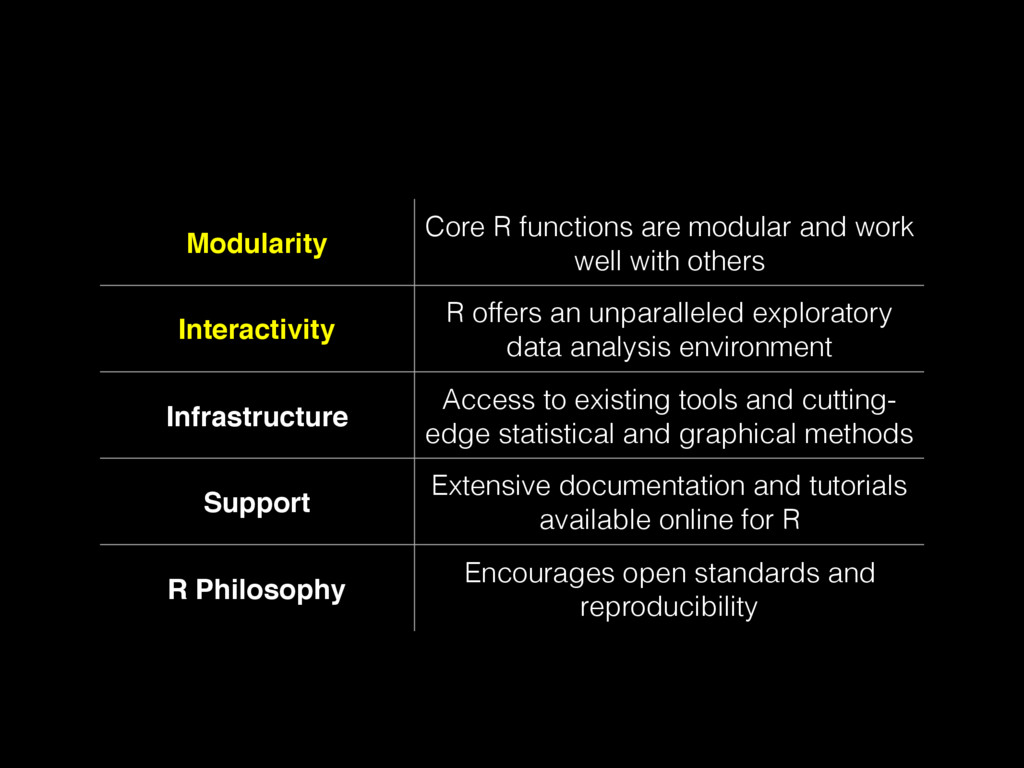
- Motivation: Why use R?
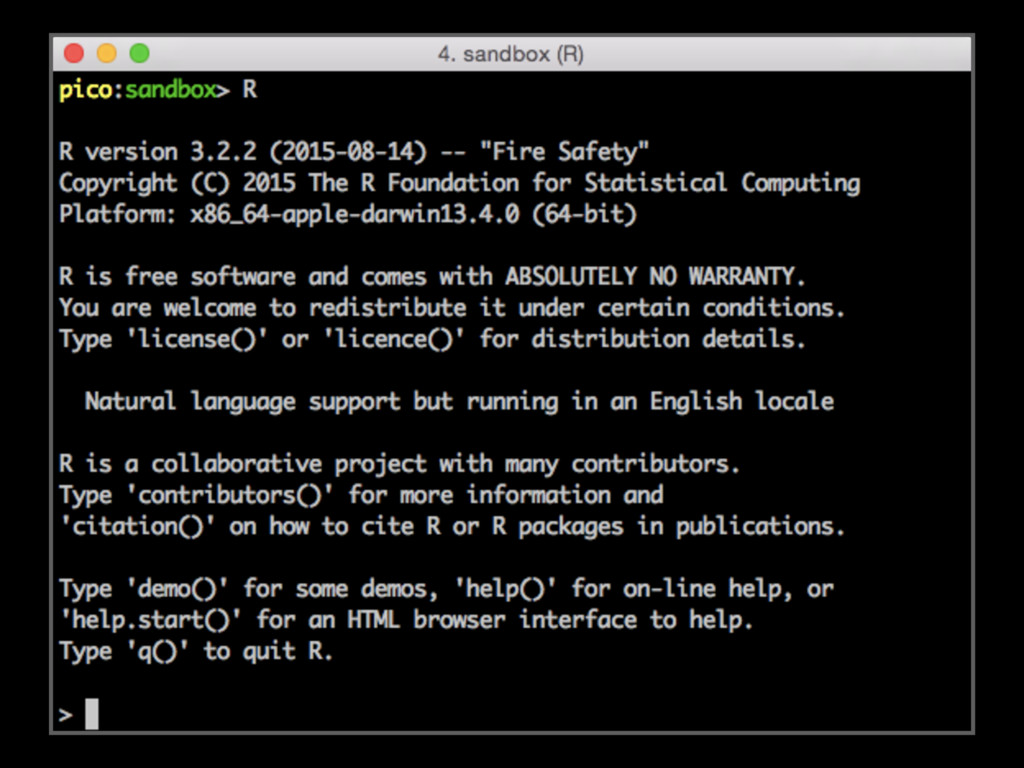
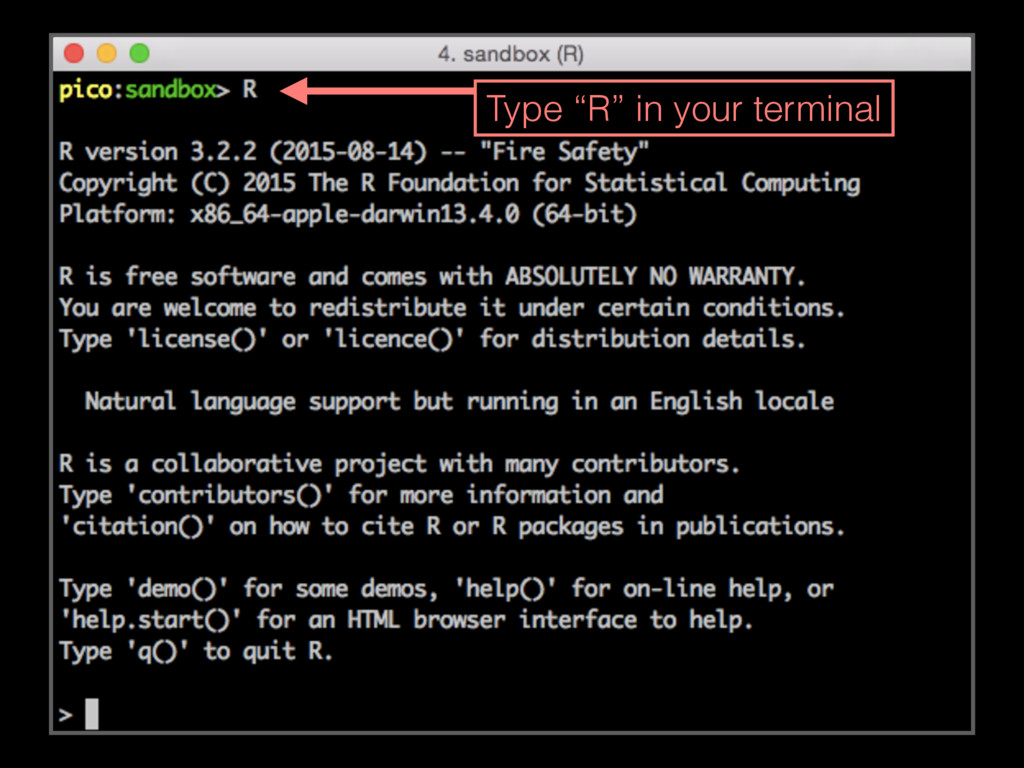
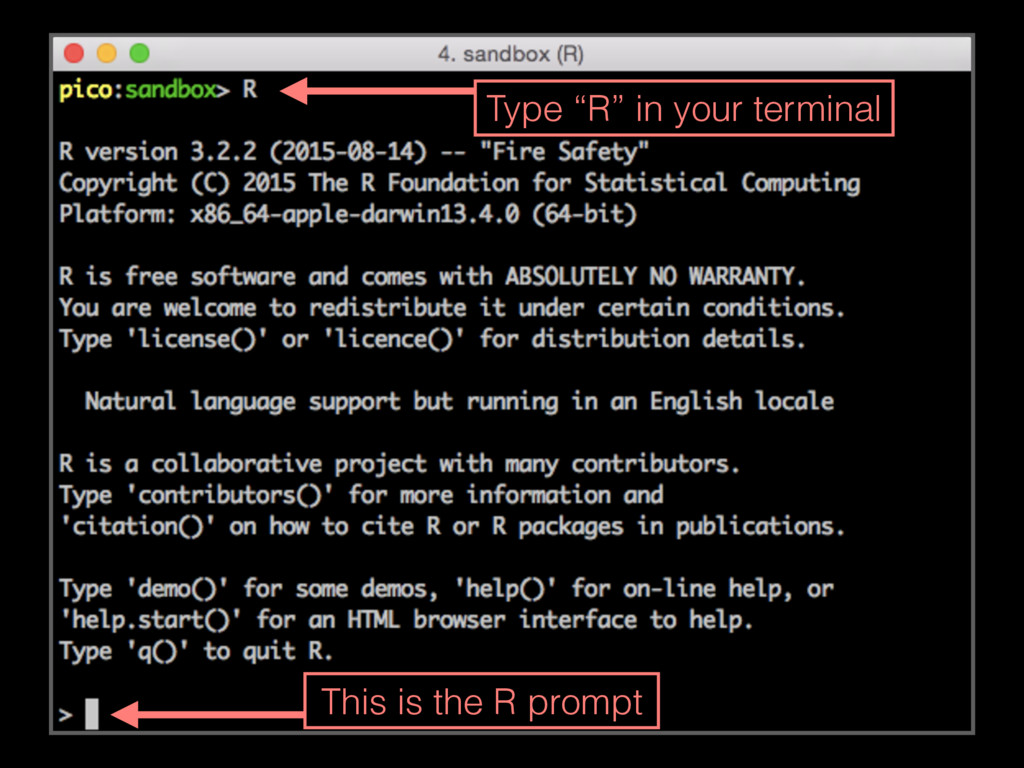
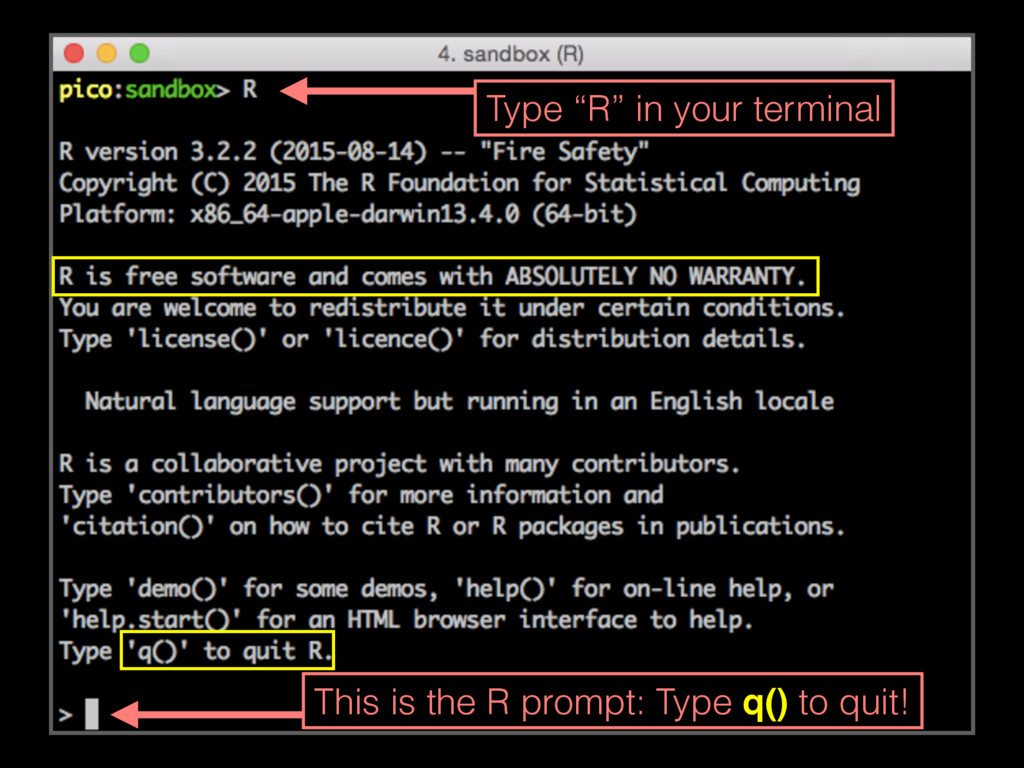
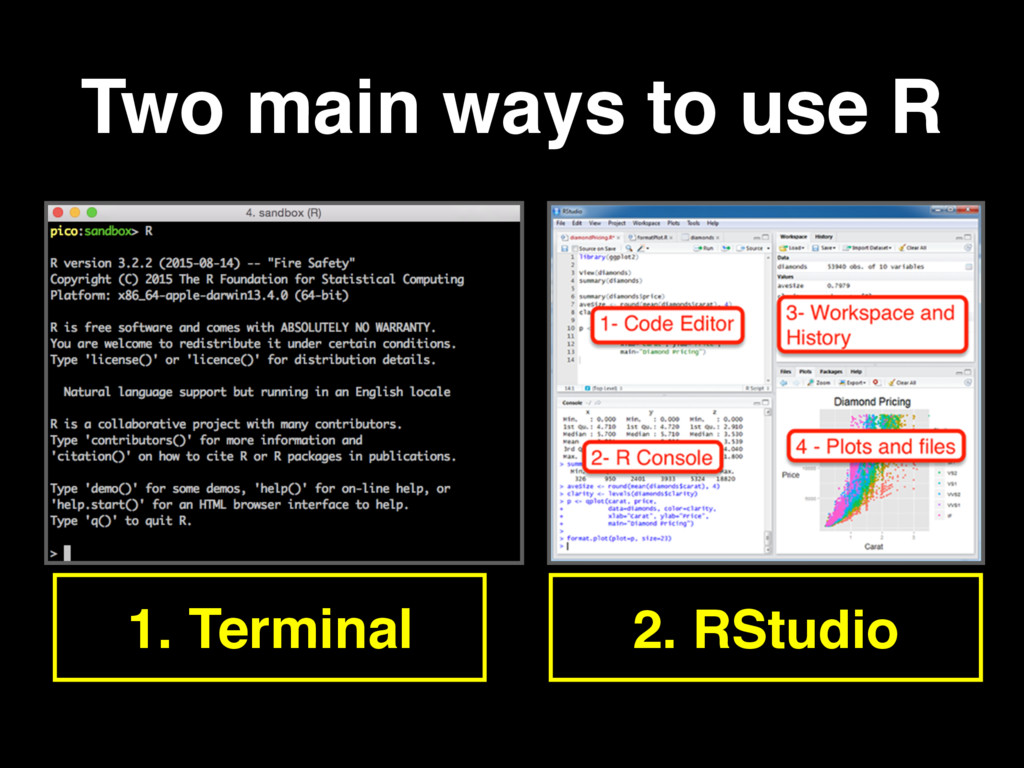
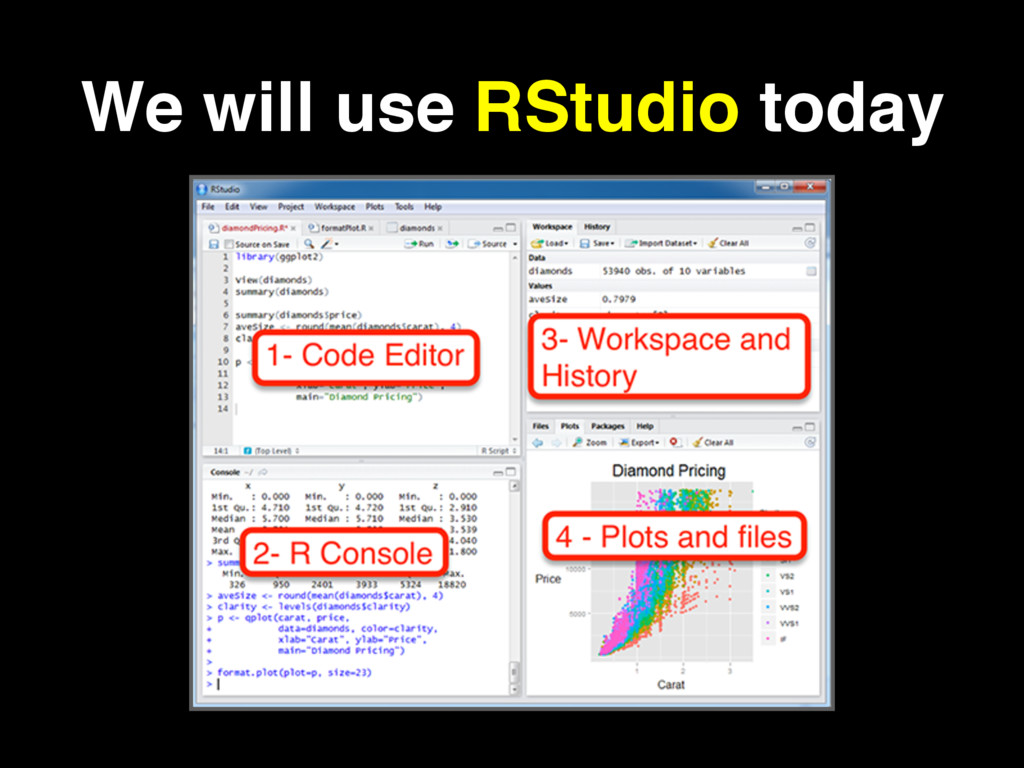
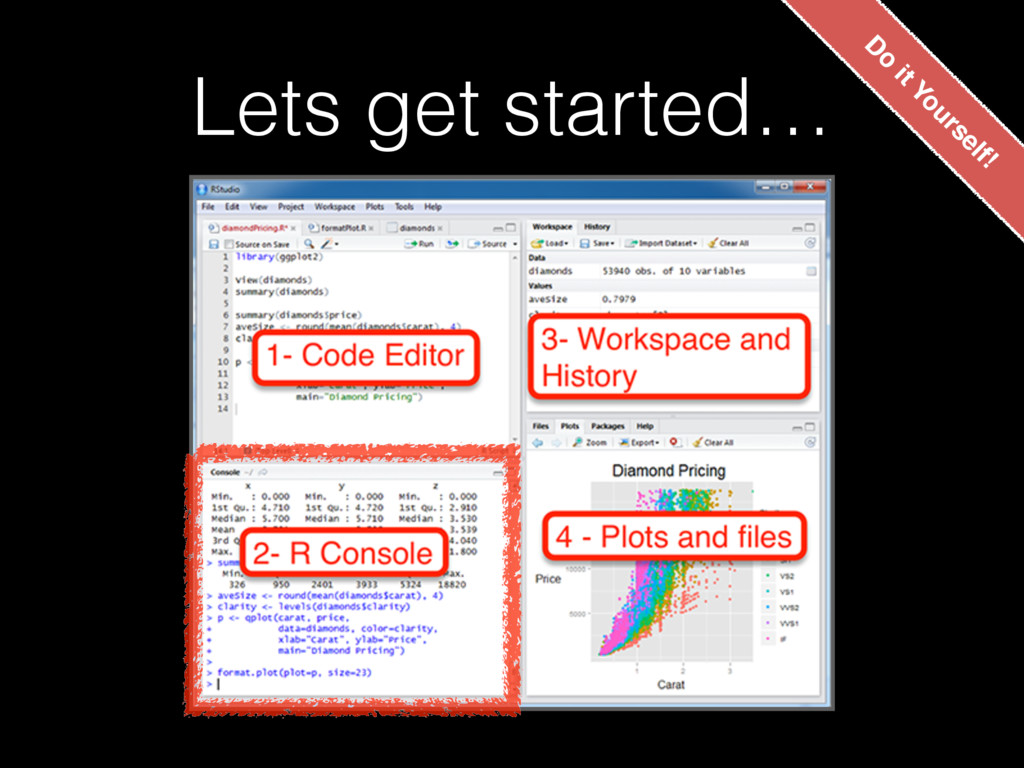
- Getting started with R and the RStudio IDE (integrated development environment).
- Using R.
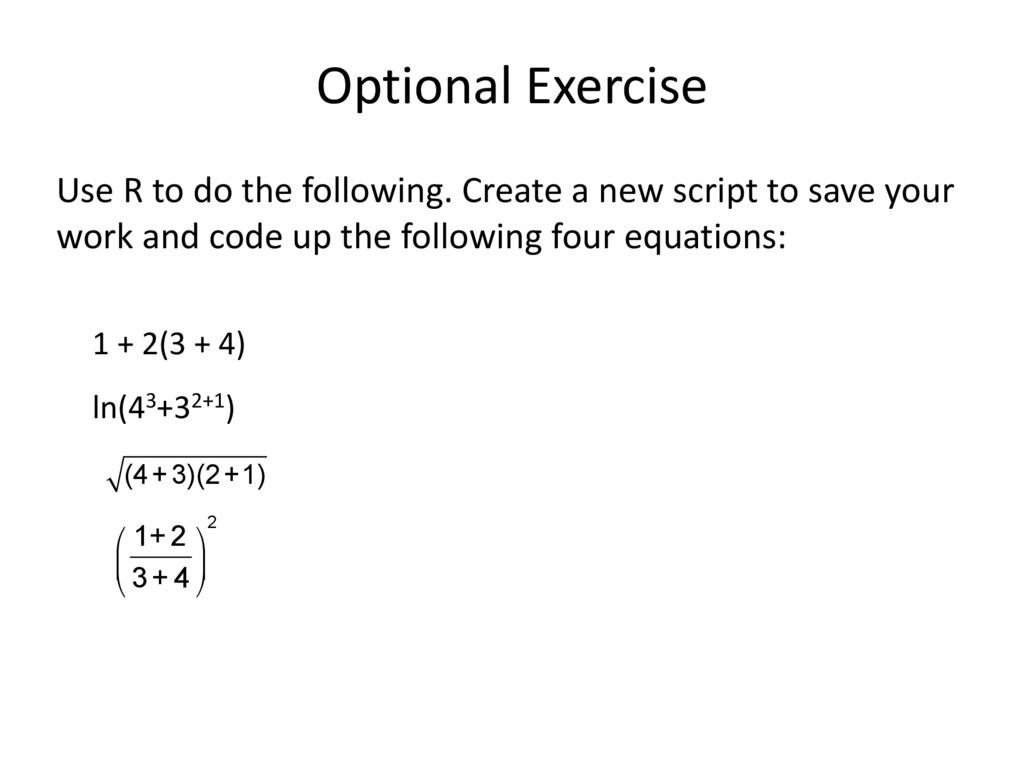
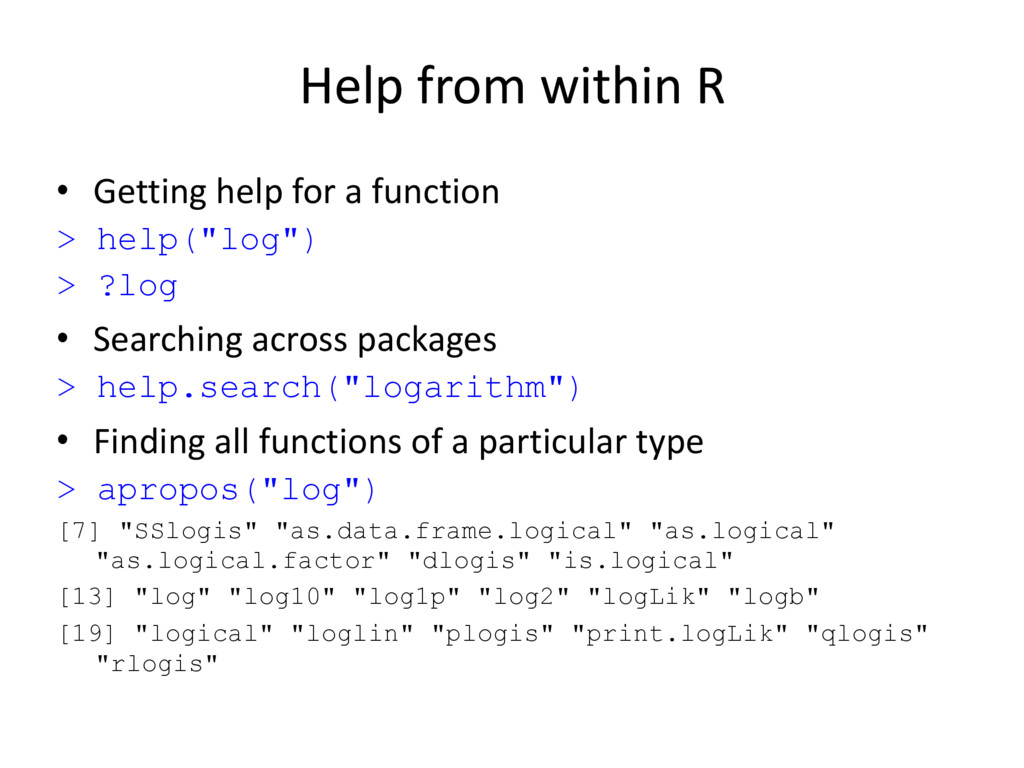
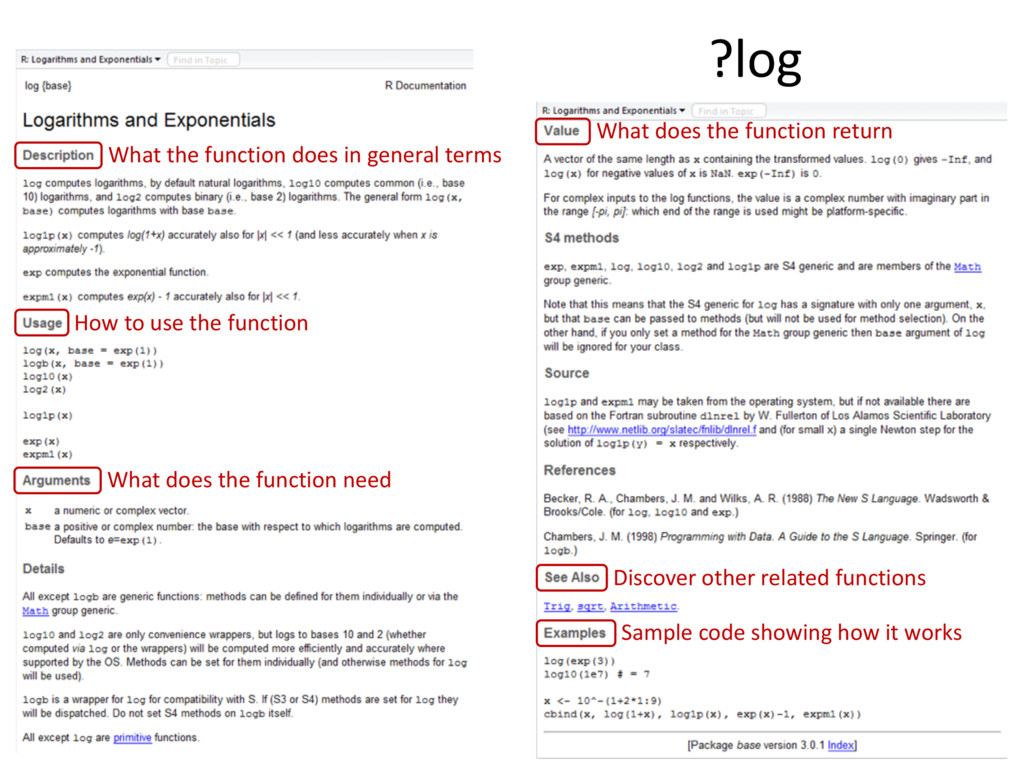
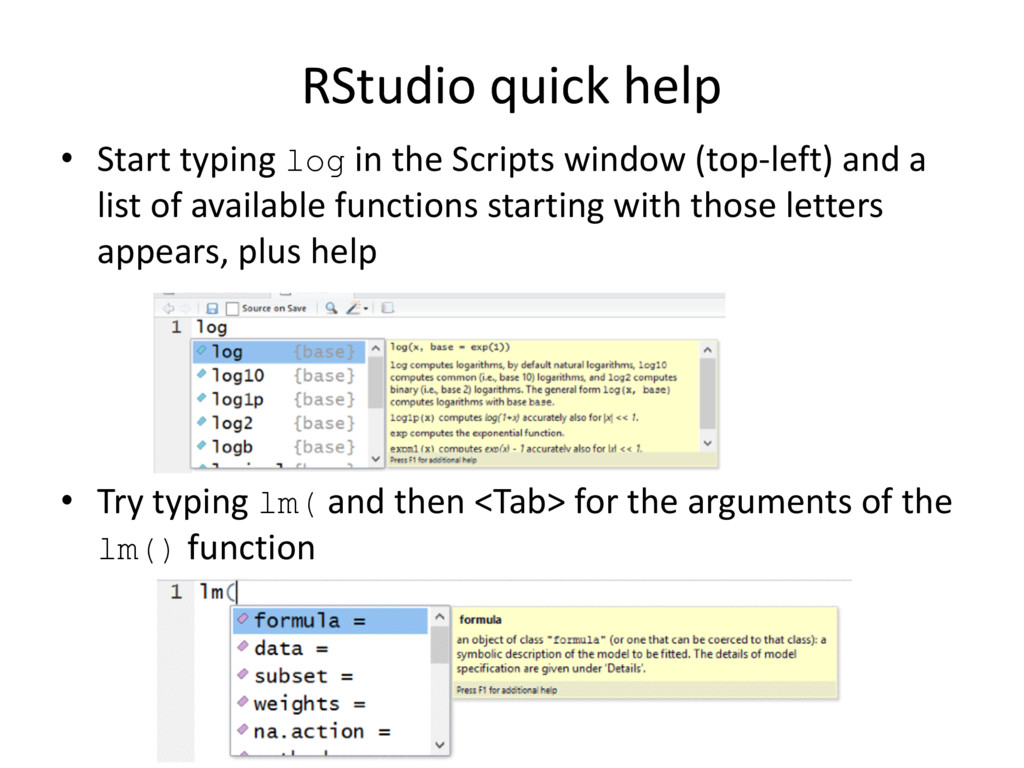
- Getting help.
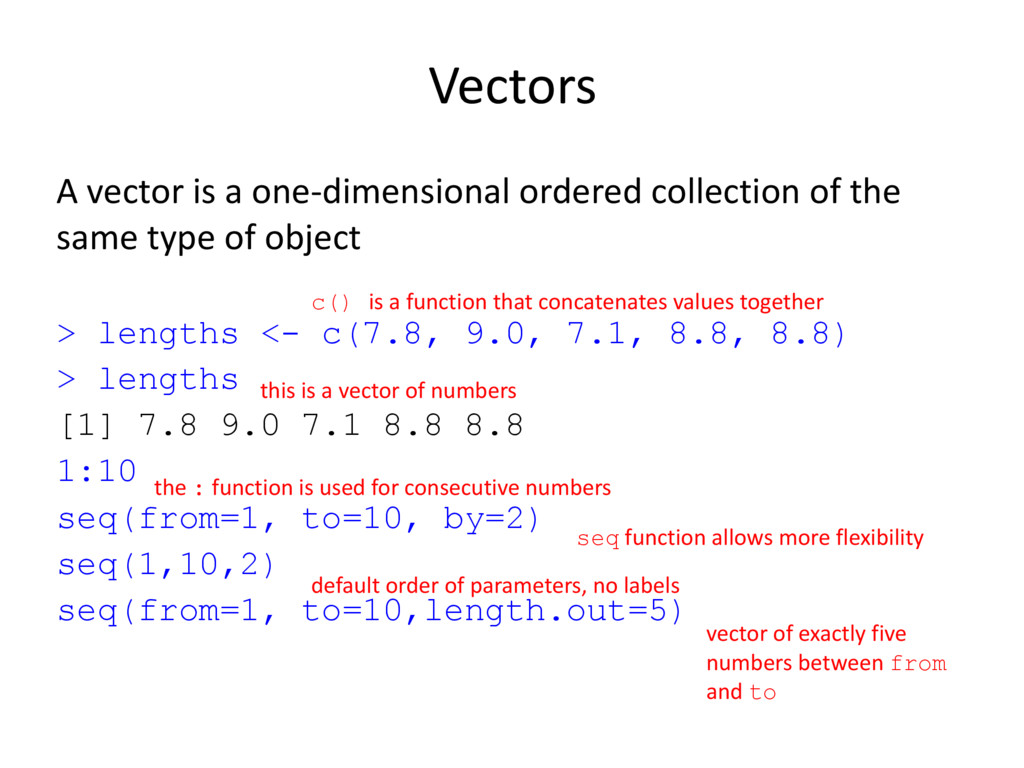
- Major data structures (vectors, matrices and data.frames).
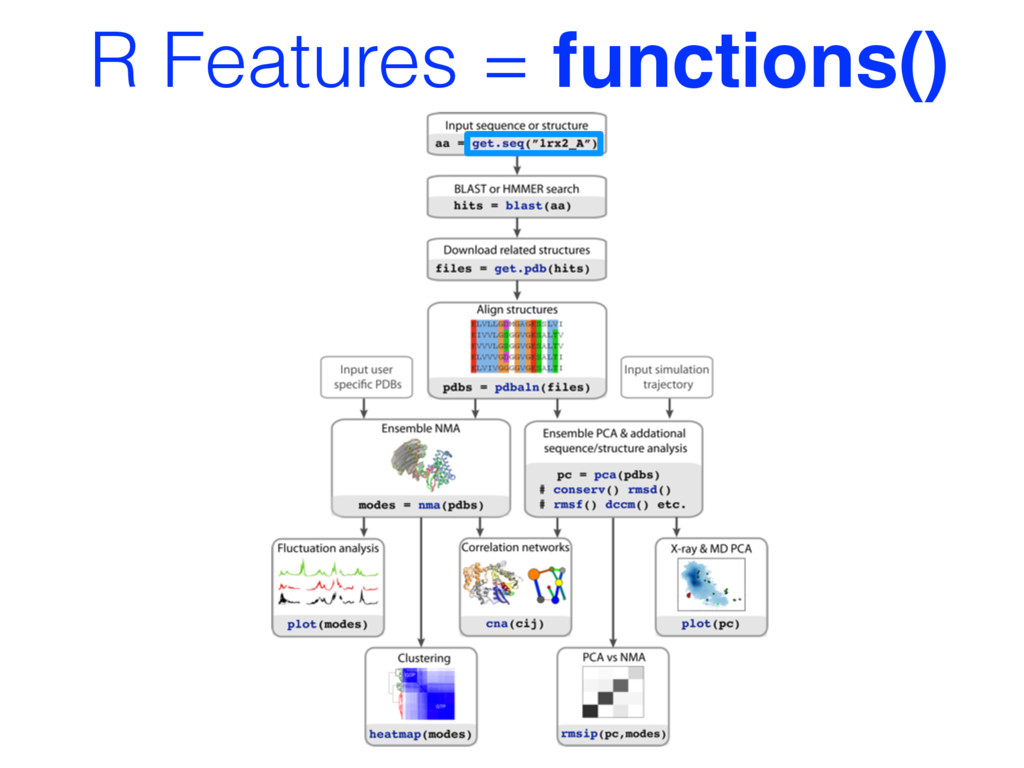
- Using functions (arguments, vectorizion and re-cycling).
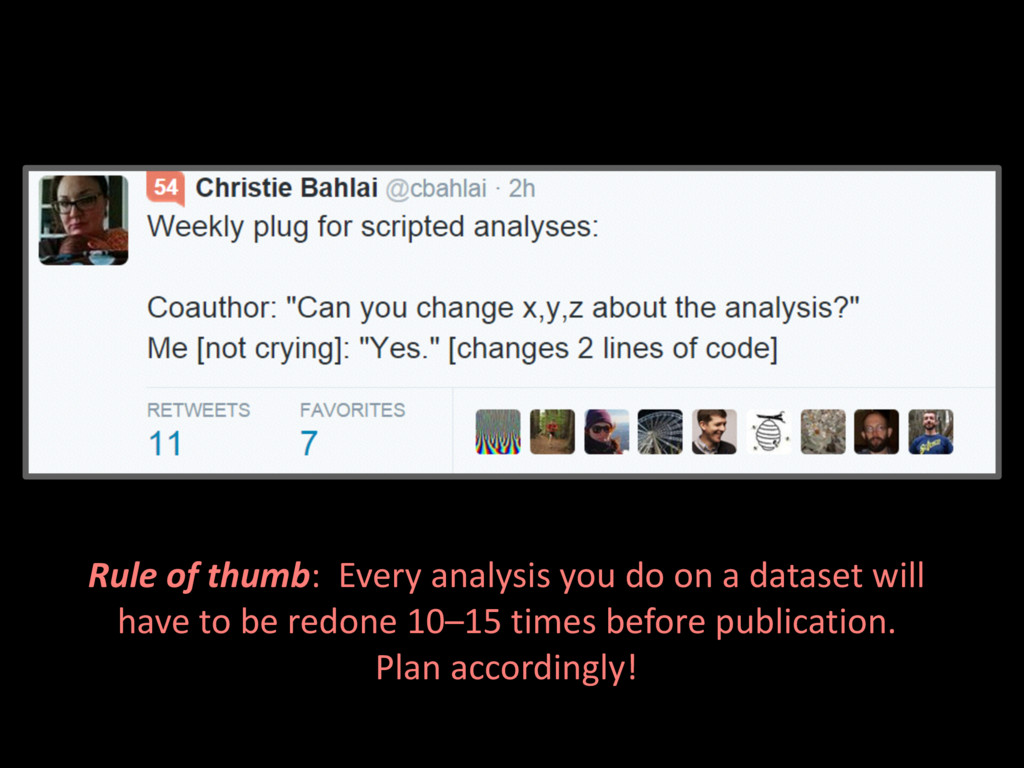
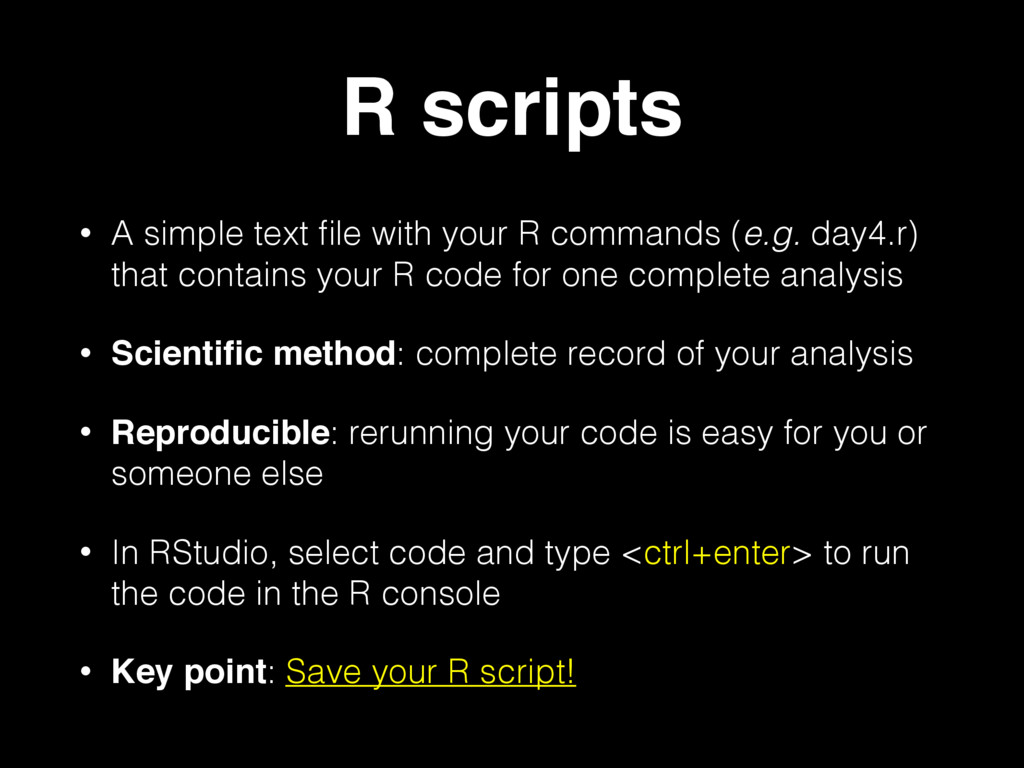
- R scripts and reproducibility.
![Barry Grant [email protected] http://thegrantlab.org](https://files.speakerdeck.com/presentations/95cf77439df54785a9716718af8d05a0/slide_0.jpg)
![> 2+2 [1] 4 > 3^2 [1] 9 > sqrt(25)](https://files.speakerdeck.com/presentations/95cf77439df54785a9716718af8d05a0/slide_25.jpg)
![Vector operations work element-‐wise > (x <- 1:3) [1] 1](https://files.speakerdeck.com/presentations/95cf77439df54785a9716718af8d05a0/slide_41.jpg)