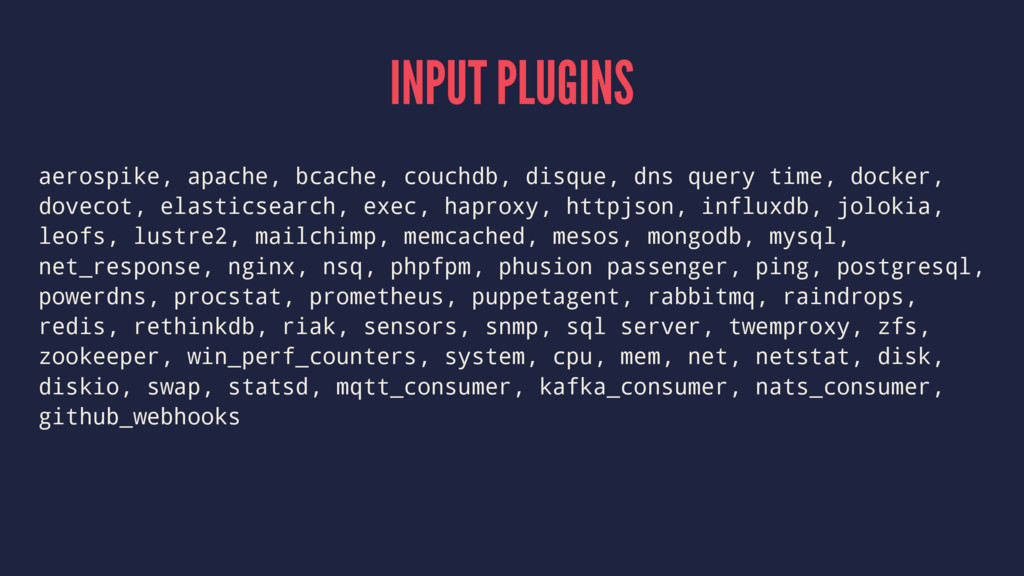
docker, dovecot, elasticsearch, exec, haproxy, httpjson, influxdb, jolokia, leofs, lustre2, mailchimp, memcached, mesos, mongodb, mysql, net_response, nginx, nsq, phpfpm, phusion passenger, ping, postgresql, powerdns, procstat, prometheus, puppetagent, rabbitmq, raindrops, redis, rethinkdb, riak, sensors, snmp, sql server, twemproxy, zfs, zookeeper, win_perf_counters, system, cpu, mem, net, netstat, disk, diskio, swap, statsd, mqtt_consumer, kafka_consumer, nats_consumer, github_webhooks
![[[outputs.influxdb]] urls = ["http://localhost:8086"] database = "telegraf" precision = "s"](https://files.speakerdeck.com/presentations/650a9388c79c4d36bc027366a2082741/slide_20.jpg)
![[[inputs.cpu]] percpu = true totalcpu = true drop = ["time_*"]](https://files.speakerdeck.com/presentations/650a9388c79c4d36bc027366a2082741/slide_21.jpg)
![GitLab Performance Monitoring: a monitoring system using InfluxDB [...] then](https://files.speakerdeck.com/presentations/650a9388c79c4d36bc027366a2082741/slide_31.jpg)