Upgrade to Pro — share decks privately, control downloads, hide ads and more …

Awesome!!

bobtheyobs
May 03, 2012
110

 Awesome!!

What what

bobtheyobs

May 03, 2012
Tweet

Transcript

  1. 2 Cautionary note on forward-looking statements This presentation includes forward-looking

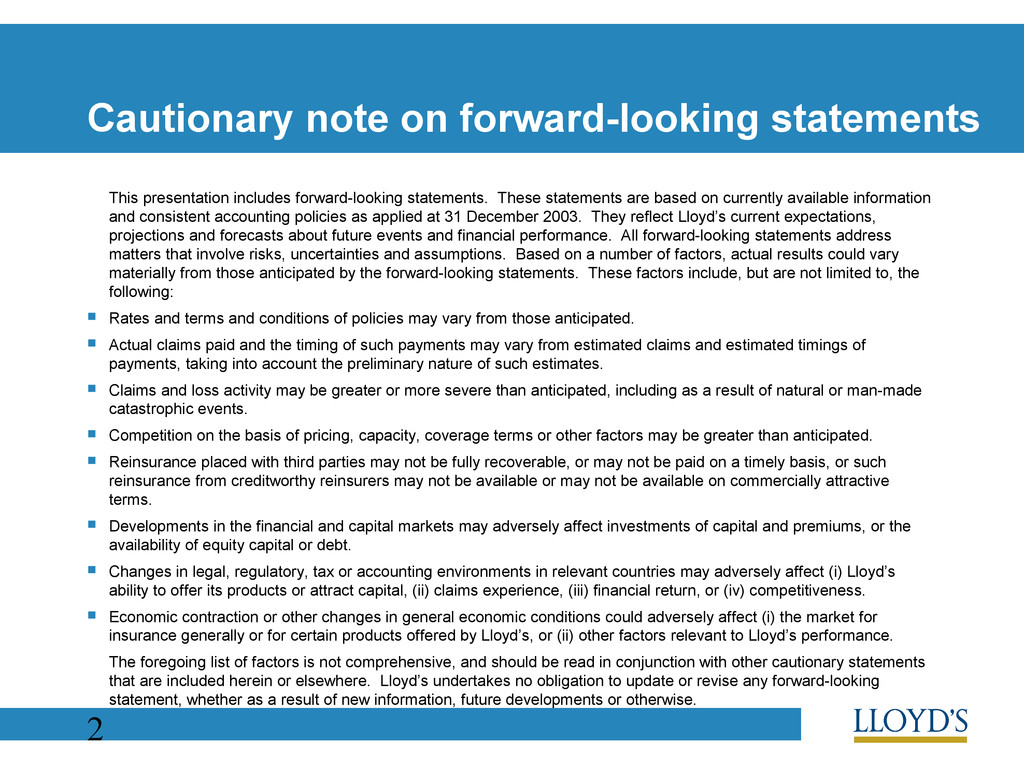
    statements. These statements are based on currently available information and consistent accounting policies as applied at 31 December 2003. They reflect Lloyd’s current expectations, projections and forecasts about future events and financial performance. All forward-looking statements address matters that involve risks, uncertainties and assumptions. Based on a number of factors, actual results could vary materially from those anticipated by the forward-looking statements. These factors include, but are not limited to, the following:  Rates and terms and conditions of policies may vary from those anticipated.  Actual claims paid and the timing of such payments may vary from estimated claims and estimated timings of payments, taking into account the preliminary nature of such estimates.  Claims and loss activity may be greater or more severe than anticipated, including as a result of natural or man-made catastrophic events.  Competition on the basis of pricing, capacity, coverage terms or other factors may be greater than anticipated.  Reinsurance placed with third parties may not be fully recoverable, or may not be paid on a timely basis, or such reinsurance from creditworthy reinsurers may not be available or may not be available on commercially attractive terms.  Developments in the financial and capital markets may adversely affect investments of capital and premiums, or the availability of equity capital or debt.  Changes in legal, regulatory, tax or accounting environments in relevant countries may adversely affect (i) Lloyd’s ability to offer its products or attract capital, (ii) claims experience, (iii) financial return, or (iv) competitiveness.  Economic contraction or other changes in general economic conditions could adversely affect (i) the market for insurance generally or for certain products offered by Lloyd’s, or (ii) other factors relevant to Lloyd’s performance. The foregoing list of factors is not comprehensive, and should be read in conjunction with other cautionary statements that are included herein or elsewhere. Lloyd’s undertakes no obligation to update or revise any forward-looking statement, whether as a result of new information, future developments or otherwise.
  2. 3 Agenda  Introduction Lord Levene Chairman  2003 Results

    Nick Prettejohn Chief Executive  Questions
  3. 4 2003 Results - highlights  Profit of £1,892m* for

    2003 (£834m for 2002)  Further reduction in combined ratio to 90.7% (2002: 98.6%)  Initial profit projection of £1,780m for 2003 underwriting year (3 year accounting basis)  39% increase in central assets to £781m  Net resources up 35% to £10.1bn *Pro-forma annual accounting basis
  4. 5 Annual accounting results £m 2002 2003 Net earned premiums

    10,669 11, 711 +10% Net incurred claims (6,652) (6,697) +1% Net operating expenses (3,586) (3,985) +11% Loss on exchange (401) (30) -93% Investment return 804 893 +11% Profit on ordinary activities 834 1,892 +127% *Pro-forma annual accounting basis
  5. 6 2003 Annual accounting results Premiums 1.4 2.5 9.8 11.0

    0 2 4 6 8 10 12 Constant exchange rates Gross written premium Net earned premium % increase on 2002 *Pro-forma annual accounting basis
  6. 7 2003 Annual accounting results Outwards reinsurance premiums 31.1 25.4

    0 5 10 15 20 25 30 35 2002 2003 % ceded *Pro-forma annual accounting basis
  7. 8 2003 Annual accounting results Premiums: on-going businesses 8.7 26.2

    0 5 10 15 20 25 30 Gross written premium Net earned premium % increase on 2002 *Pro-forma annual accounting basis
  8. 9 Annual accounting results £m 2002 2003 Net earned premiums

    10,669 11, 711 +10% Net incurred claims (6,652) (6,697) +1% Net operating expenses (3,586) (3,985) +11% Loss on exchange (401) (30) -93% Investment return 804 893 +11% Profit on ordinary activities 834 1,892 +127% *Pro-forma annual accounting basis
  9. 10 2003 Annual accounting results Net catastrophe losses Source: Syndicate

    quarterly returns 445 272 178 87 408 642 206 2,663 250 142 0 500 1,000 1,500 2,000 2,500 3,000 1994 1995 1996 1997 1998 1999 2000 2001 2002 2003 £m
  10. 11 2003 Results – reserve strengthening £m Current accident year

    2,437 Reserve strengthening (545) Profit on ordinary activities before tax 1,892 *Pro-forma annual accounting basis
  11. 12 Annual accounting results £m 2002 2003 Net earned premiums

    10,669 11, 711 +10% Net incurred claims (6,652) (6,697) +1% Net operating expenses (3,586) (3,985) +11% Loss on exchange (401) (30) -93% Investment return 804 893 +11% Profit on ordinary activities 834 1,892 +127% *Pro-forma annual accounting basis
  12. 13 Annual accounting results £m 2002 2003 Net earned premiums

    10,669 11, 711 +10% Net incurred claims (6,652) (6,697) +1% Net operating expenses (3,586) (3,985) +11% Loss on exchange (401) (30) -93% Investment return 804 893 +11% Profit on ordinary activities 834 1,892 +127% *Pro-forma annual accounting basis
  13. 14 Annual accounting results £m 2002 2003 Net earned premiums

    10,669 11, 711 +10% Net incurred claims (6,652) (6,697) +1% Net operating expenses (3,586) (3,985) +11% Loss on exchange (401) (30) -93% Investment return 804 893 +11% Profit on ordinary activities 834 1,892 +127% *Pro-forma annual accounting basis
  14. 16 Lloyd's: performance by class of business 2003 Calendar year

    combined ratios *Pro-forma annual accounting basis at syndicate level 110.4 89.4 89.3 93.6 89.7 83.4 93.0 50 60 70 80 90 100 110 120 Casualty Property Reinsurance Motor Marine Energy Aviation %
  15. 17 90.7 101.4 100.7 101.2 2003 Lloyd's vs Industry 2003

    Combined Ratios *Pro-forma annual accounting basis Sources i) Company data, ii) Insurance Information Institute estimate, iii) Reinsurance Association of America 98.6 113.3 107.5 121.3 2002 50 60 70 80 90 100 110 120 130 Lloyd's* European P/C & R/I Industry (i) US P/C Industry (ii) US R/I Industry (iii) %
  16. 18 Underwriting year result & projection 2001 account result (2,378)

    2002 account projection 1,671 2003 account projection 1,780 * Three year accounting basis £m
  17. 19 Net incurred loss ratio development 1998-2003 NB All ratio

    denominators are Q12 actual or estimated ultimate premiums for open years Source: Lloyd’s audited annual accounts 0 10 20 30 40 50 60 70 80 90 100 0 1 2 3 4 5 6 7 8 Quarter 1998 1999 2000 2001 2002 2003 %
  18. 20 Net incurred loss ratio development 1993-1997 vs 2002 &

    2003 NB All ratio denominators are Q12 actual or estimated ultimate premiums for open years Source: Lloyd’s audited annual accounts 0 10 20 30 40 50 60 70 80 0 1 2 3 4 5 6 7 8 Quarter 1993 1994 1995 1996 1997 2002 2003 %
  19. 21 Balance Sheet £m 2002 2003 Cash & investments 24,512

    27, 893 +14% Reinsurers’ share of technical provisions 13,693 11,180 -18% Other assets 11,091 9,830 -11% Total assets 49,296 48,903 -1% Total liabilities (41,787) (38,758) -7% Net resources 7,509 10,145 +35%
  20. 23 Lloyd’s central assets 363 563 781 0 200 400

    600 800 1,000 2001 2002 2003 £m
  21. 24 2003 central assets – Central Fund arbitration  Net

    potential exposure same as last year  Arbitration due later this year  Lloyd’s position unchanged 781 491 290 0 200 400 600 800 1,000 2003 2003 £m
  22. 25 Central assets – post 9/11 target achieved $1,398 @

    USD 1.79 $1,188 @ 2001 exchange rates 363 563 781 0 200 400 600 800 1,000 2001 2002 2003 £m
  23. 26 No increase in capacity 2004 vs 2003 Source: 2003

    final stamp capacity, 2004 first stamp capacity. QQS latest business plan estimates 0 2 4 6 8 10 12 14 16 18 2003 2004 Capacity Qualifying Quota Share £bn
  24. 27 Market conditions remain attractive 94 98 100 Aviation 96

    104 100 Energy 121 115 100 Marine 106 107 100 Motor 102 104 100 Reinsurance 98 103 100 Property 130 121 100 Casualty 2004 2003 2002 Premium rating index *Pro-forma annual accounting basis 93.0 83.4 89.7 93.6 89.3 89.4 110.4 Calendar year combined ratios 2003
  25. 28 Industry fundamentals – the same one year on Capital

    Markets Industry Reserve Strengthening External Influences Lloyd’s Influences Franchise Implementation UNDERWRITING PROFIT
  26. 29 2003 – A year of continued progress  Implementation

    of the Franchise  Transition towards limited liability  Move to annual accounting  Progress on Business Process Reform
  27. 30 Summary – Another year of progress and profit 

    A year of continued progress against strategic objectives  A year of strong financial results  £1.9 billion profit, helped by low catastrophe losses but after reserve strengthening  Combined ratio of 90.7%, outperforming our international peer group  Substantial increase in balance sheet resources (central assets up 39%, net resources up 35%)  Market conditions attractive and fundamentals unchanged  No room for complacency *Pro-forma annual accounting basis