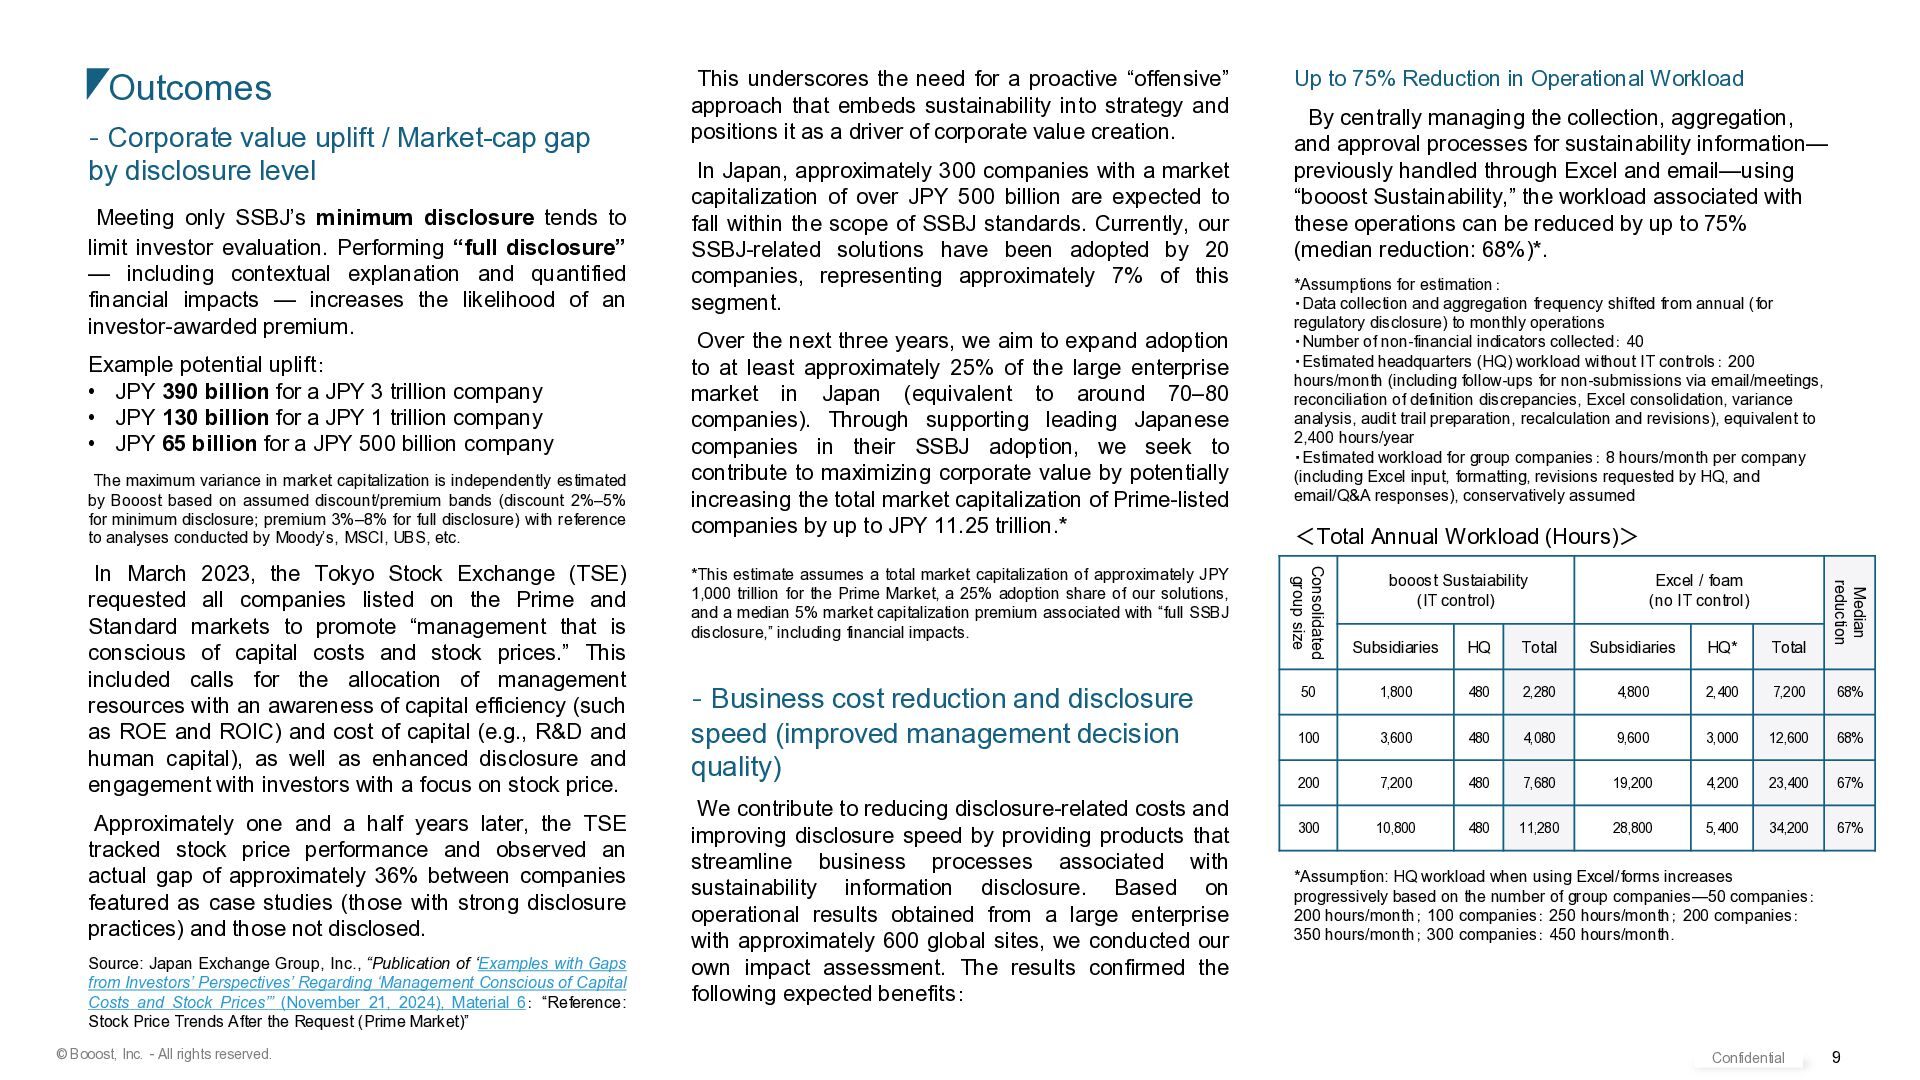
underscores the need for a proactive “offensive” approach that embeds sustainability into strategy and positions it as a driver of corporate value creation. In Japan, approximately 300 companies with a market capitalization of over JPY 500 billion are expected to fall within the scope of SSBJ standards. Currently, our SSBJ-related solutions have been adopted by 20 companies, representing approximately 7% of this segment. Over the next three years, we aim to expand adoption to at least approximately 25% of the large enterprise market in Japan (equivalent to around 70–80 companies). Through supporting leading Japanese companies in their SSBJ adoption, we seek to contribute to maximizing corporate value by potentially increasing the total market capitalization of Prime-listed companies by up to JPY 11.25 trillion.* *This estimate assumes a total market capitalization of approximately JPY 1,000 trillion for the Prime Market, a 25% adoption share of our solutions, and a median 5% market capitalization premium associated with “full SSBJ disclosure,” including financial impacts. - Business cost reduction and disclosure speed (improved management decision quality) We contribute to reducing disclosure-related costs and improving disclosure speed by providing products that streamline business processes associated with sustainability information disclosure. Based on operational results obtained from a large enterprise with approximately 600 global sites, we conducted our own impact assessment. The results confirmed the following expected benefits: Up to 75% Reduction in Operational Workload By centrally managing the collection, aggregation, and approval processes for sustainability information— previously handled through Excel and email—using “booost Sustainability,” the workload associated with these operations can be reduced by up to 75% (median reduction: 68%)*. *Assumptions for estimation: ・Data collection and aggregation frequency shifted from annual (for regulatory disclosure) to monthly operations ・Number of non-financial indicators collected: 40 ・Estimated headquarters (HQ) workload without IT controls: 200 hours/month (including follow-ups for non-submissions via email/meetings, reconciliation of definition discrepancies, Excel consolidation, variance analysis, audit trail preparation, recalculation and revisions), equivalent to 2,400 hours/year ・Estimated workload for group companies: 8 hours/month per company (including Excel input, formatting, revisions requested by HQ, and email/Q&A responses), conservatively assumed <Total Annual Workload (Hours)> *Assumption: HQ workload when using Excel/forms increases progressively based on the number of group companies—50 companies: 200 hours/month; 100 companies: 250 hours/month; 200 companies: 350 hours/month; 300 companies: 450 hours/month. Outcomes - Corporate value uplift / Market-cap gap by disclosure level Meeting only SSBJ’s minimum disclosure tends to limit investor evaluation. Performing “full disclosure” — including contextual explanation and quantified financial impacts — increases the likelihood of an investor-awarded premium. Example potential uplift: • JPY 390 billion for a JPY 3 trillion company • JPY 130 billion for a JPY 1 trillion company • JPY 65 billion for a JPY 500 billion company The maximum variance in market capitalization is independently estimated by Booost based on assumed discount/premium bands (discount 2%–5% for minimum disclosure; premium 3%–8% for full disclosure) with reference to analyses conducted by Moody’s, MSCI, UBS, etc. In March 2023, the Tokyo Stock Exchange (TSE) requested all companies listed on the Prime and Standard markets to promote “management that is conscious of capital costs and stock prices.” This included calls for the allocation of management resources with an awareness of capital efficiency (such as ROE and ROIC) and cost of capital (e.g., R&D and human capital), as well as enhanced disclosure and engagement with investors with a focus on stock price. Approximately one and a half years later, the TSE tracked stock price performance and observed an actual gap of approximately 36% between companies featured as case studies (those with strong disclosure practices) and those not disclosed. Source: Japan Exchange Group, Inc., “Publication of ‘Examples with Gaps from Investors’ Perspectives’ Regarding ‘Management Conscious of Capital Costs and Stock Prices’” (November 21, 2024), Material 6: “Reference: Stock Price Trends After the Request (Prime Market)” Consolidated group size booost Sustaiability (IT control) Excel / foam (no IT control) Median reduction Subsidiaries HQ Total Subsidiaries HQ* Total 50 1,800 480 2,280 4,800 2,400 7,200 68% 100 3,600 480 4,080 9,600 3,000 12,600 68% 200 7,200 480 7,680 19,200 4,200 23,400 67% 300 10,800 480 11,280 28,800 5,400 34,200 67%