About me • Brian Ly2le – Solu'on Architect at LiquidHub • E-‐mail – [email protected] • Interwebs – @brianly on Twi2er – @brianly on Stack Overflow – Blog infrequently at h2p://brianly2le.com
Agenda • What is produc'on debugging? • Debugging fundamentals • Monitoring and instrumenta'on • Capturing crash informa'on • Common scenarios • … all with a healthy number of examples Since this is an introductory talk I’m skipping: – WinDbg, SOS, and ADPlus – Na've debugging
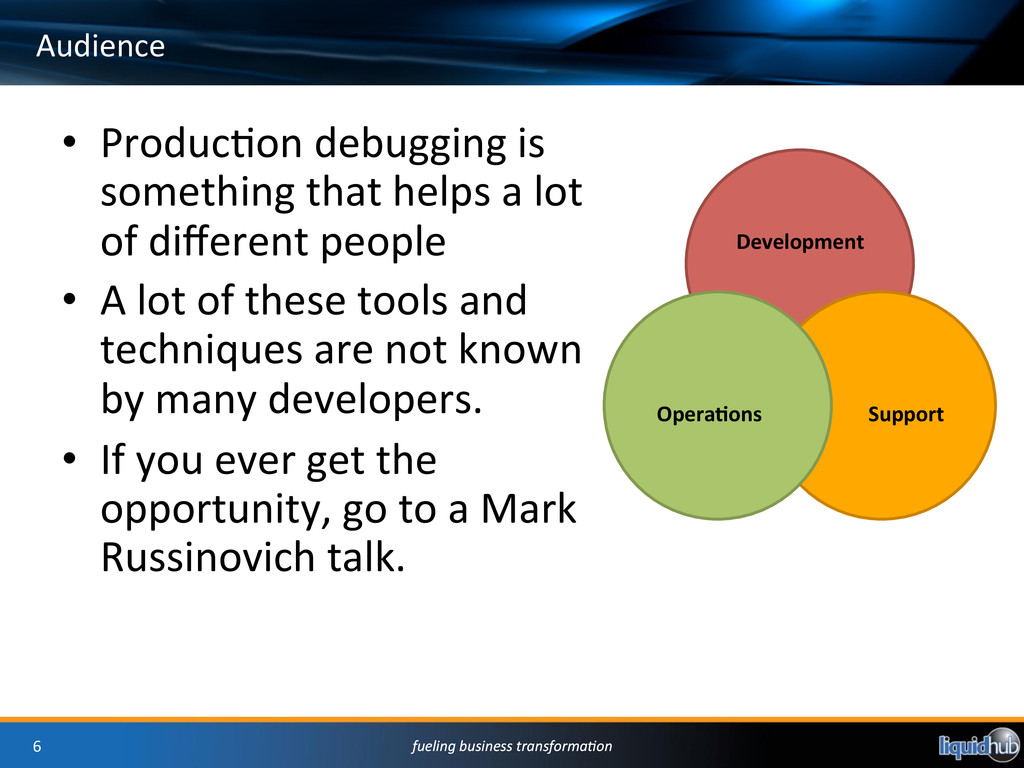
Audience Development Support Opera/ons • Produc'on debugging is something that helps a lot of different people • A lot of these tools and techniques are not known by many developers. • If you ever get the opportunity, go to a Mark Russinovich talk.
What is produc'on debugging? • Effec'vely any debugging you do once code has le_ the confines of a developer worksta'on. • A variety of tools are required to inves'gate problems with: – Resource usage – Security or privilege viola'ons – Random crashing – Bugs with 3rd party so_ware – Network failures • Some consider it a “black art” only accessible to the alpha developers amongst us. • As a discipline it requires you to learn more about the internals of your opera'ng system, database etc.
Why is this important? • It will make your users and manager happy :) • You will get home on 'me. • Your rela'onship with opera'ons will improve. • As you do more of this, your knowledge of opera'ng systems, databases etc. will improve. • Eventually your thinking will change, and you become more proac've.
Produc'on debugging techniques • O_en it does not involve Visual Studio, or any other development environment. • Ac've methods – Produc'on debuggers – Tracing – Protocol analysis • Passive methods – User reports – Crash dumps – Log files
Intermediate language and metadata • Your .NET (managed code) assemblies are compiled to IL which is similar to assembly language. • Older plalorms like C/C++, classic VB, and many other do not have the concept of IL or metadata. • With managed code an executable contains IL plus type informa'on (metadata). • This metadata is useful for Intellisense, serializing objects, debugging, and many other things. • An interes'ng property of metadata is that it can help with disassembling your .NET assembly back to C#.
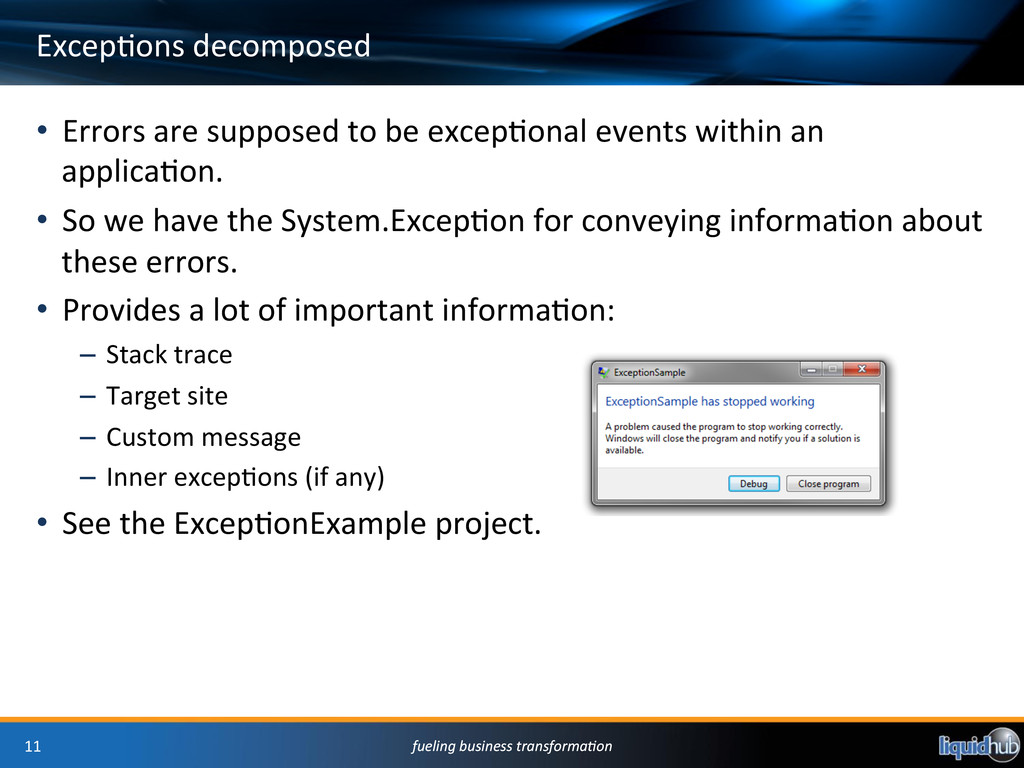
Excep'ons decomposed • Errors are supposed to be excep'onal events within an applica'on. • So we have the System.Excep'on for conveying informa'on about these errors. • Provides a lot of important informa'on: – Stack trace – Target site – Custom message – Inner excep'ons (if any) • See the Excep'onExample project.
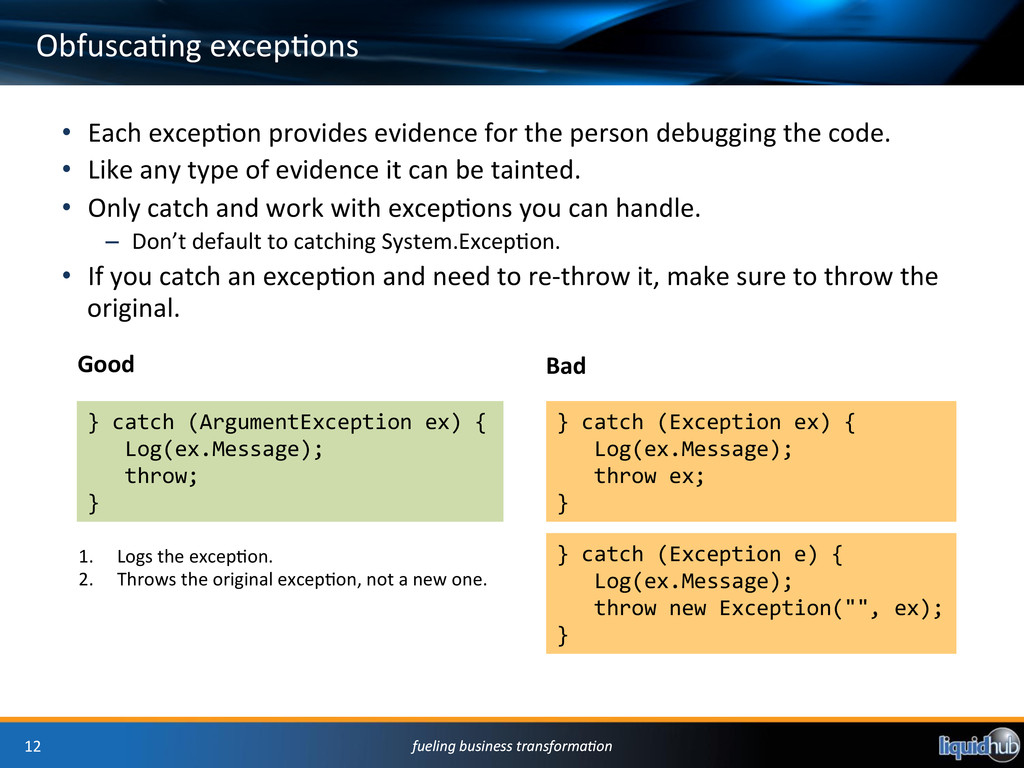
Obfusca'ng excep'ons • Each excep'on provides evidence for the person debugging the code. • Like any type of evidence it can be tainted. • Only catch and work with excep'ons you can handle. – Don’t default to catching System.Excep'on. • If you catch an excep'on and need to re-‐throw it, make sure to throw the original. Good Bad } catch (ArgumentException ex) { Log(ex.Message); throw; } } catch (Exception ex) { Log(ex.Message); throw ex; } } catch (Exception e) { Log(ex.Message); throw new Exception("", ex); } 1. Logs the excep'on. 2. Throws the original excep'on, not a new one.
Debugging symbols • You might have no'ced that there are debug and release op'ons in Visual Studio. • If you build in debug mode then addi'onal code to support the debugger, and symbol (.PDB) files are generated. • In release mode an op'mized version of your applica'on is built. This might s'll create .PDB files. • PDB files are called symbols. They map your executable code to the matching Visual Studio project. – Example: line number informa'on. • Best prac'ce -‐ keep a copy of the PDB files for every build you release.
Reading a stack trace Reading stack traces is a core skill for .NET developers. The lines shown below provide a lot of insight into what was happening. Release Build Debug Build Code Code
Log files • Applica'ons o_en have official and unofficial logs which you can mine for informa'on. • Windows examples: – Event Viewer – %windir%\ System32\LogFiles – %windir%\system32\wbem\logs – %COMMONPROGRAMFILES%\Microso_ Shared\web server extensions \12\LOGS – %systemdrive%\PerfLogs\ – Temp directories (everyone can write there!) • Applica'ons might also log to their database, or to a directory under their user iden'ty. – Eg. C:\Users\brianly\AppData\Local\Diagnos'cs • On Linux look in /var/log.
System resources It is very important to understand how resources constrain your applica'on. They don’t seem that important un'l you run out of them. At 'mes they will seem plen'ful, but that may not be the case under the covers. Most common • Memory • CPU • Disk I/O • Network I/O Meta resources • Handles • Security privileges • Applica'on caches • So_ware licenses • Garbage collec'ons • Complex algorithms
Remote debugging • For some people it might be possible to use the Visual Studio remote debugging tools. • These let you debug applica'ons across the network with a familiar experience. • For a lot of people this is just not possible: – Security considera'ons – Firewalls and rou'ng – Resistance from administrator – End user impact
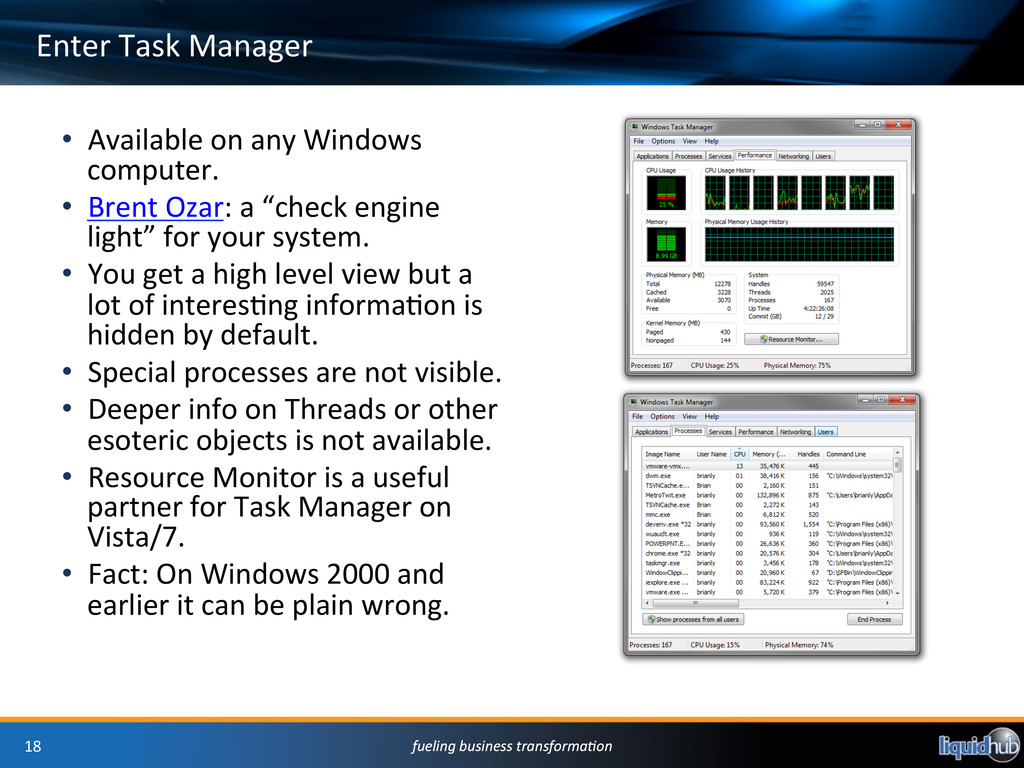
Enter Task Manager • Available on any Windows computer. • Brent Ozar: a “check engine light” for your system. • You get a high level view but a lot of interes'ng informa'on is hidden by default. • Special processes are not visible. • Deeper info on Threads or other esoteric objects is not available. • Resource Monitor is a useful partner for Task Manager on Vista/7. • Fact: On Windows 2000 and earlier it can be plain wrong.
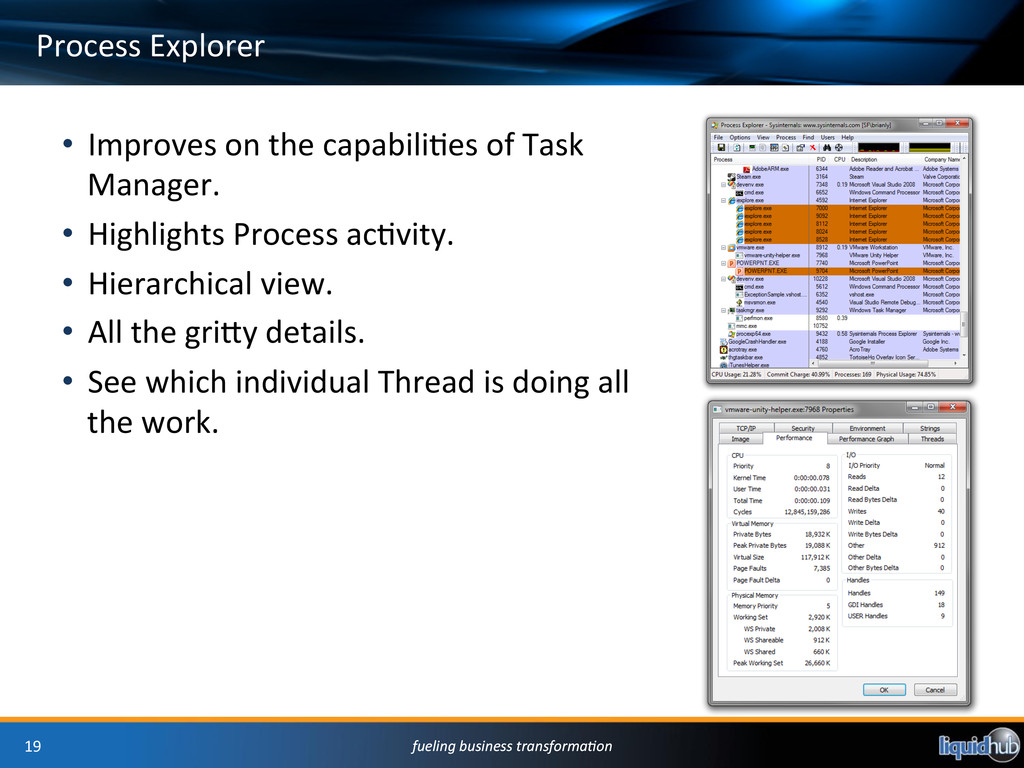
Process Explorer • Improves on the capabili'es of Task Manager. • Highlights Process ac'vity. • Hierarchical view. • All the gri2y details. • See which individual Thread is doing all the work.
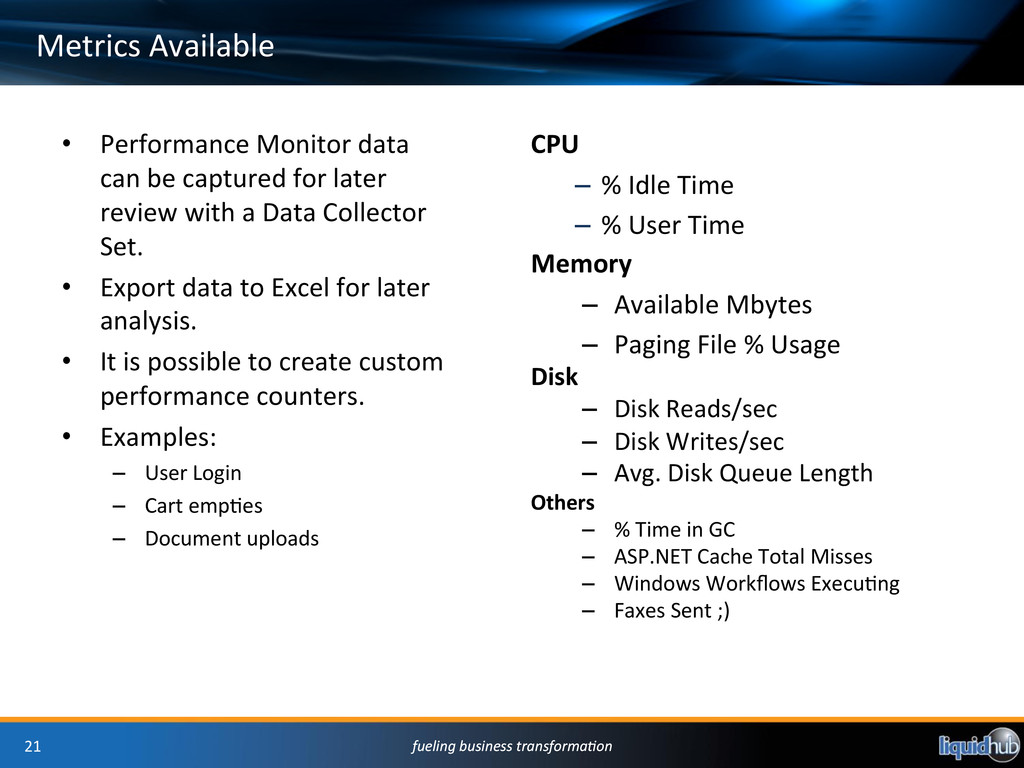
Metrics Available CPU – % Idle Time – % User Time Memory – Available Mbytes – Paging File % Usage Disk – Disk Reads/sec – Disk Writes/sec – Avg. Disk Queue Length • Performance Monitor data can be captured for later review with a Data Collector Set. • Export data to Excel for later analysis. • It is possible to create custom performance counters. • Examples: – User Login – Cart emp'es – Document uploads Others – % Time in GC – ASP.NET Cache Total Misses – Windows Workflows Execu'ng – Faxes Sent ;)
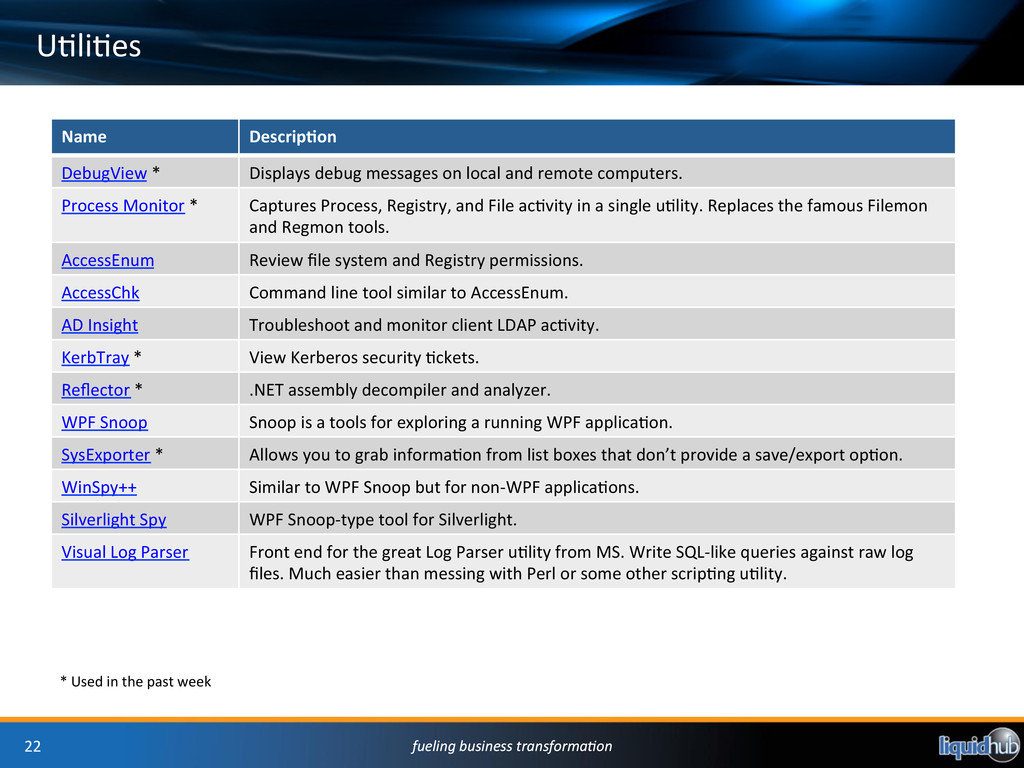
U'li'es Name Descrip/on DebugView * Displays debug messages on local and remote computers. Process Monitor * Captures Process, Registry, and File ac'vity in a single u'lity. Replaces the famous Filemon and Regmon tools. AccessEnum Review file system and Registry permissions. AccessChk Command line tool similar to AccessEnum. AD Insight Troubleshoot and monitor client LDAP ac'vity. KerbTray * View Kerberos security 'ckets. Reflector * .NET assembly decompiler and analyzer. WPF Snoop Snoop is a tools for exploring a running WPF applica'on. SysExporter * Allows you to grab informa'on from list boxes that don’t provide a save/export op'on. WinSpy++ Similar to WPF Snoop but for non-‐WPF applica'ons. Silverlight Spy WPF Snoop-‐type tool for Silverlight. Visual Log Parser Front end for the great Log Parser u'lity from MS. Write SQL-‐like queries against raw log files. Much easier than messing with Perl or some other scrip'ng u'lity. * Used in the past week
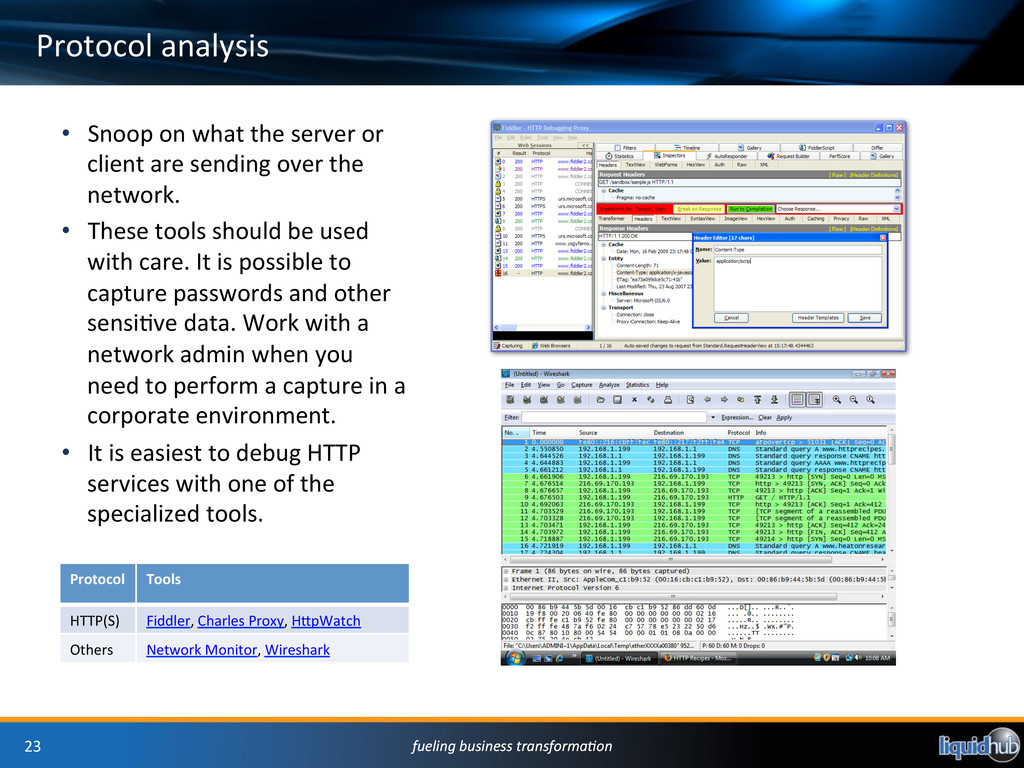
Protocol analysis • Snoop on what the server or client are sending over the network. • These tools should be used with care. It is possible to capture passwords and other sensi've data. Work with a network admin when you need to perform a capture in a corporate environment. • It is easiest to debug HTTP services with one of the specialized tools. Protocol Tools HTTP(S) Fiddler, Charles Proxy, H2pWatch Others Network Monitor, Wireshark
What is a crash dump? • These are basically files containing informa'on on the excep'on which caused the crash. • Unhandled excep'ons bubble up to the top-‐level of an applica'on. • Then .NET invokes it’s own default error handling. • Luckily you can override this behavior and do some interes'ng things.
Why generate crash dumps? • O_en users only know part of the story – They don’t know how the applica'on works – Only a hard crash gets their full a2en'on – Small details get ignored along the way • Good for fixing “broken windows” – Management won’t let you work on the bits of an applica'on that need some a2en'on – You need some metrics to take to your manager
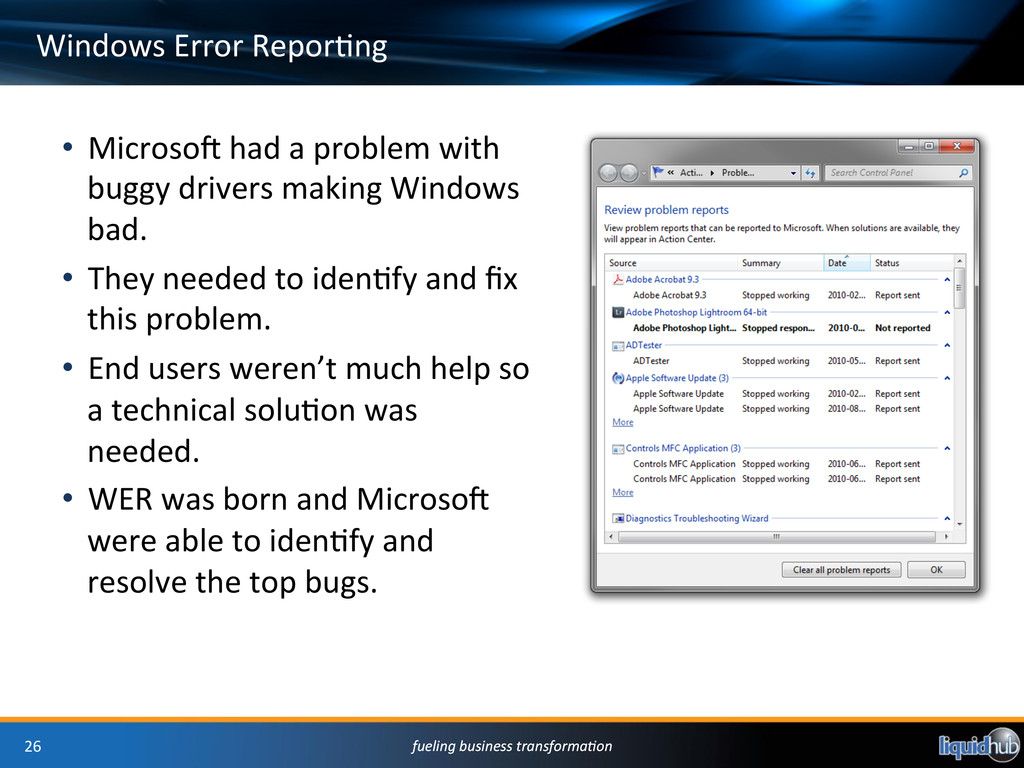
Windows Error Repor'ng • Microso_ had a problem with buggy drivers making Windows bad. • They needed to iden'fy and fix this problem. • End users weren’t much help so a technical solu'on was needed. • WER was born and Microso_ were able to iden'fy and resolve the top bugs.
Crash dumps the hard way • It is possible to write your own code to intercept an unhandled excep'on. • In short: AppDomain.CurrentDomain.UnhandledExcep'on += new UnhandledExcep'onEventHandler(CurrentDomain_UnhandledExcep'on); • Then just dump out the details: void CurrentDomain_UnhandledExcep'on(object sender, UnhandledExcep'onEventArgs e) { } • Just make sure to close the applica'on, and write some code to upload the crash dump. • It’s a good job someone has done this for us.
ELMAH makes it easy for ASP.NET • ELMAH (Error Logging Modules and Handlers) is a free open source component. • Features: – Log to many common databases. – Filter out certain error messages. – Supports a wide variety of hos'ng scenarios. – SharePoint supported in addi'on to Web Forms and ASP.NET MVC. – Admin web pages.
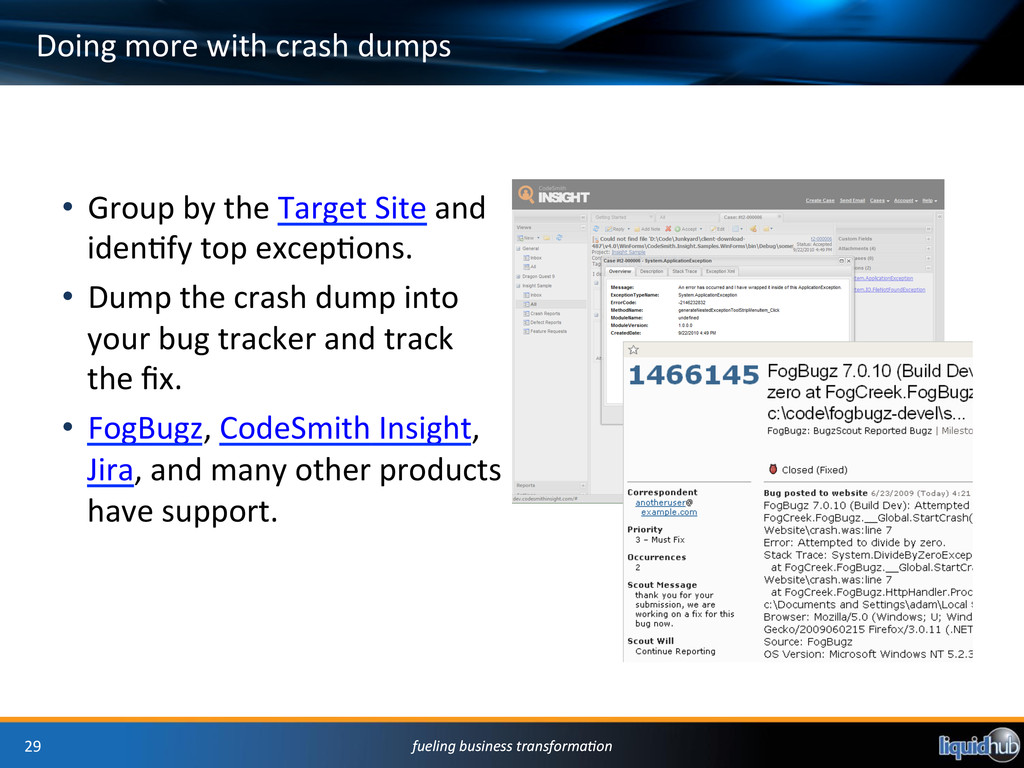
Doing more with crash dumps • Group by the Target Site and iden'fy top excep'ons. • Dump the crash dump into your bug tracker and track the fix. • FogBugz, CodeSmith Insight, Jira, and many other products have support.