Upgrade to Pro — share decks privately, control downloads, hide ads and more …

DevoxxFr 2022 - Remèdes aux oomkill, warm-ups, et lenteurs pour des conteneurs JVM

DevoxxFr 2022 - Remèdes aux oomkill, warm-ups, et lenteurs pour des conteneurs JVM

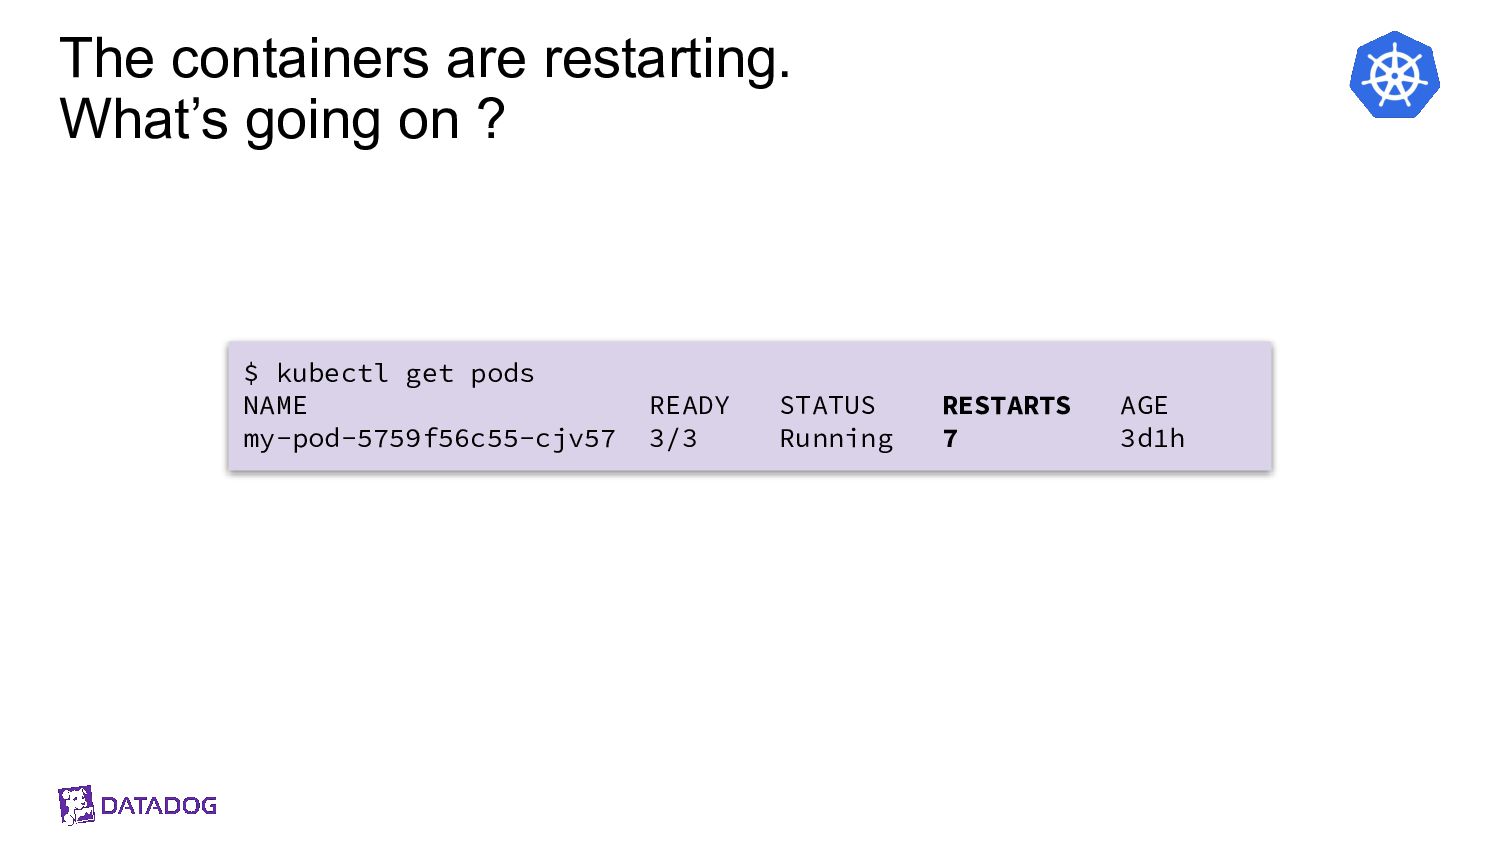
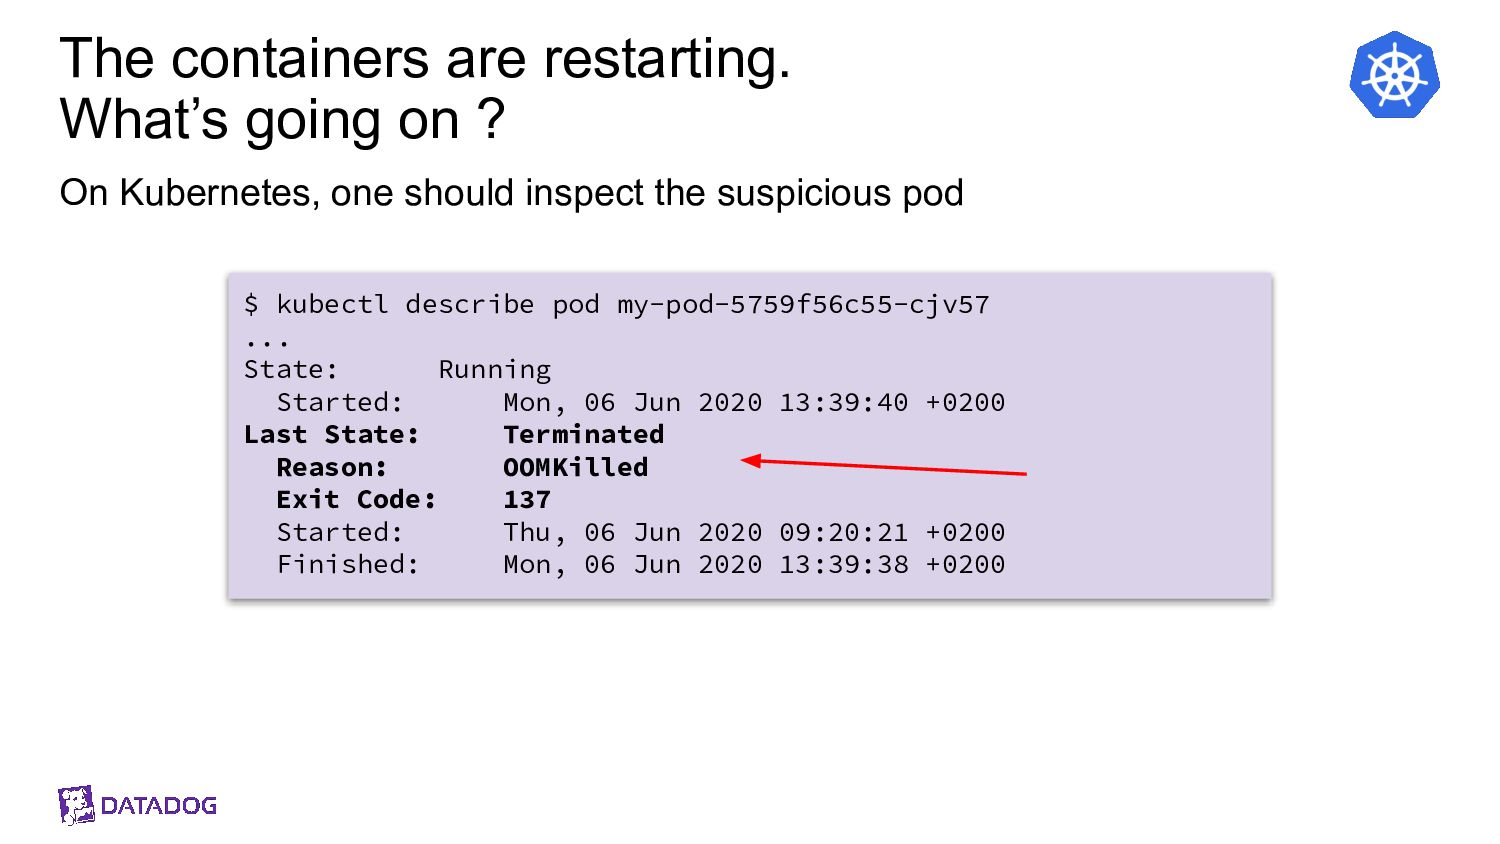
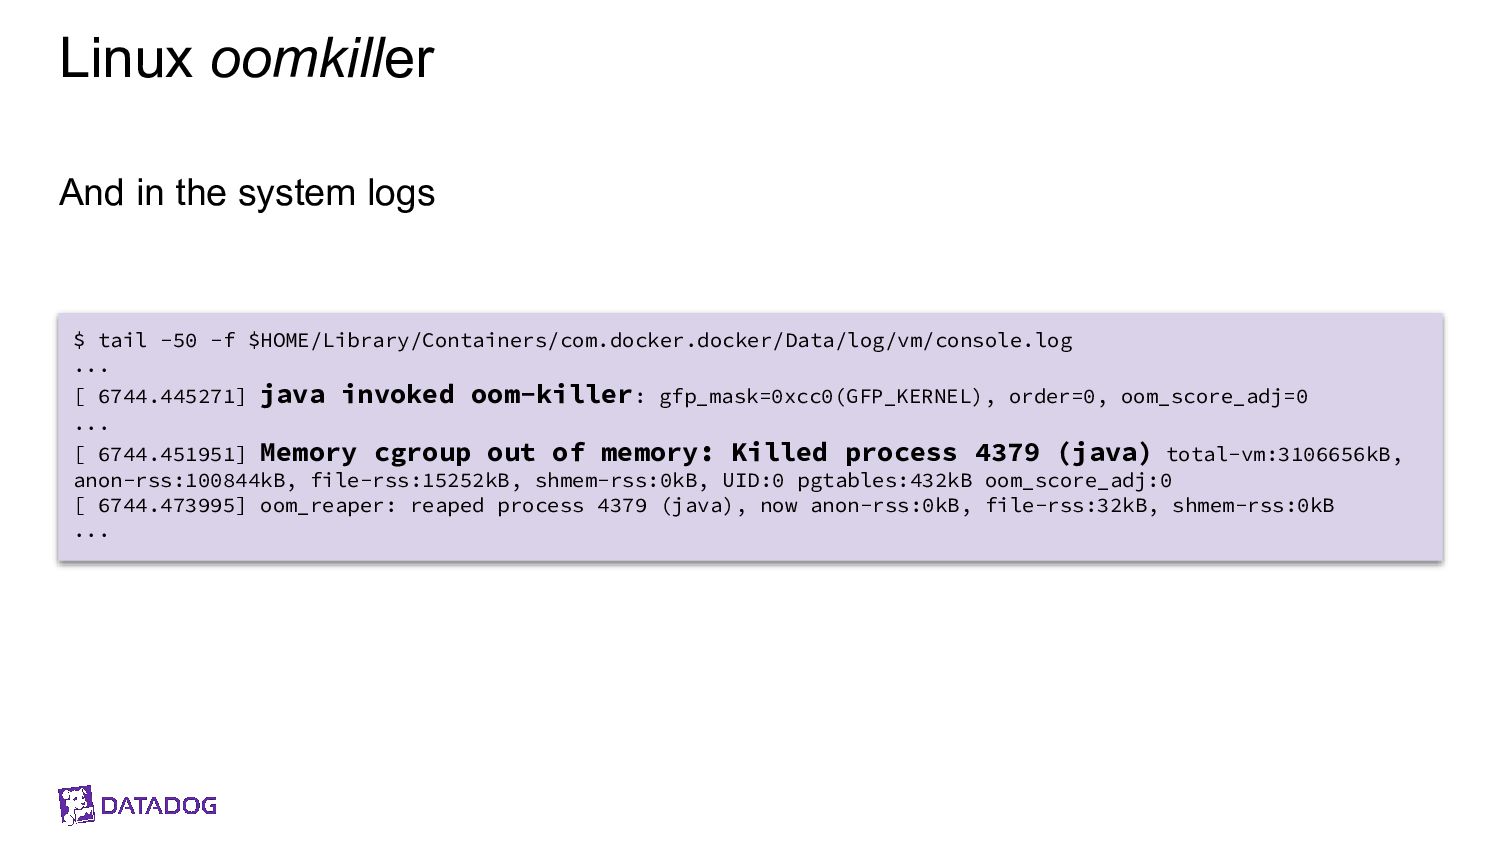
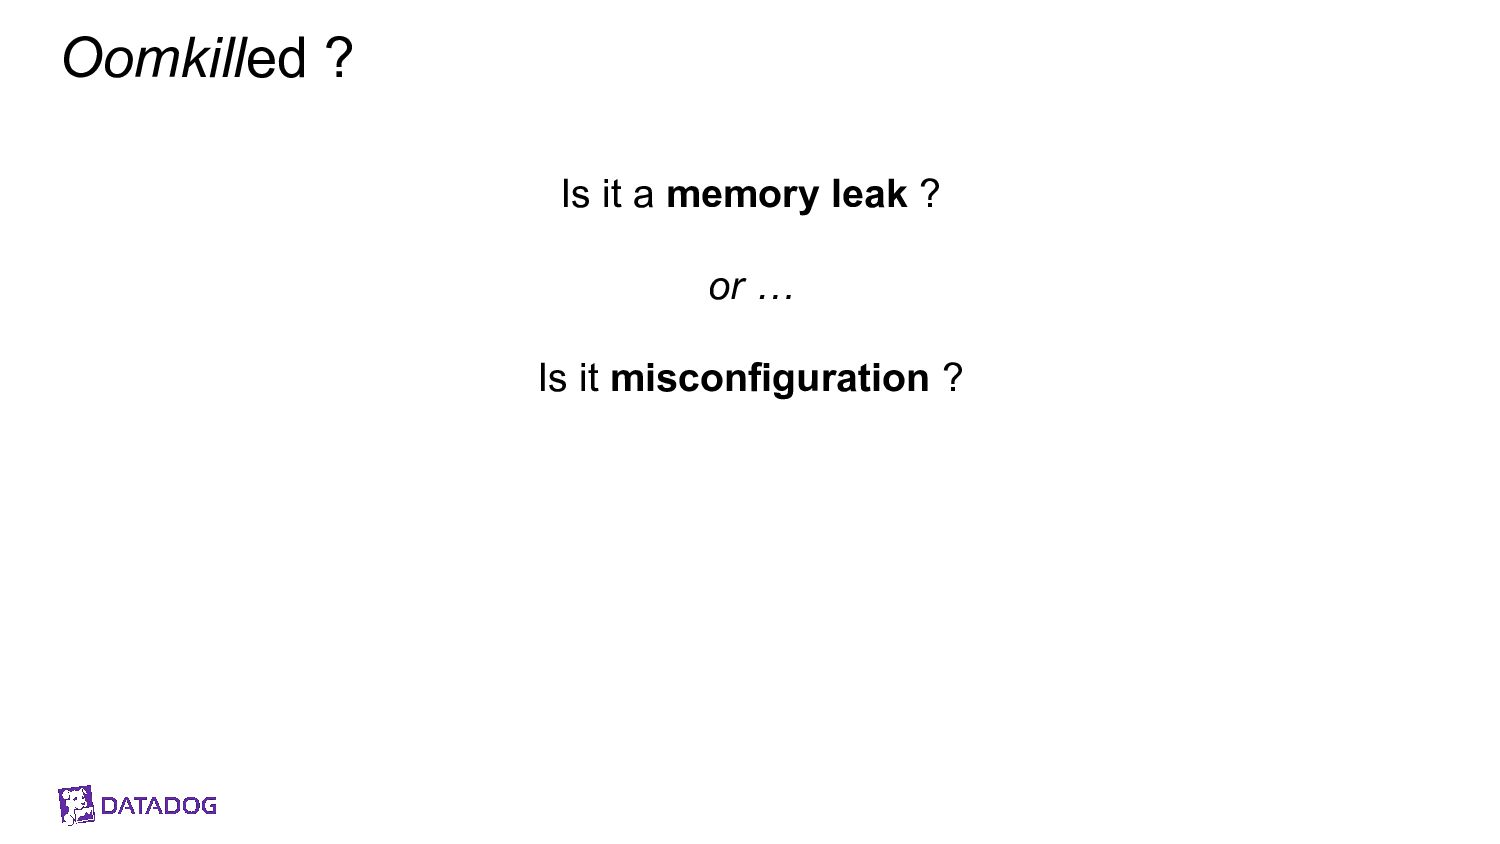
Mes conteneurs JVM sont en prod, oups ils se font _oomkill_, _oups_ le démarrage traîne en longueur, _oups_ ils sont lent en permanence. Nous avons vécu ces situations.

Ces problèmes émergent parce qu’un conteneur est par nature un milieu restreint. Sa configuration a un impact sur le process Java cependant ce process a lui aussi des besoins pour fonctionner.

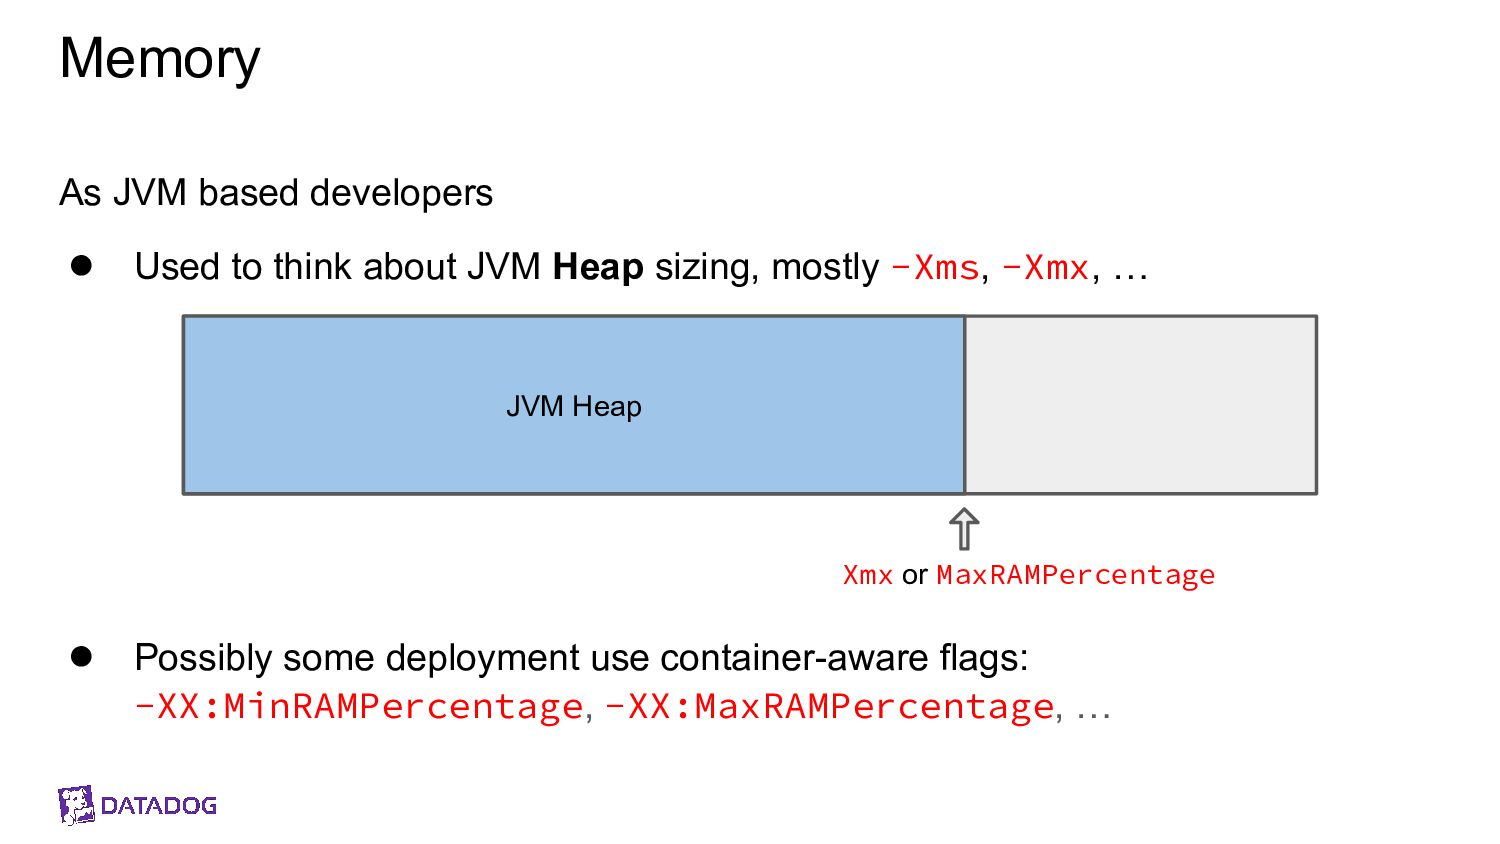
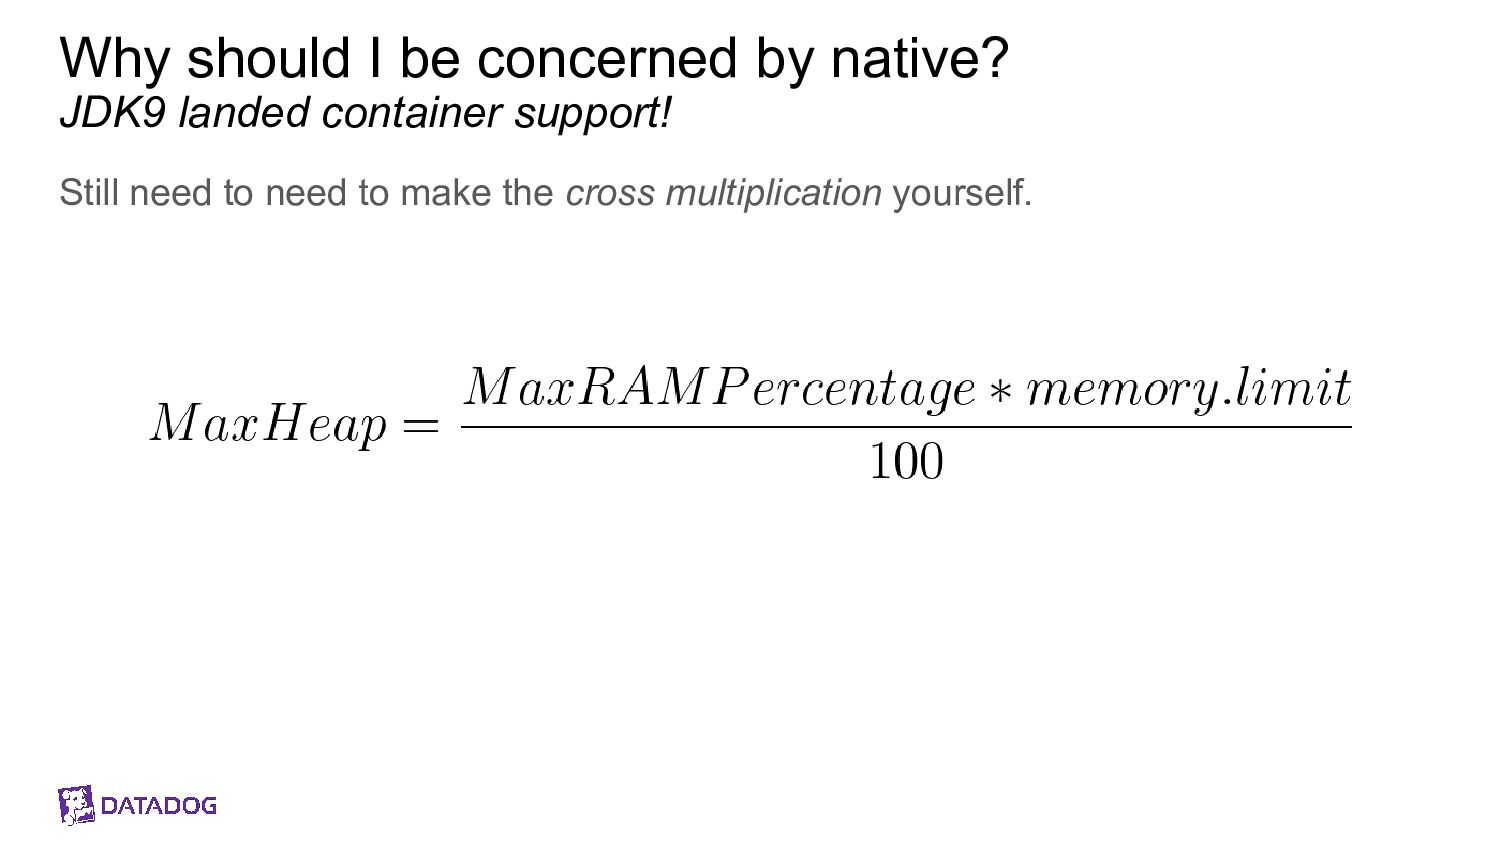
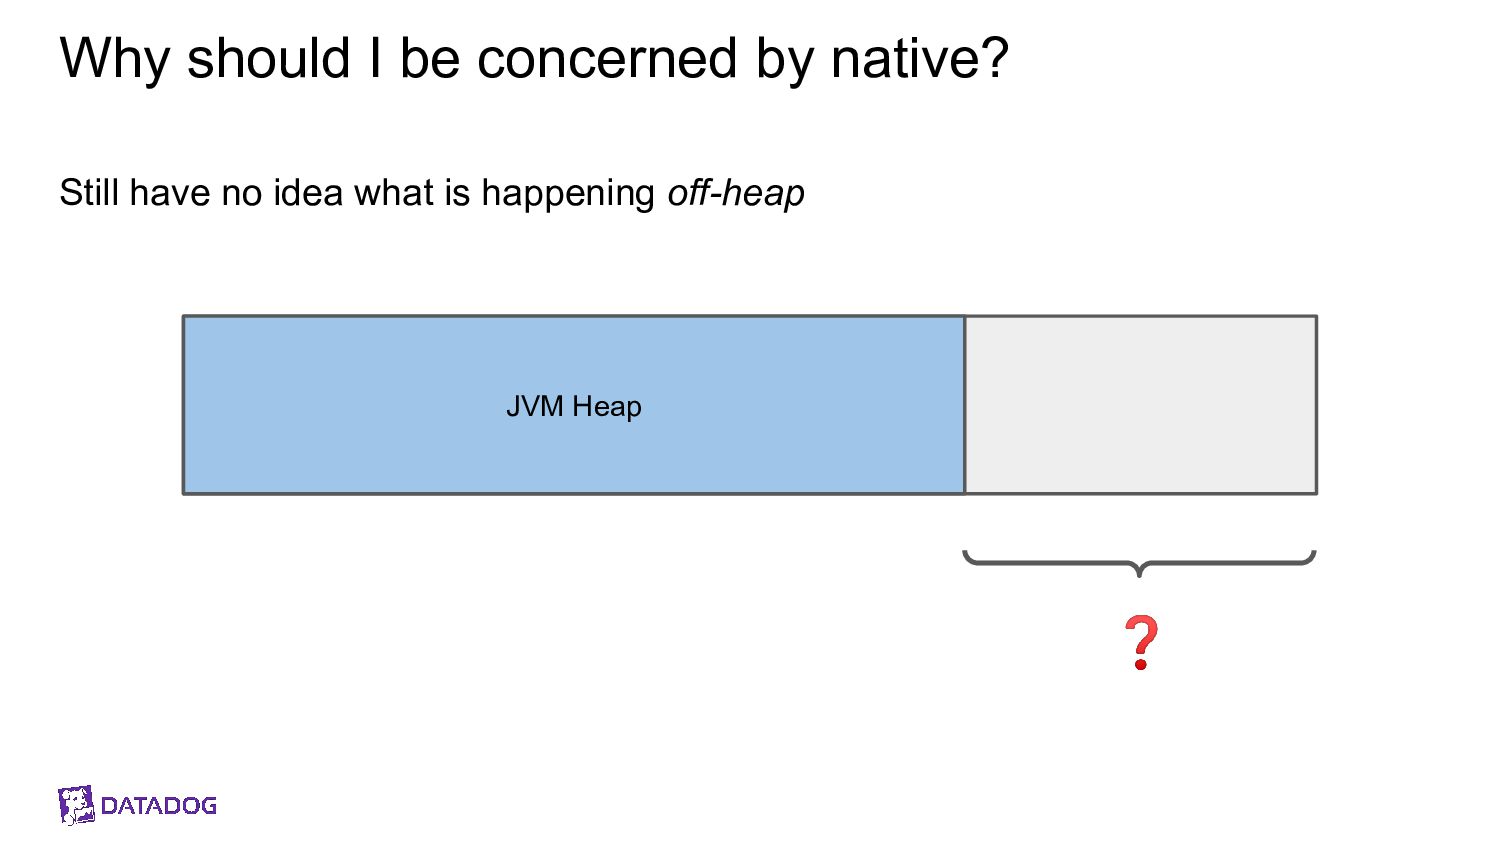
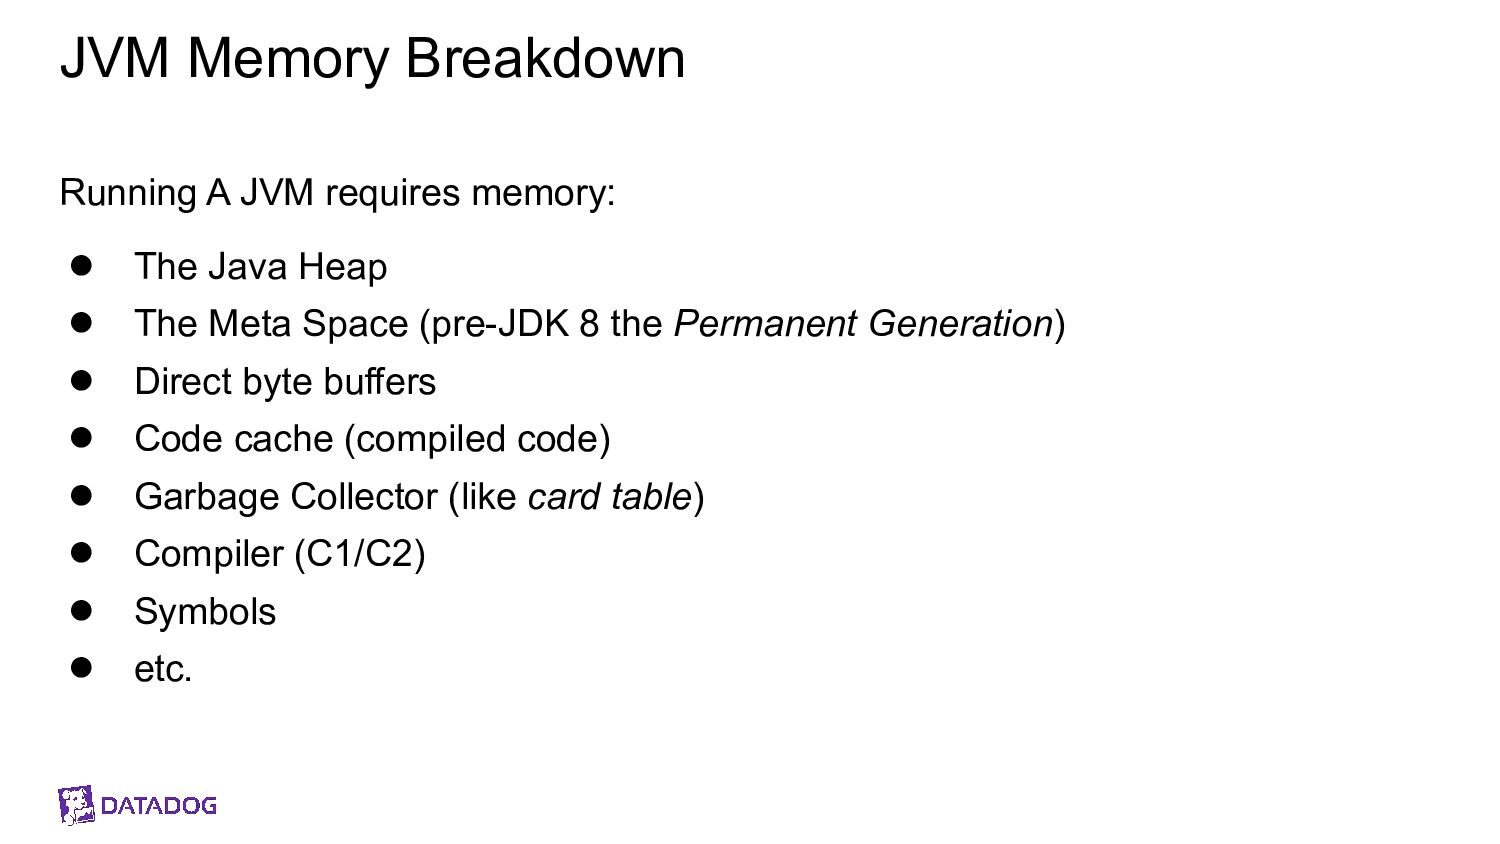
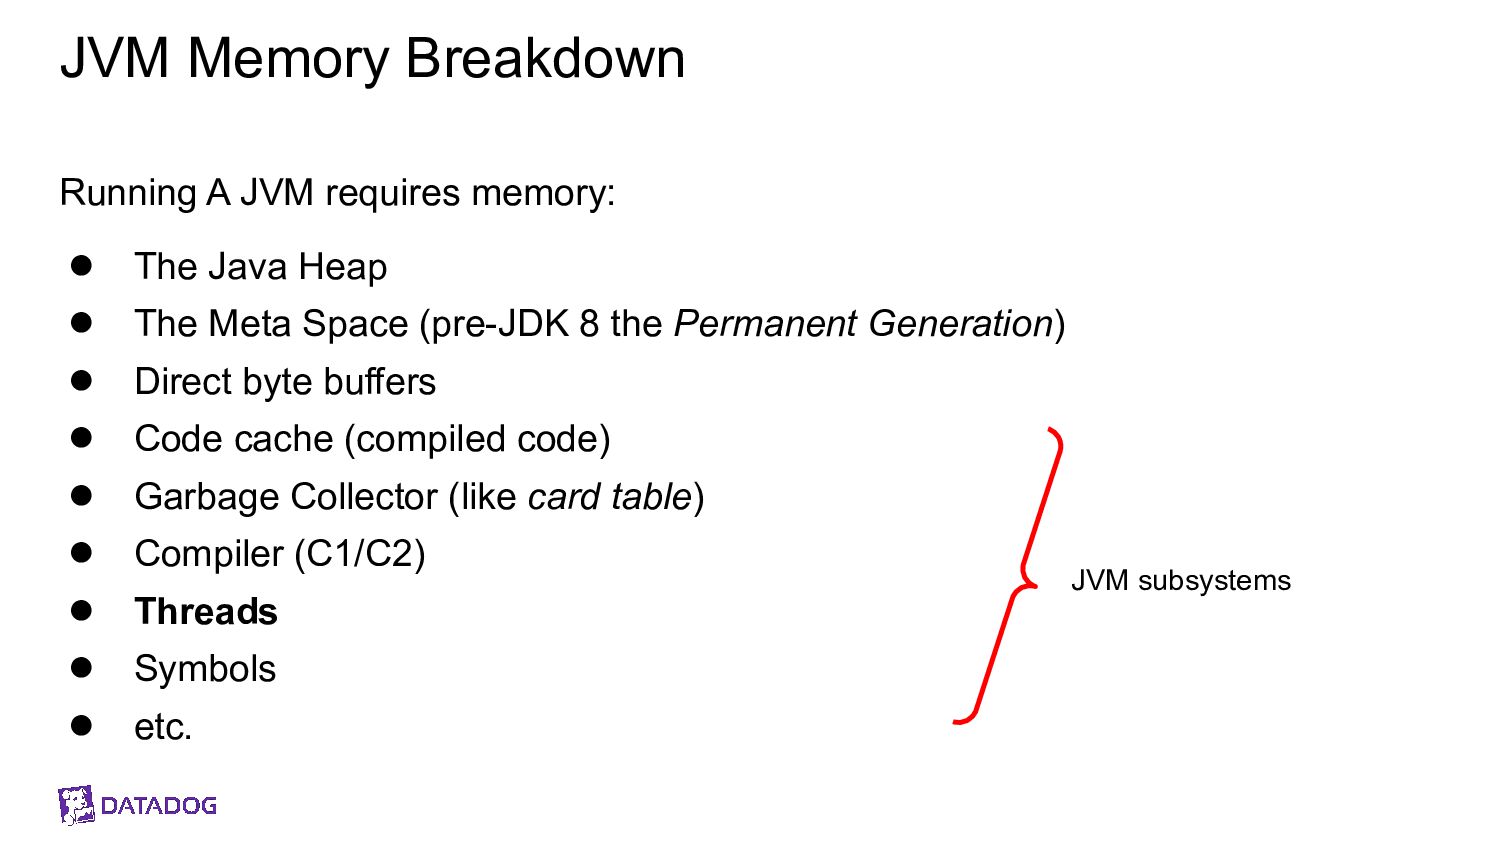
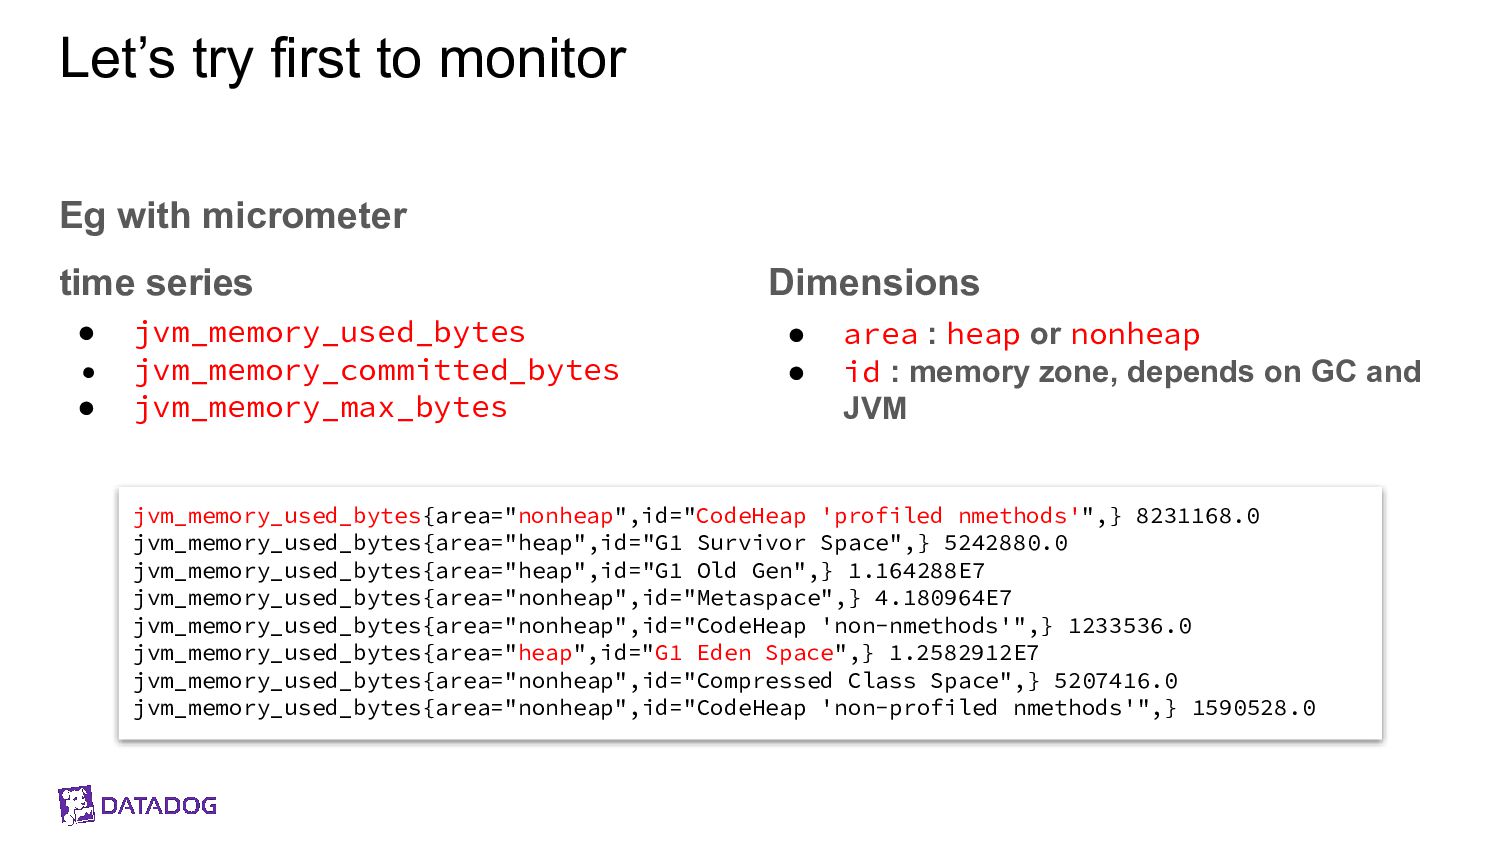
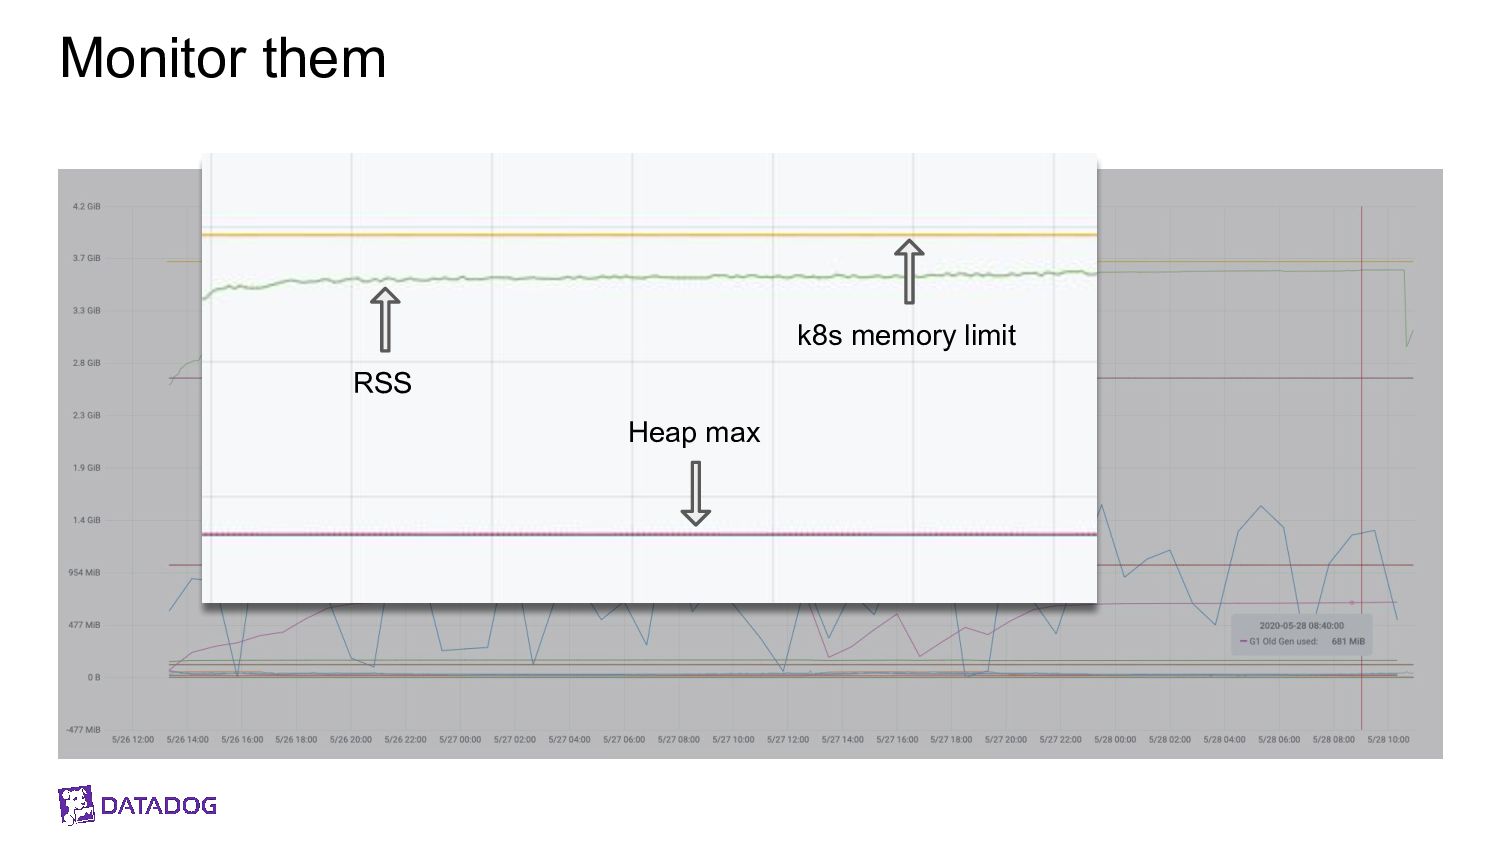
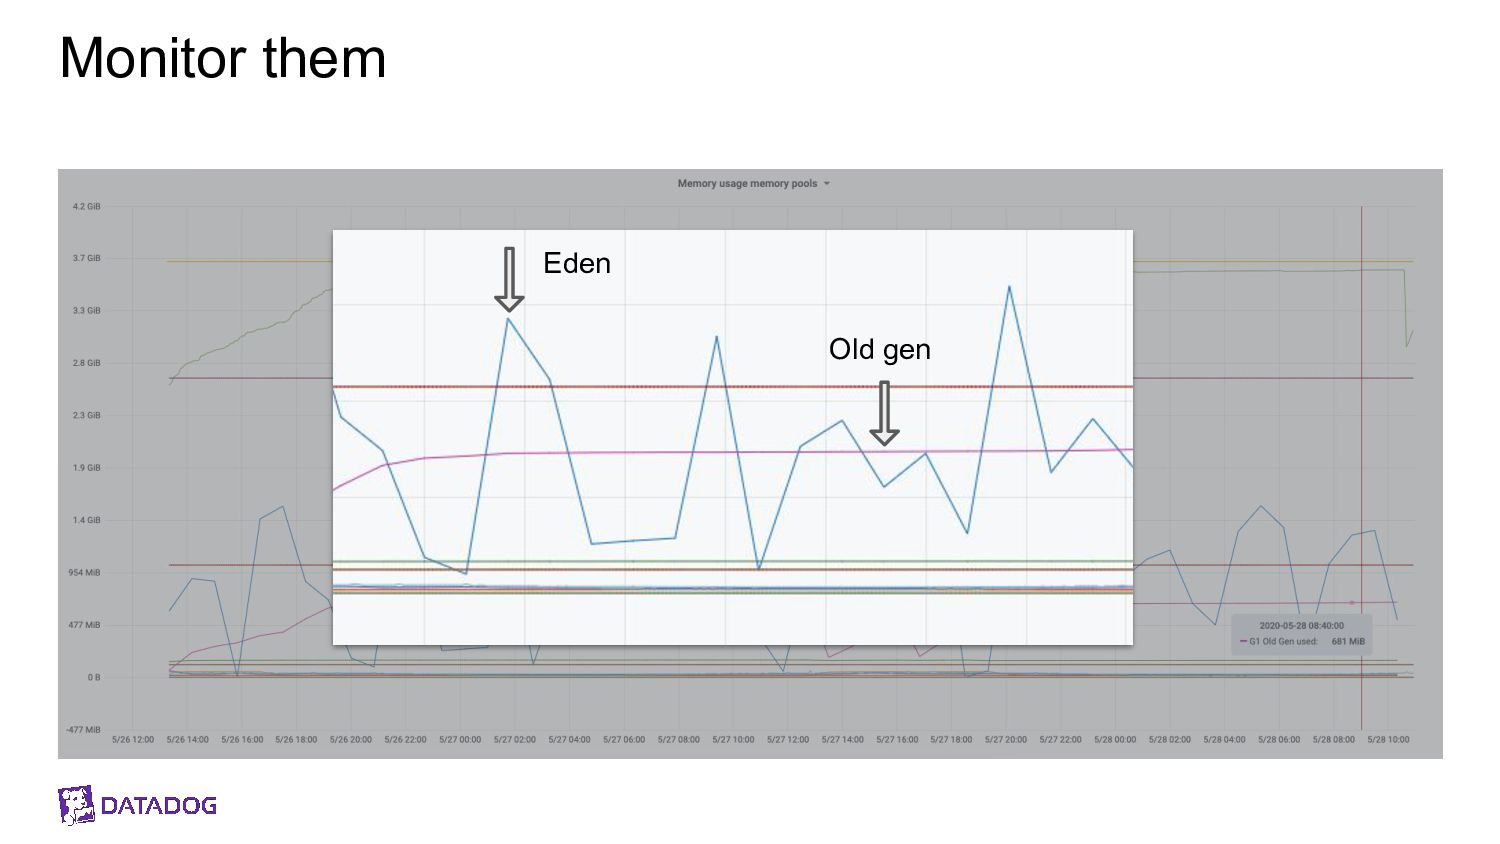
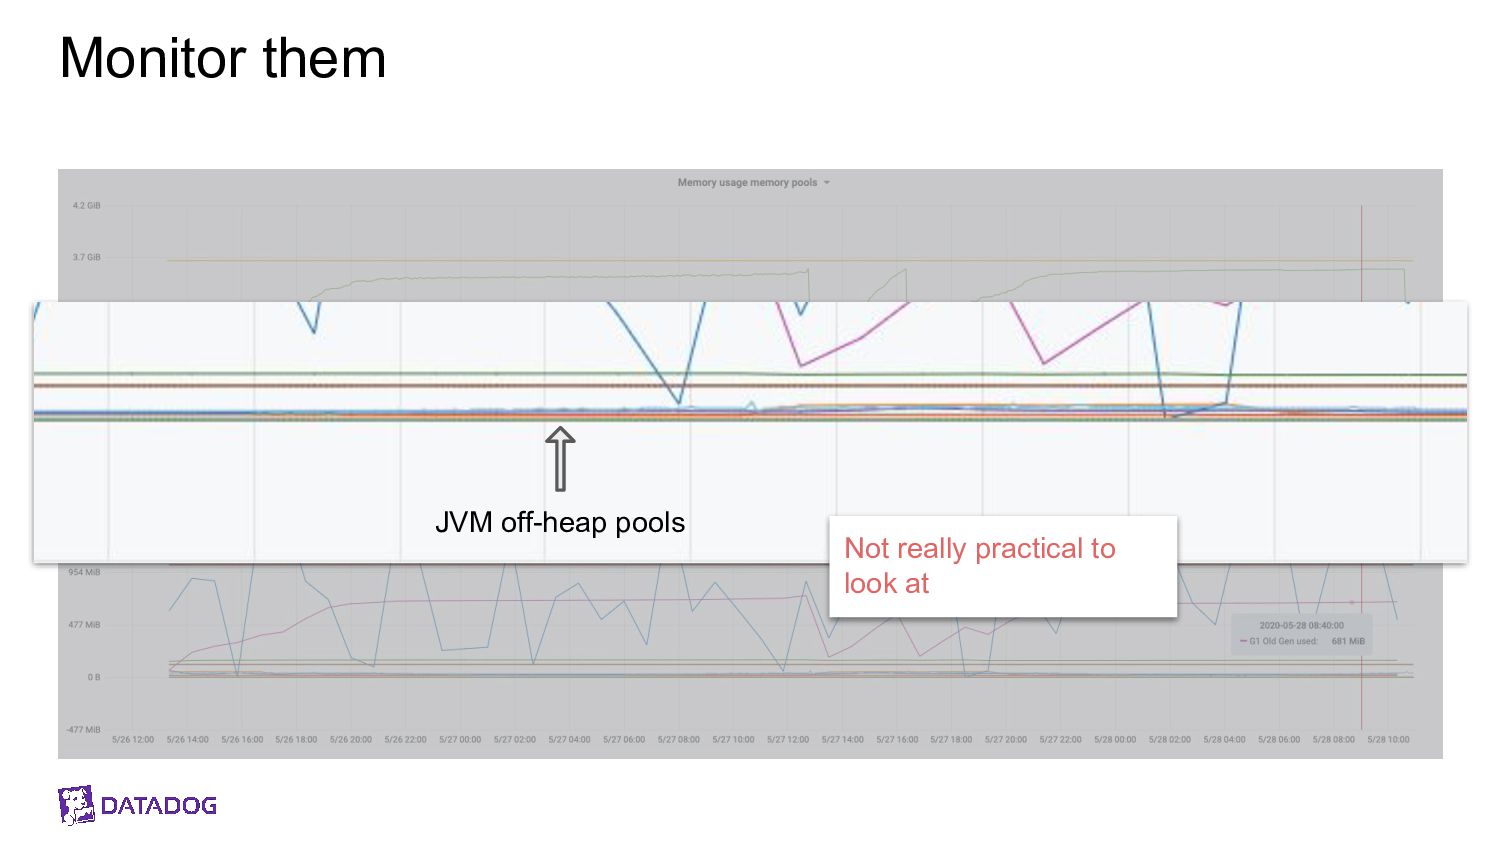
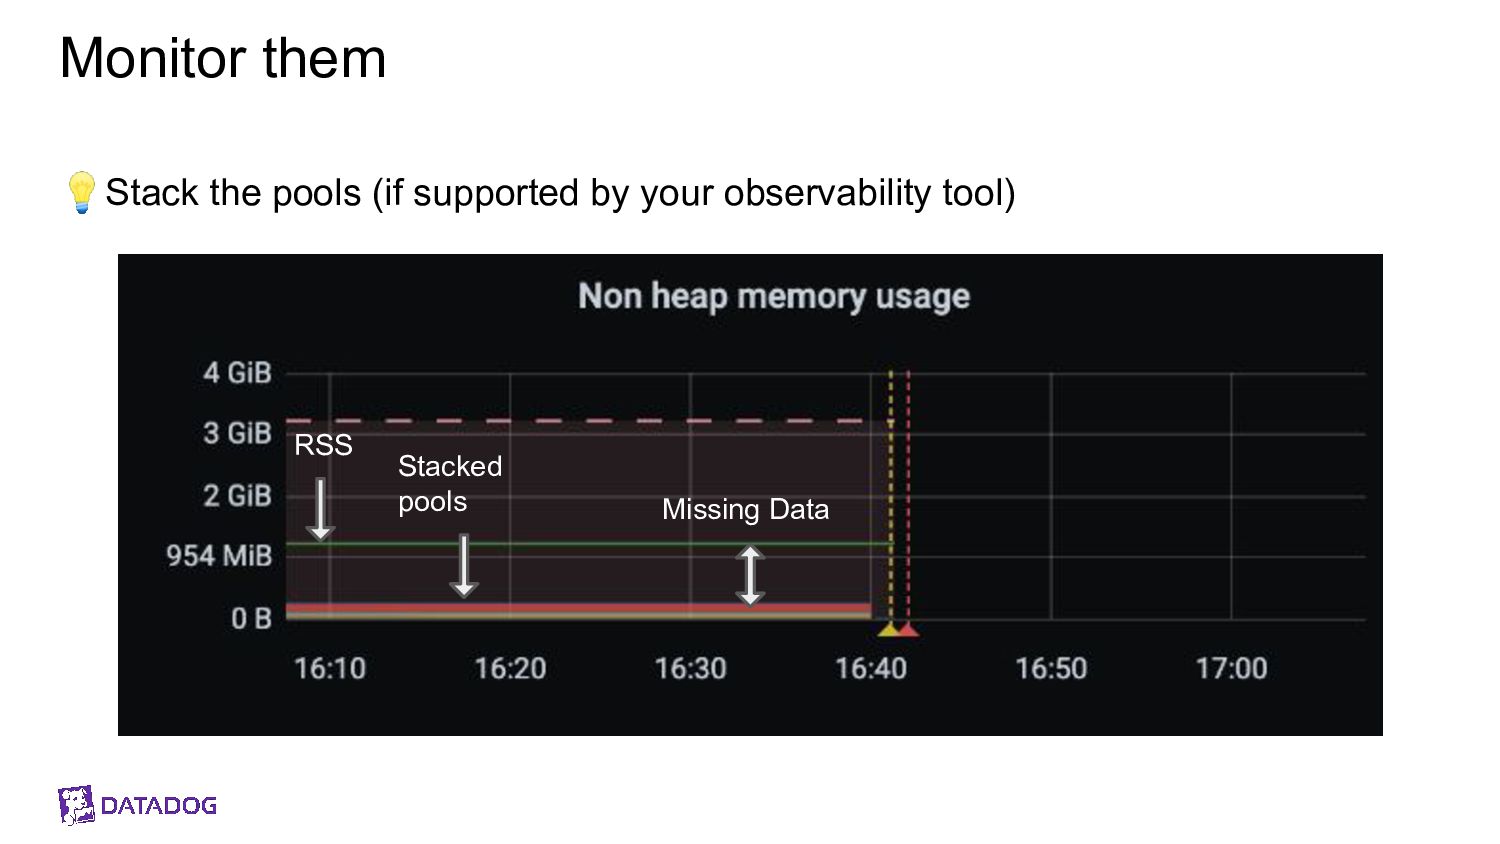
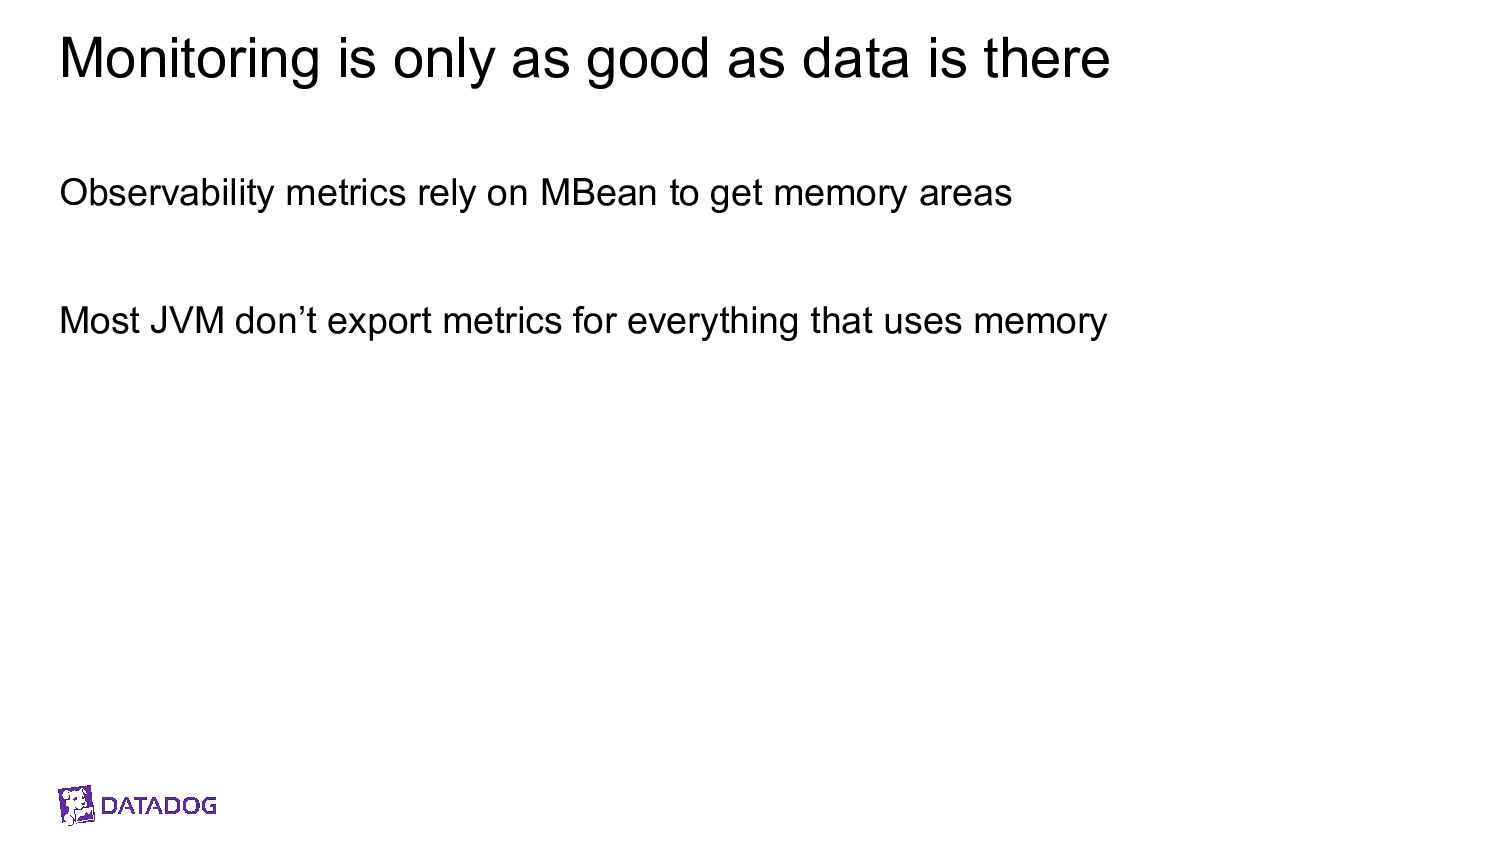
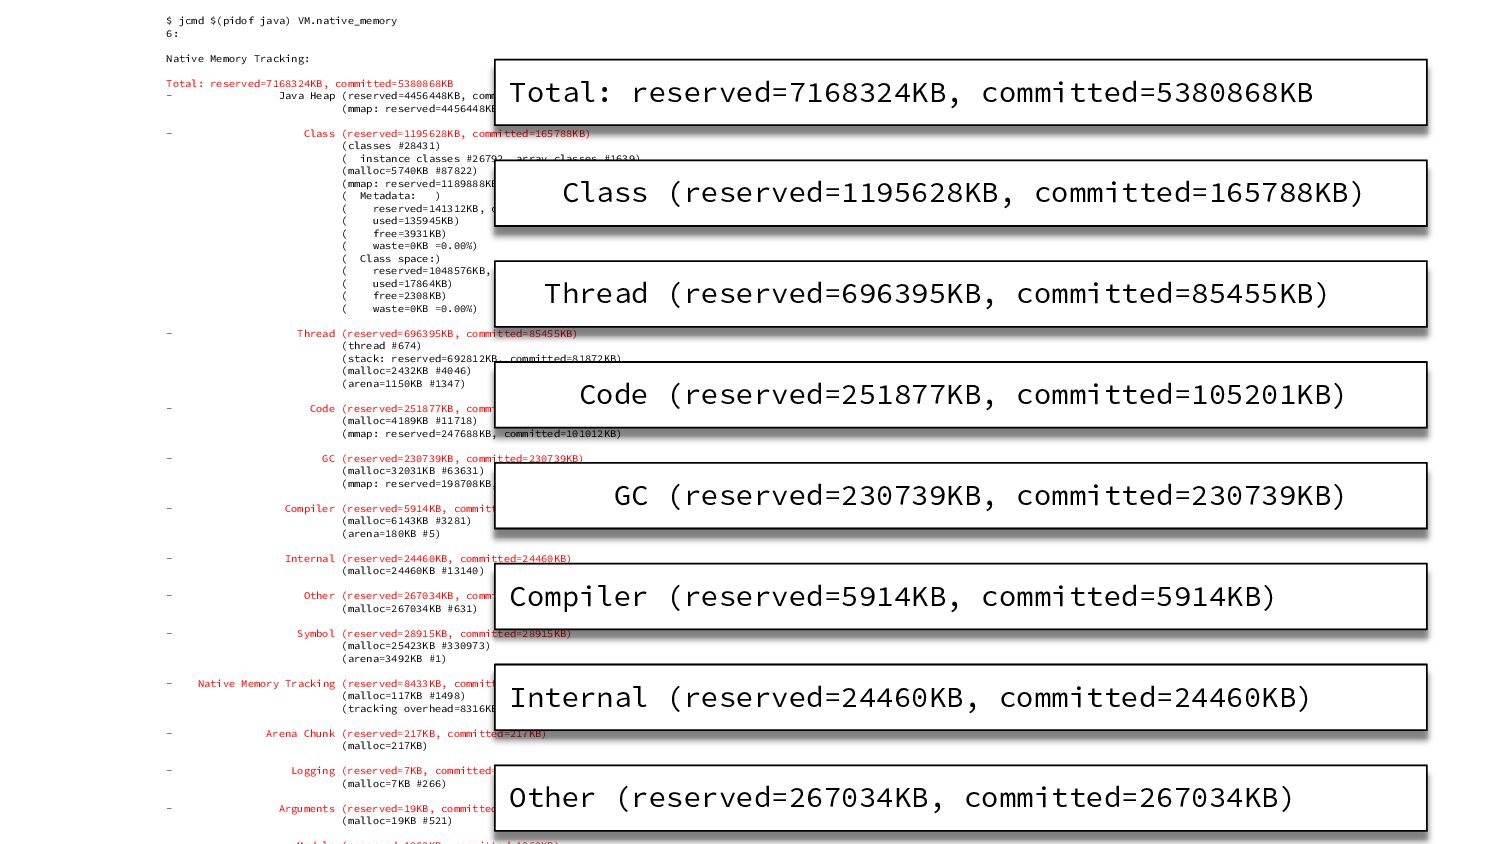
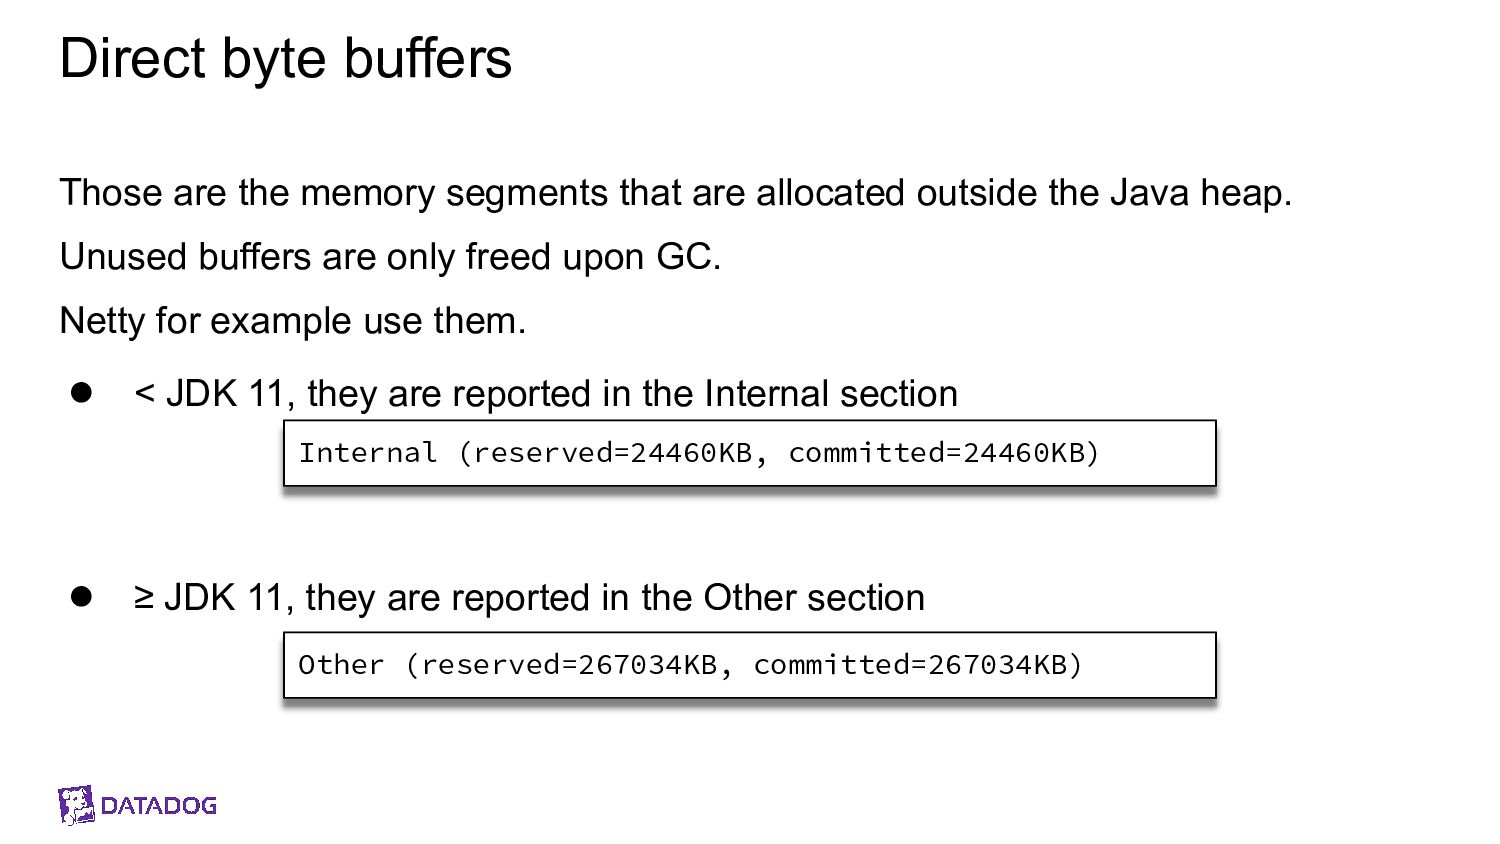
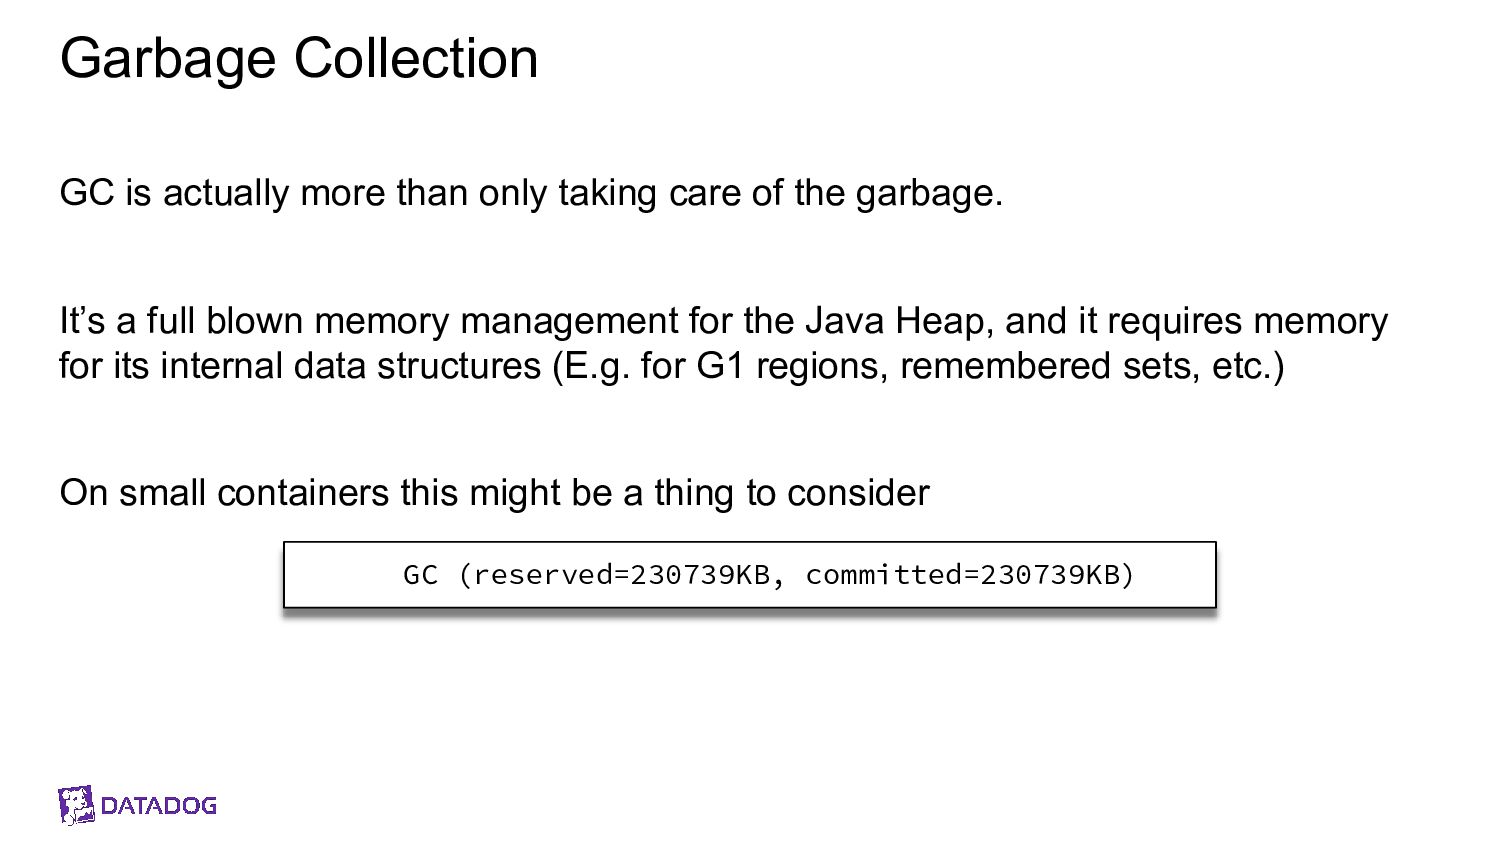
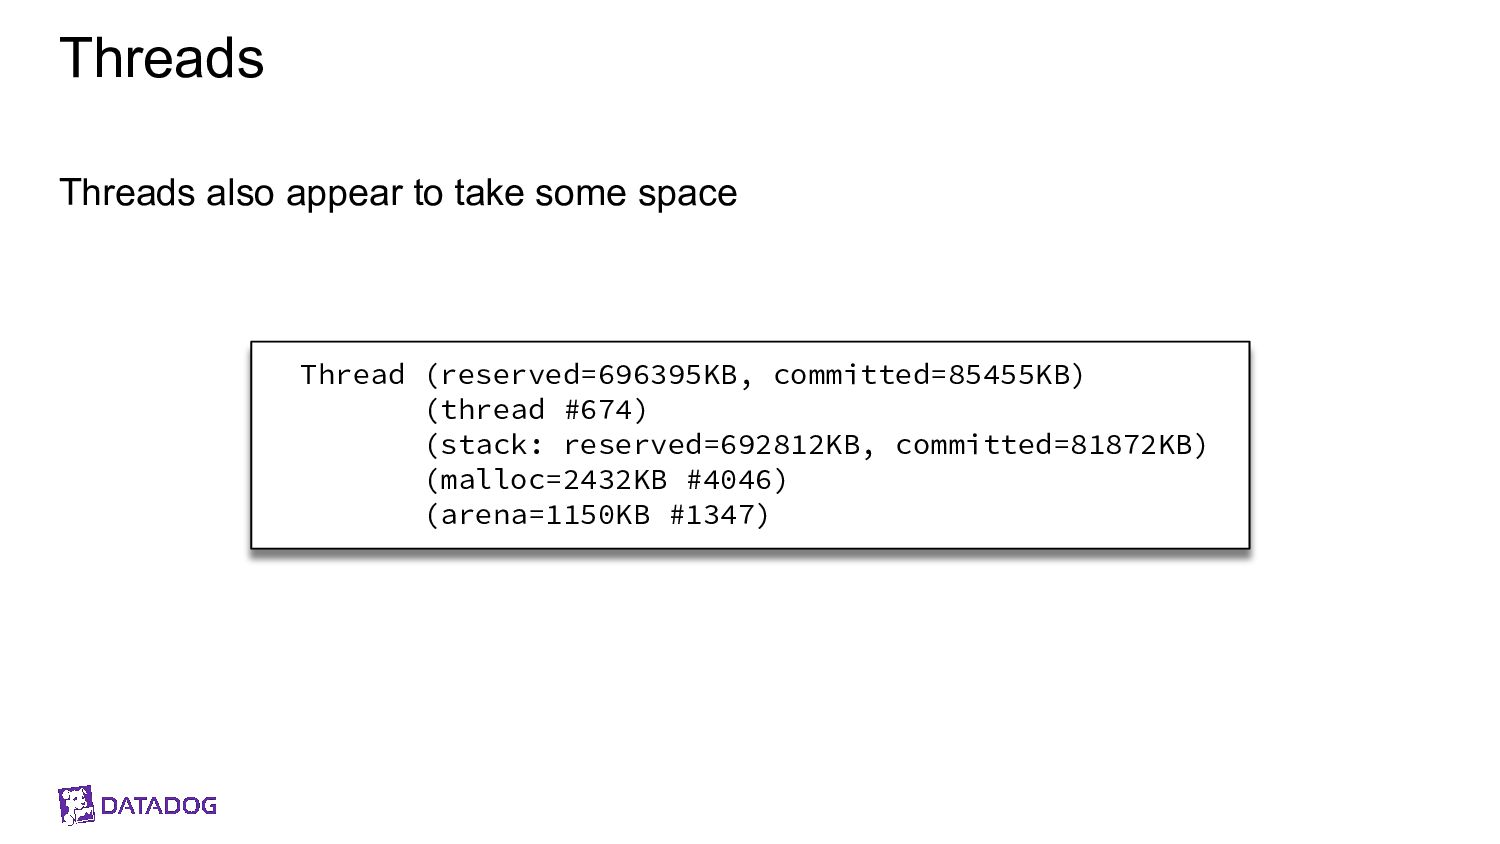
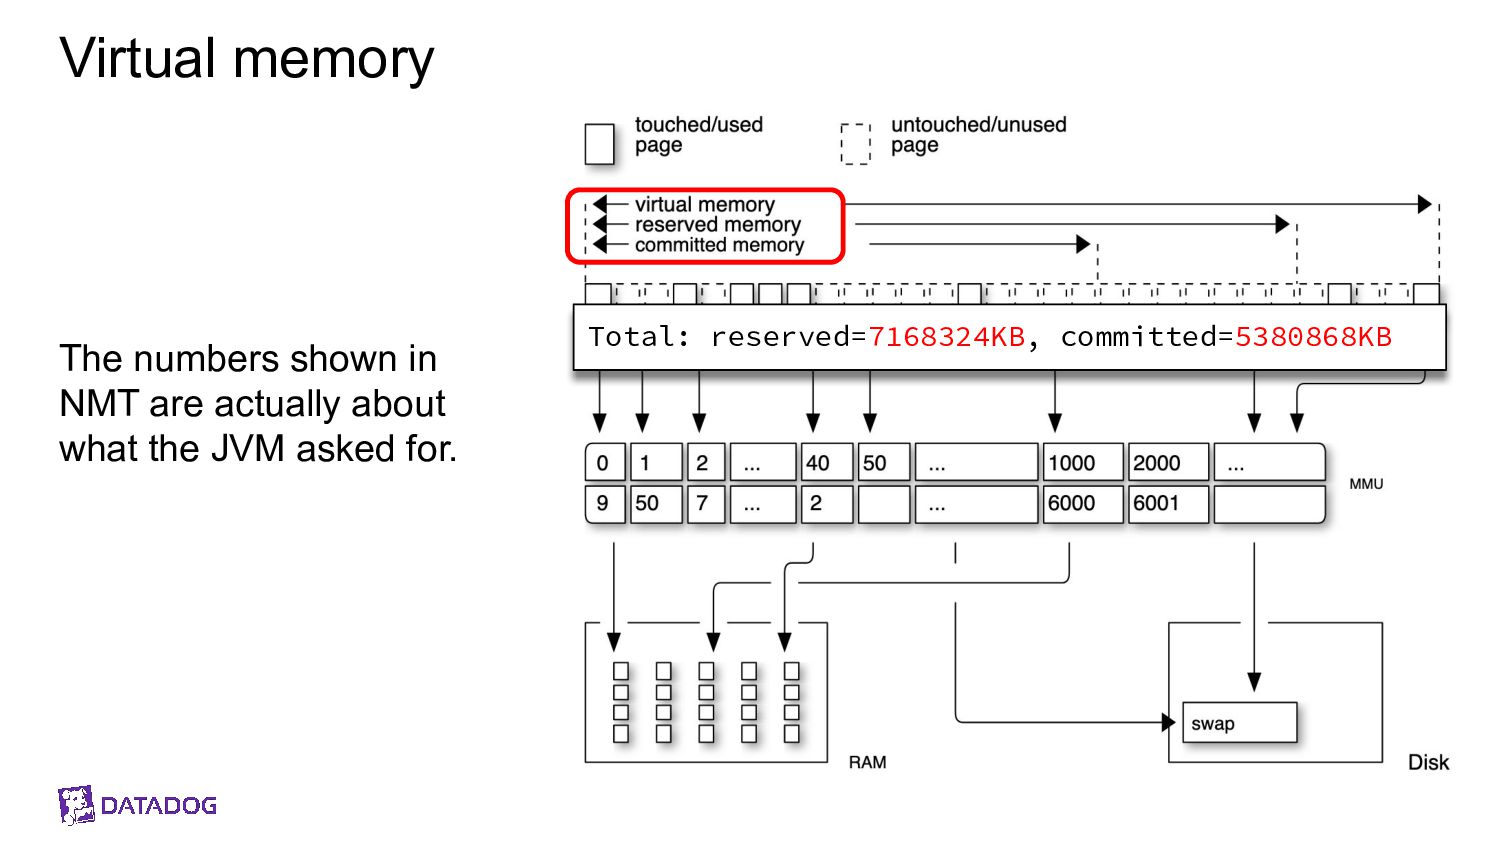
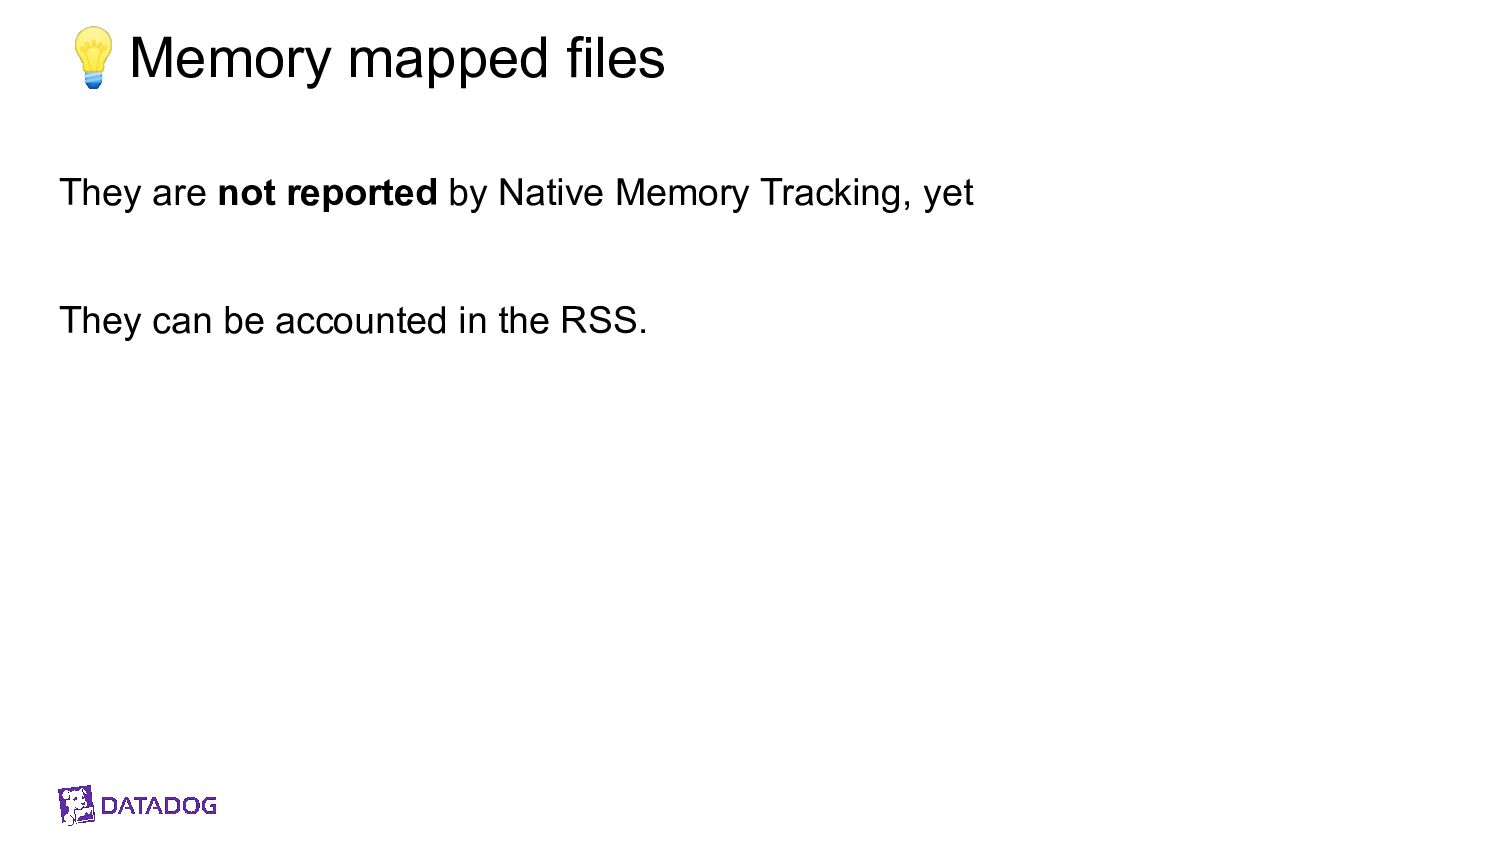
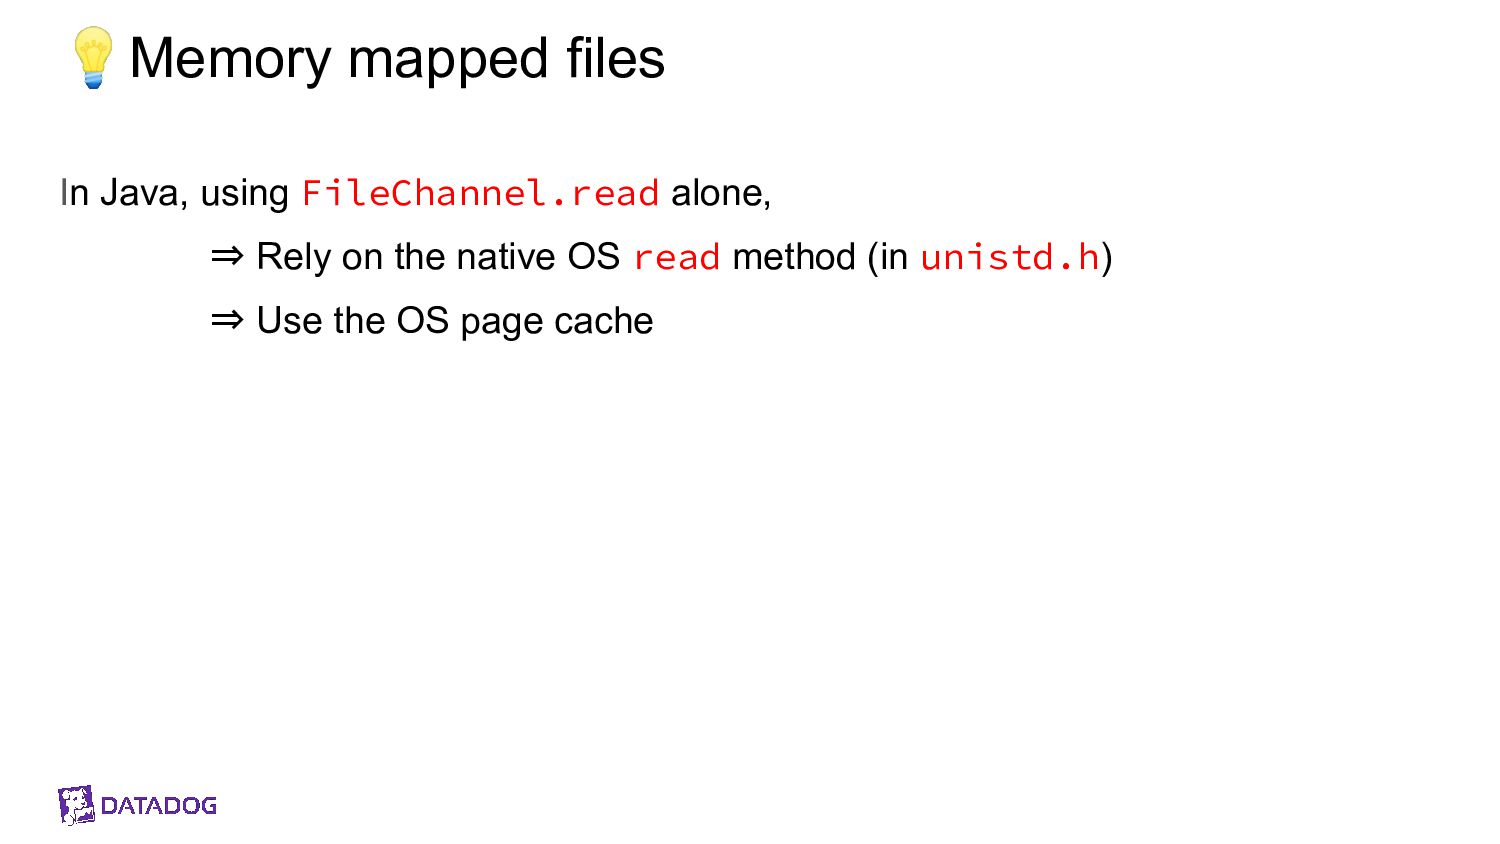
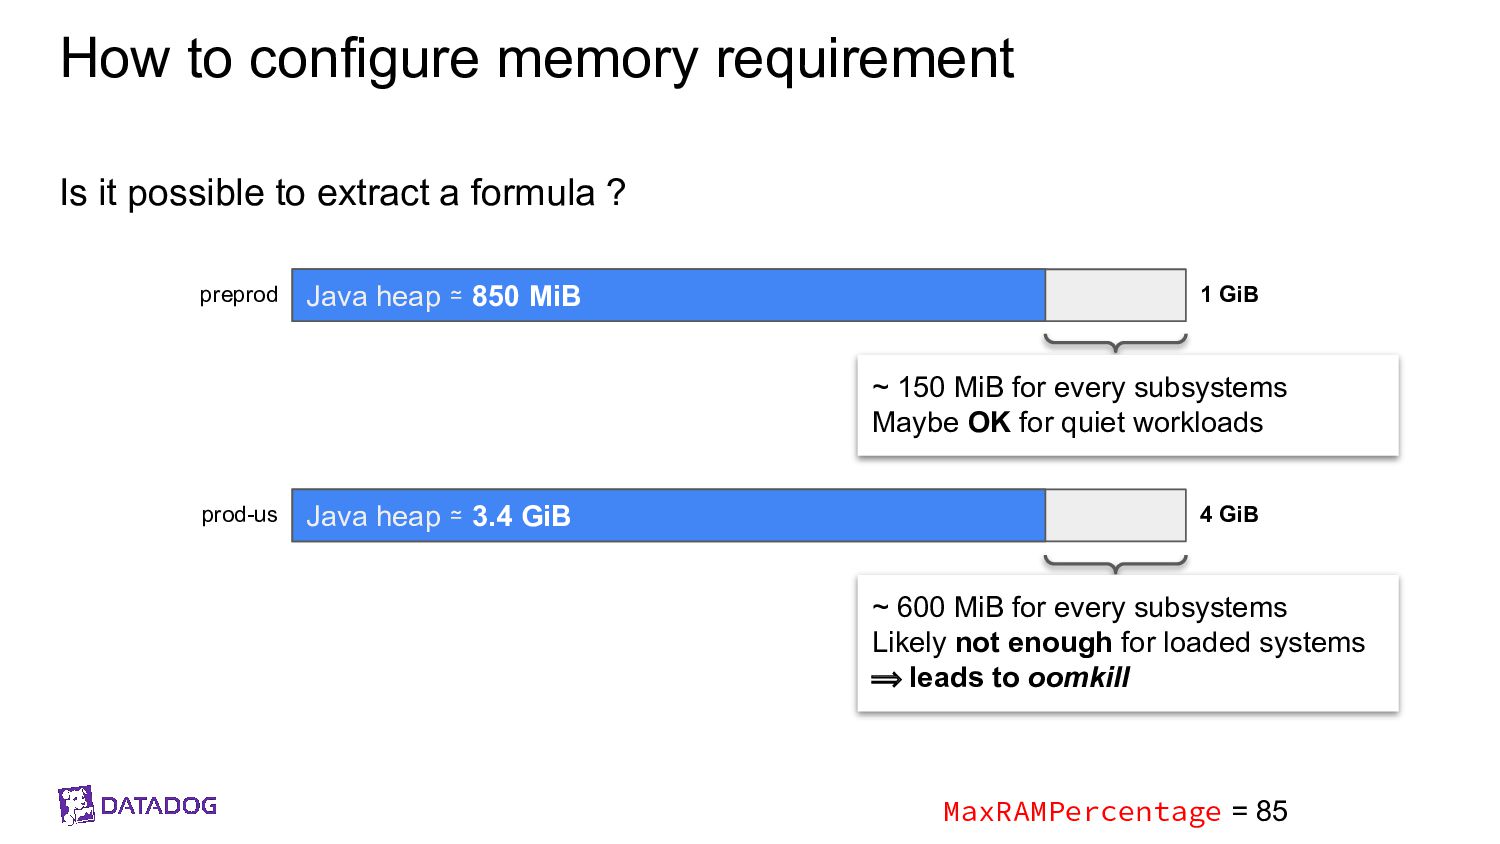
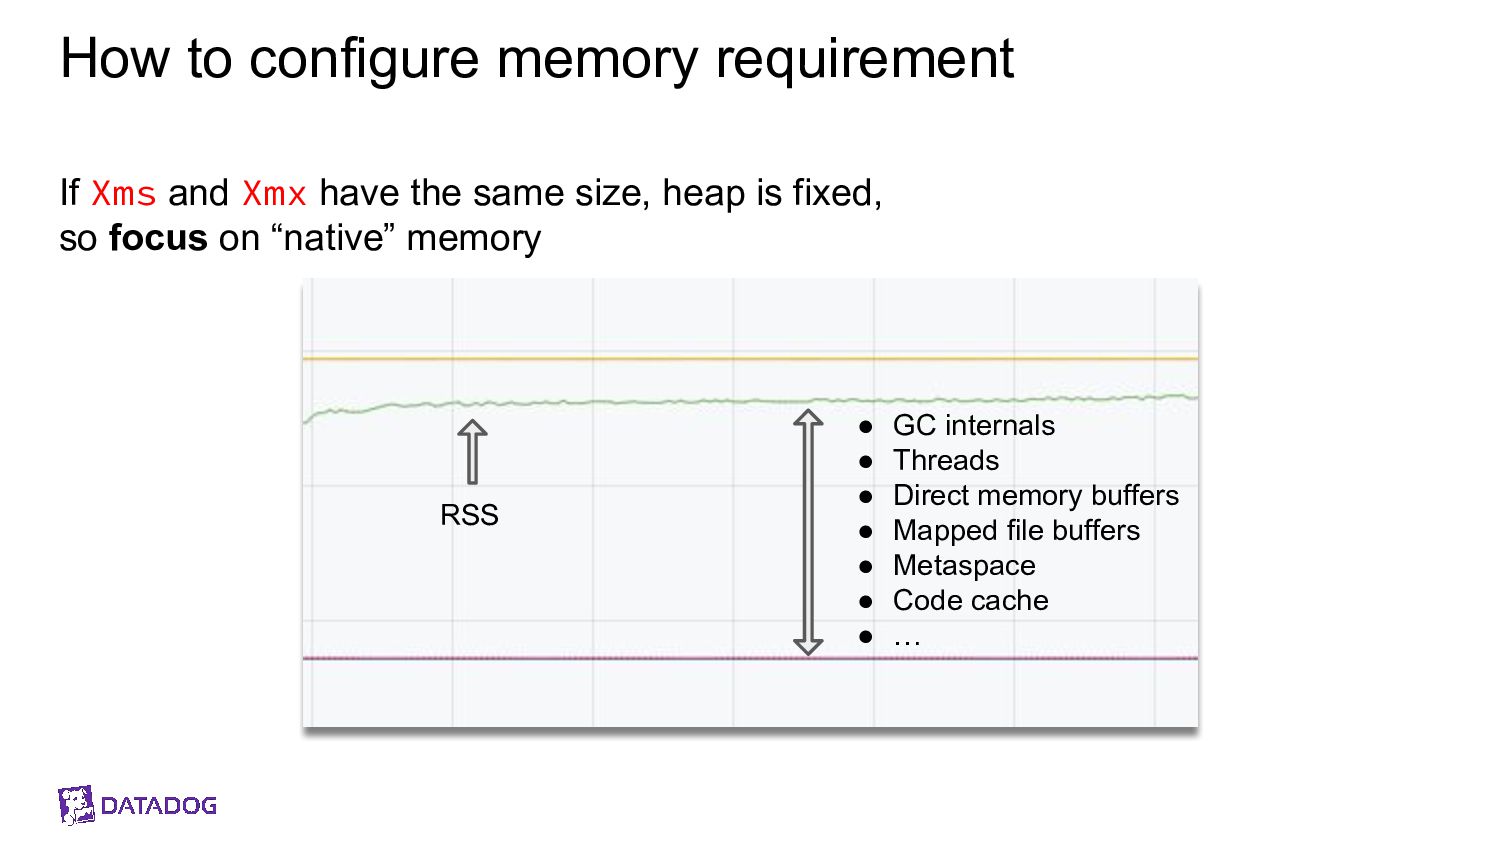
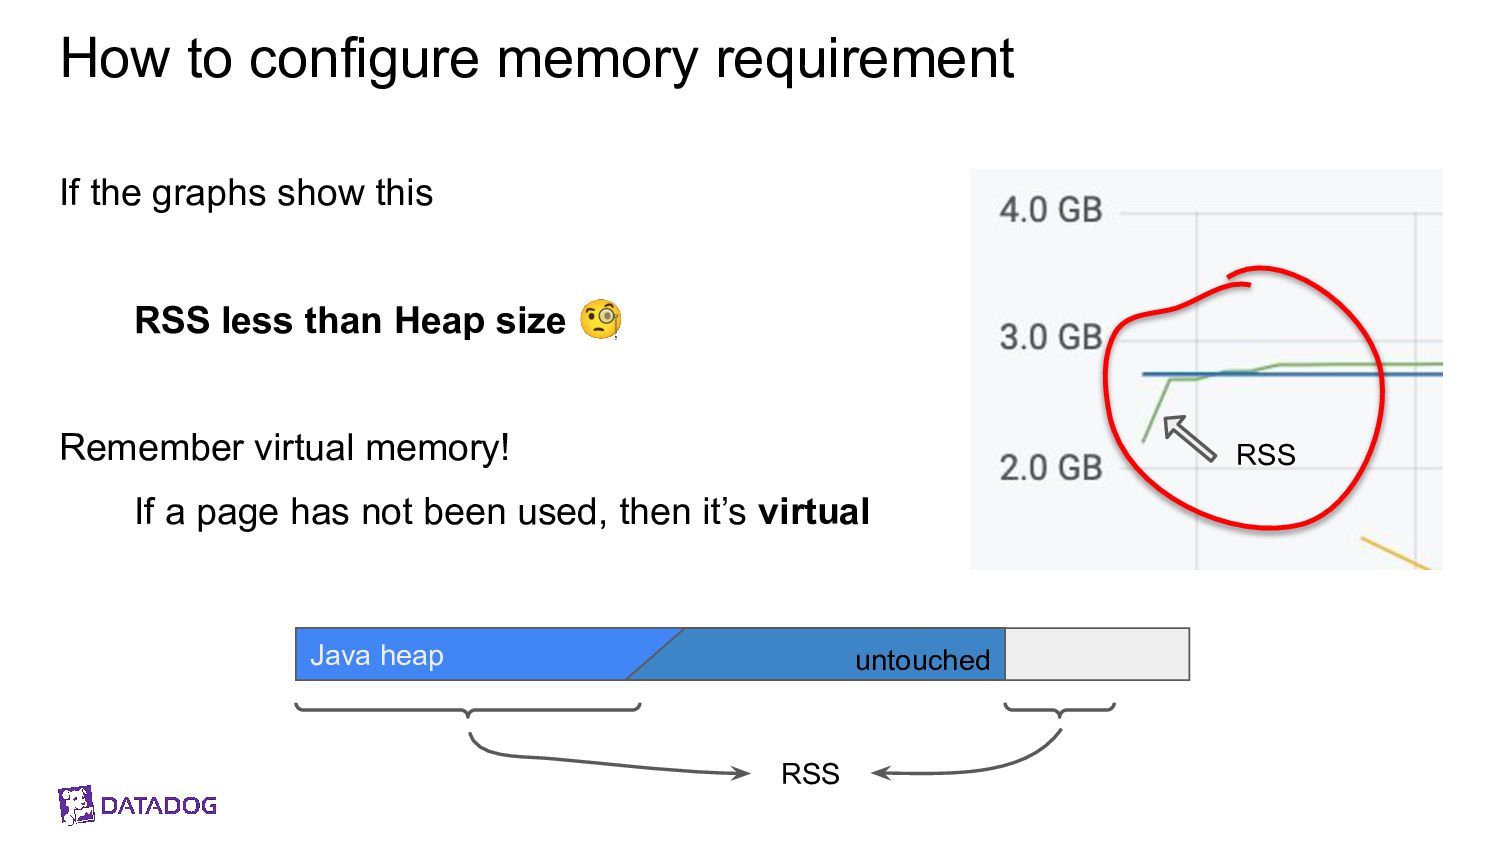
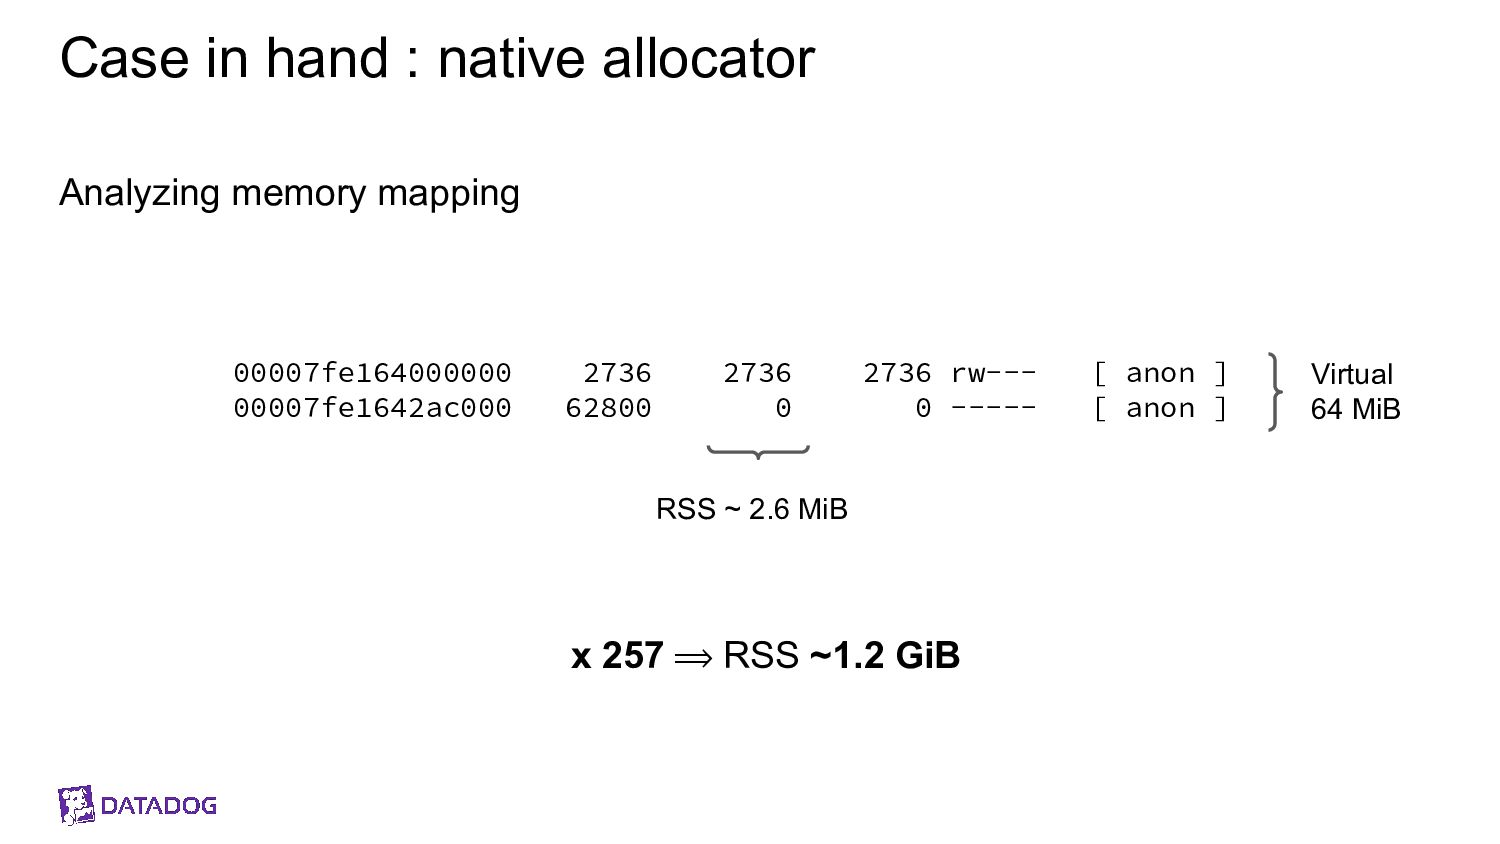
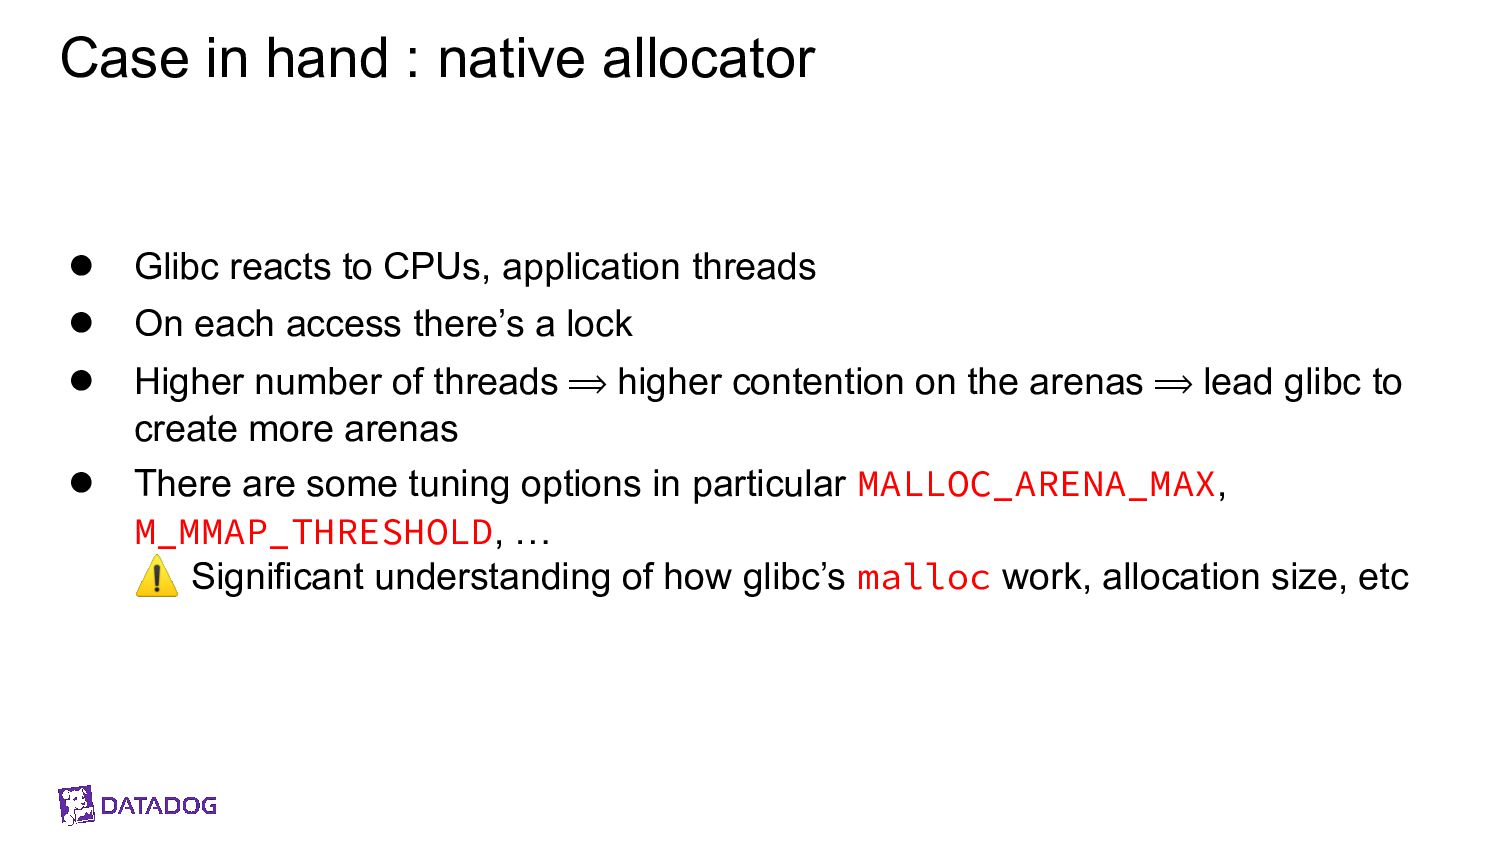
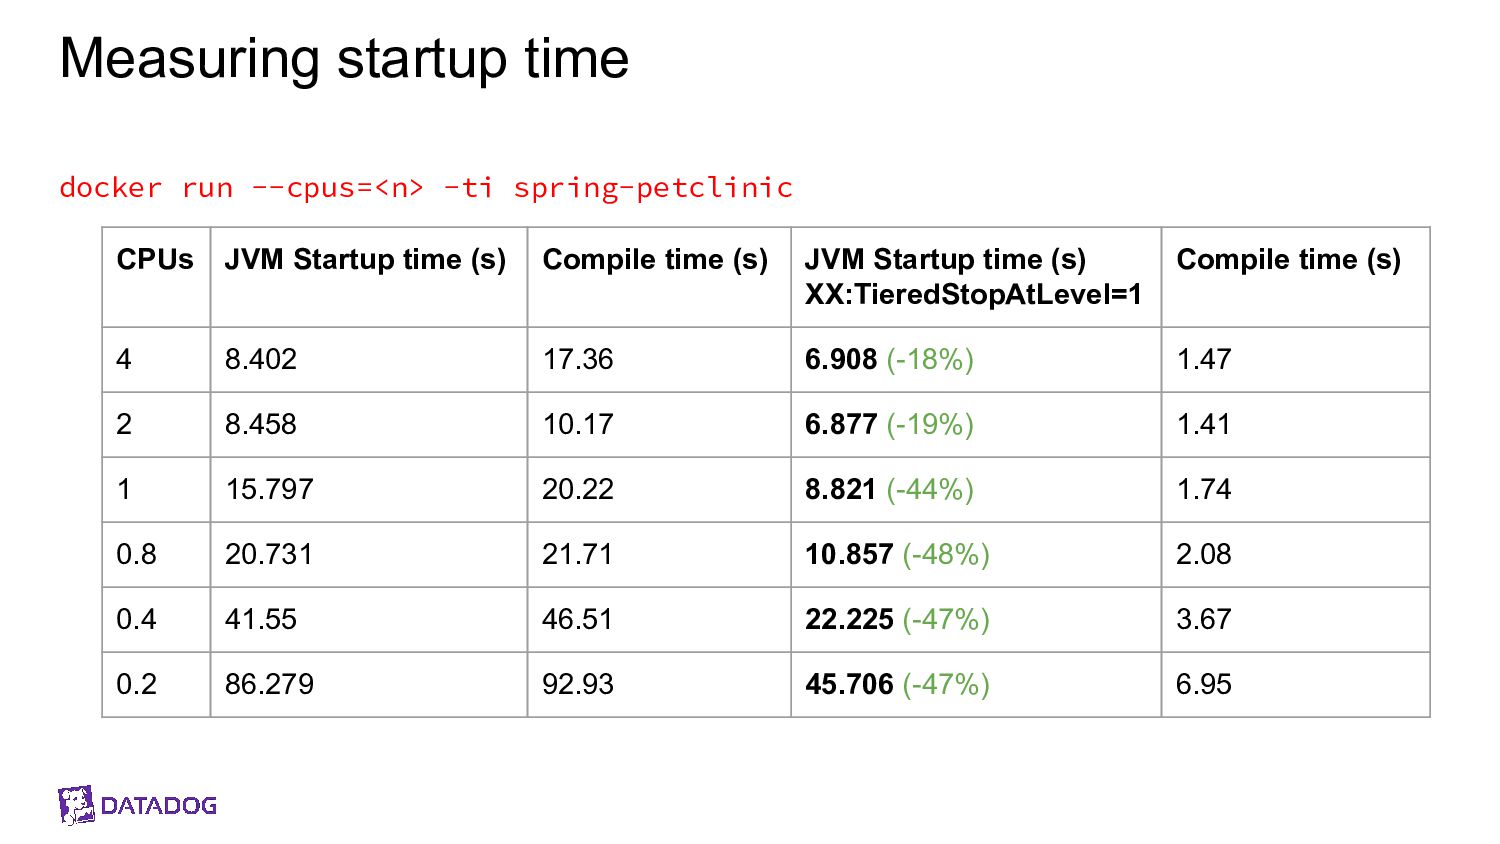
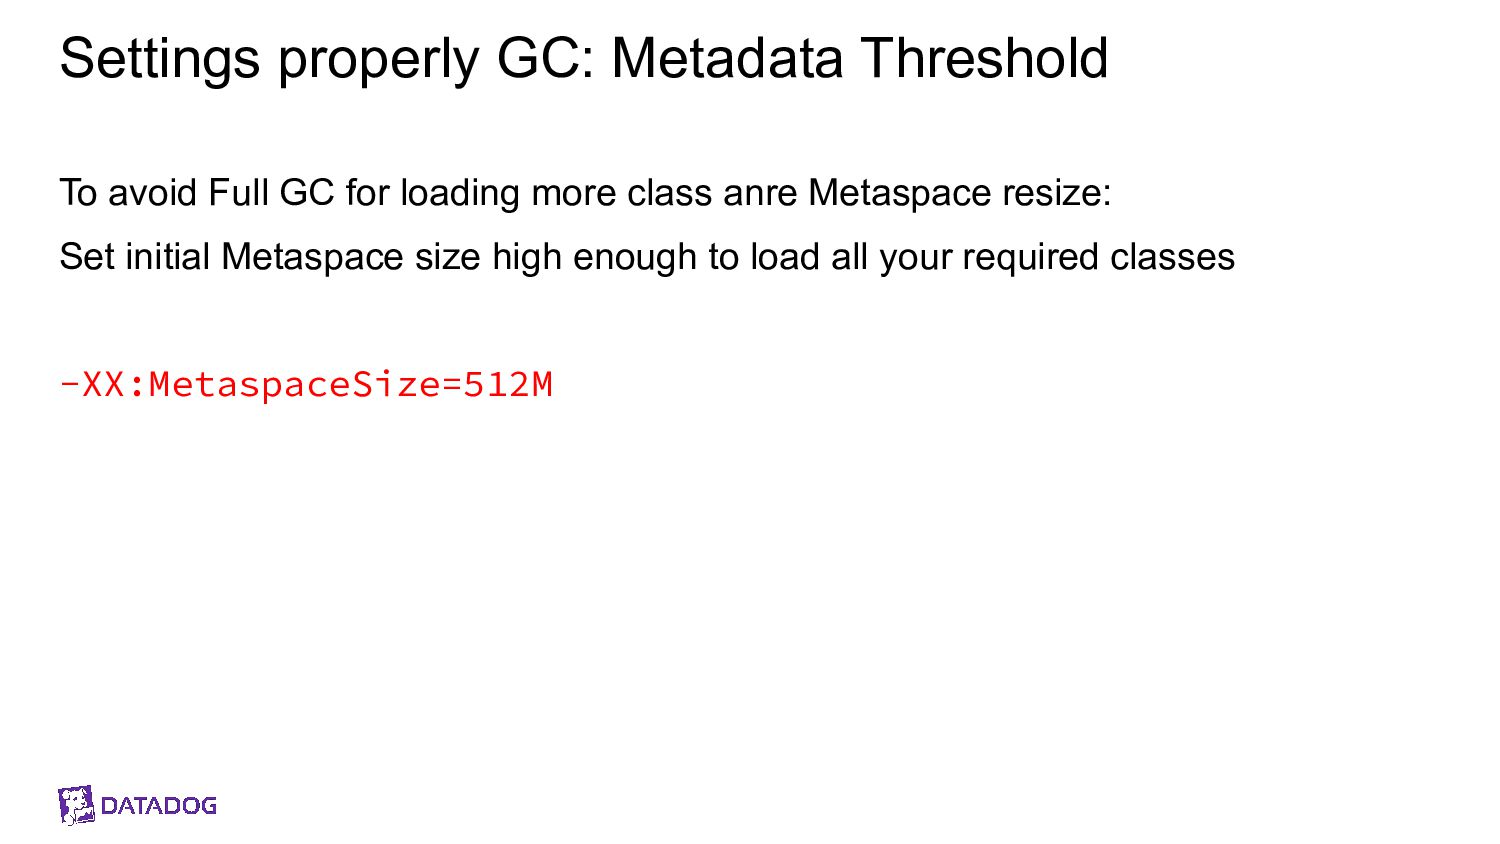
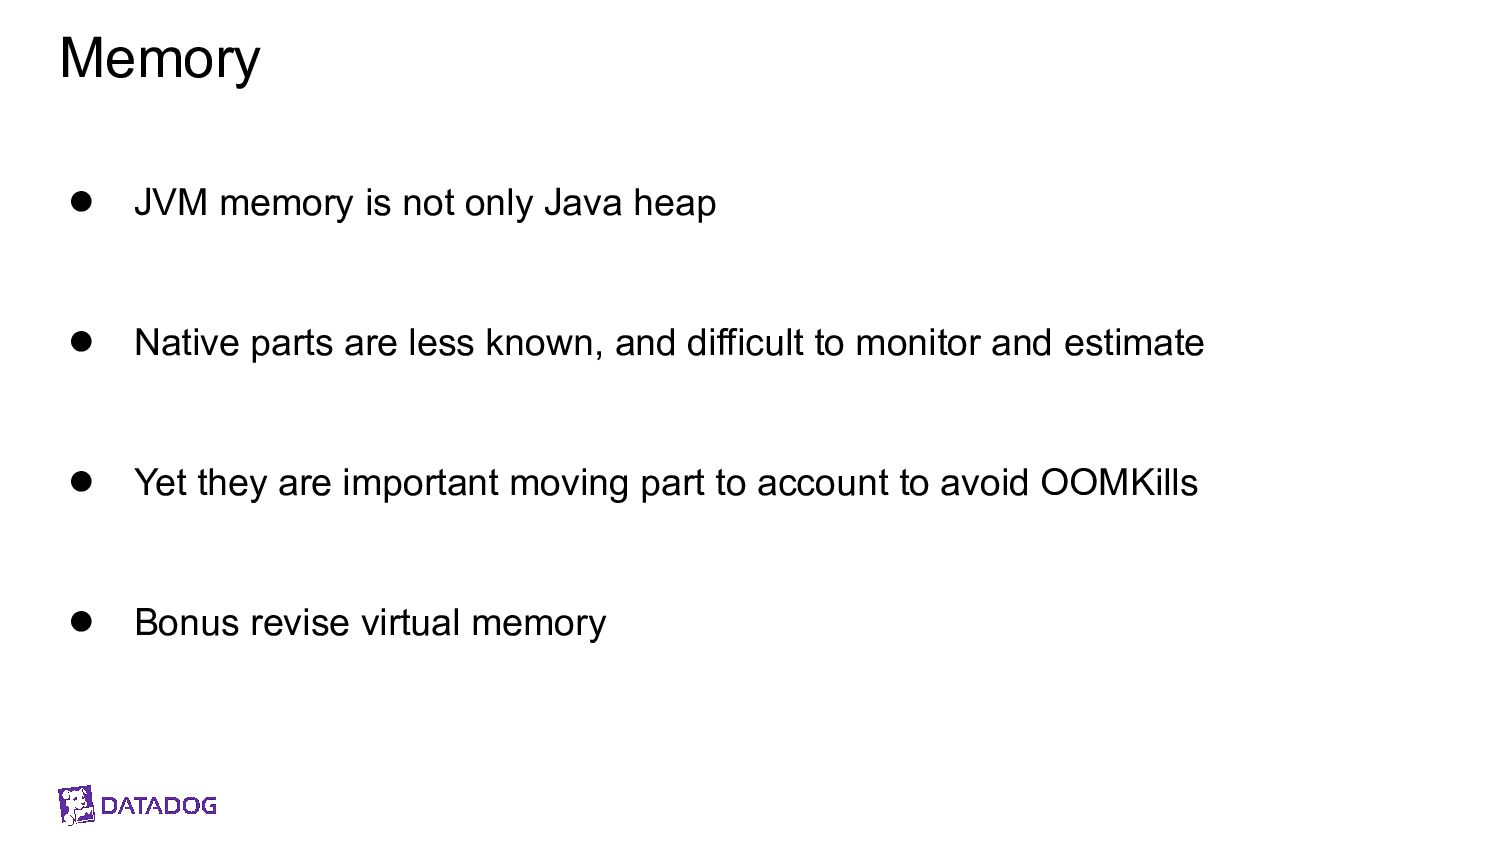
Il y a un espace entre la heap Java et le RSS : c’est la mémoire off-heap et elle se décompose en plusieurs zones. À quoi servent-elles ? Comment les prendre en compte ? La configuration du CPU impacte la JVM sur divers aspects : Quelles sont les influences entre le GC et le CPU ? Que choisir entre la rapidité ou la consommation CPU au démarrage ?

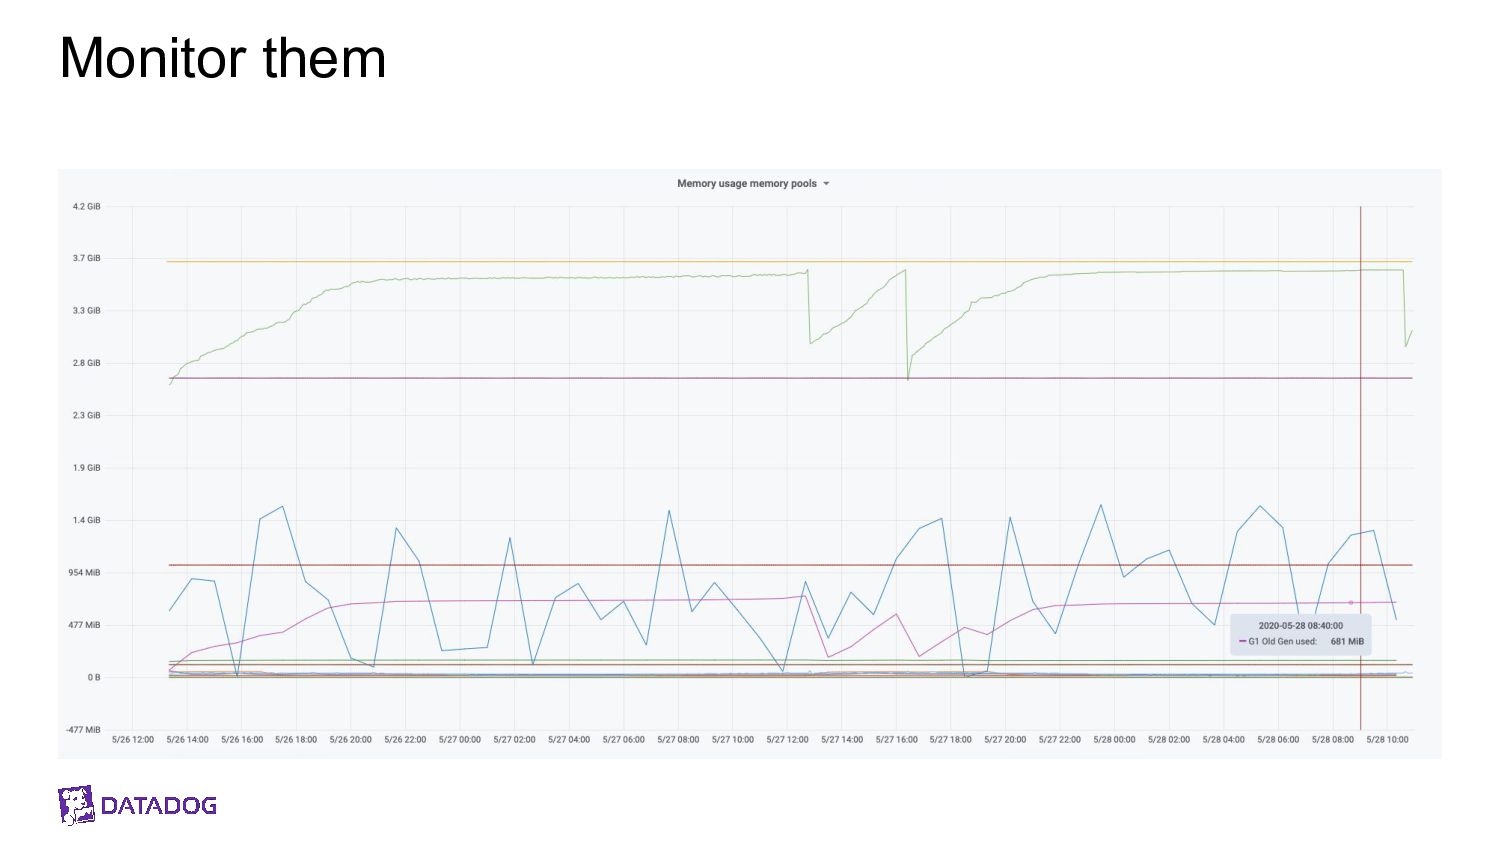
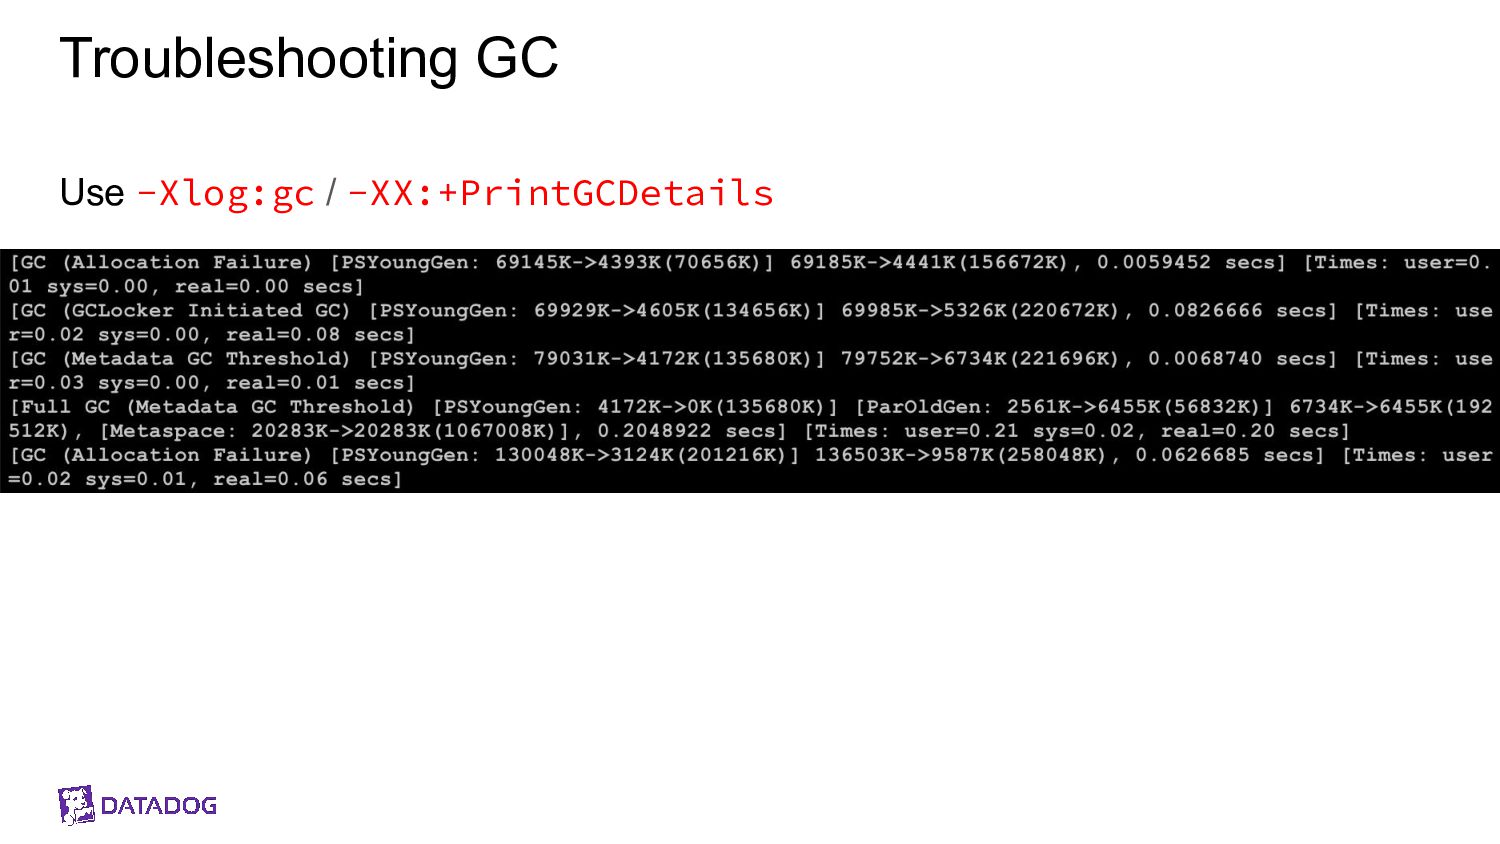
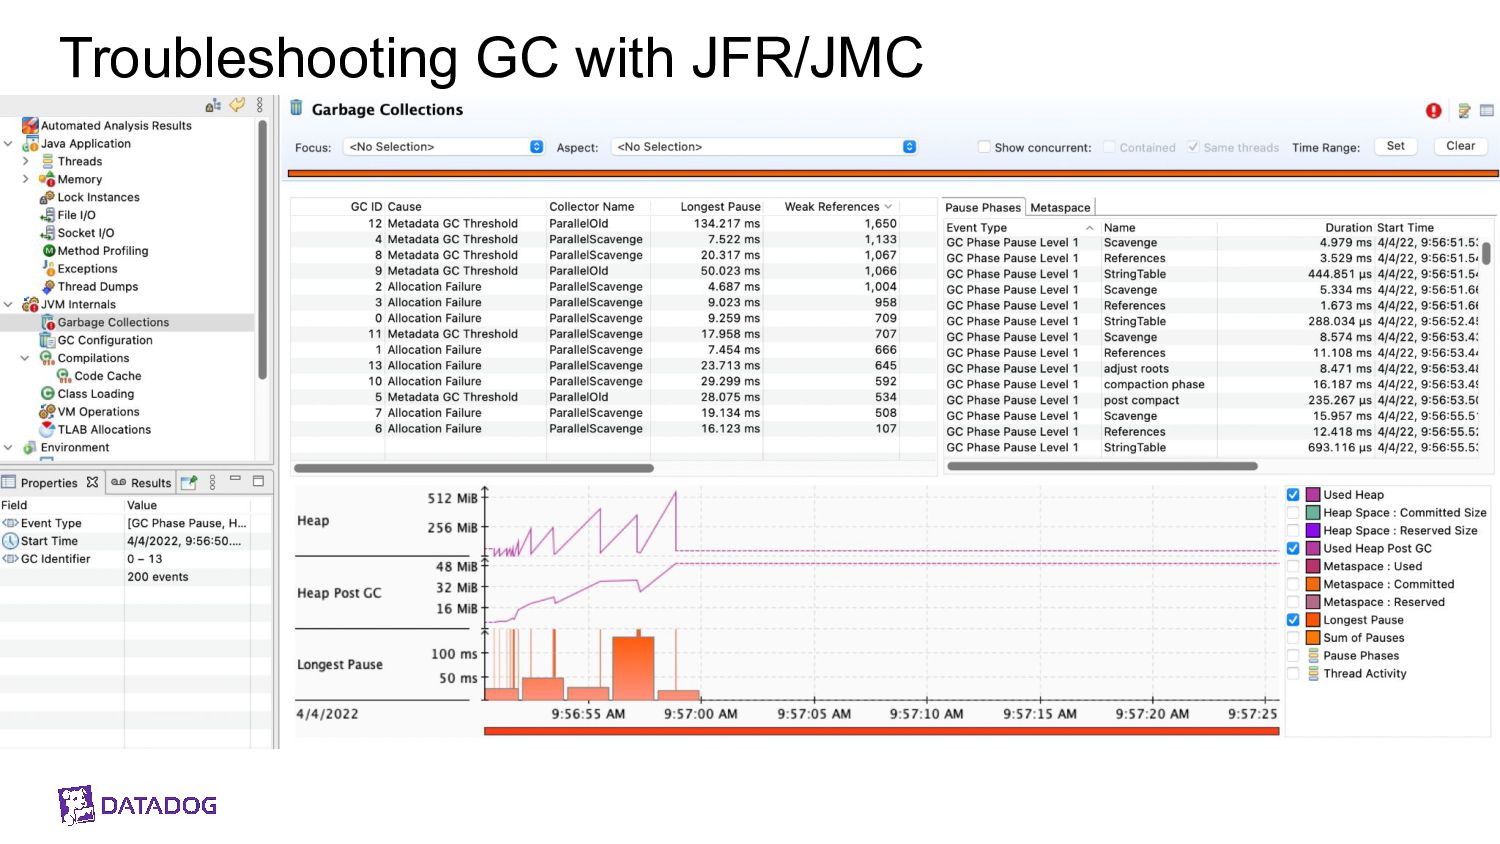
Au cours de cette université nous verrons comment diagnostiquer, comprendre et remédier à ces problèmes.

Brice Dutheil

April 20, 2022
Tweet

More Decks by Brice Dutheil

Other Decks in Programming

Transcript

  1. Remèdes
    aux oomkill, warm-ups,
    et lenteurs pour des conteneurs JVM

    View Slide

  2. Orateurs
    Brice Dutheil
    @BriceDutheil
    Jean-Philippe Bempel
    @jpbempel

    View Slide

  3. Agenda
    My container gets oomkilled
    How does the memory actually work
    Some case in hands
    Container gets respawned
    Things that slow down startup
    Break

    View Slide

  4. The containers are restarting.
    What’s going on ?
    $ kubectl get pods
    NAME READY STATUS RESTARTS AGE
    my-pod-5759f56c55-cjv57 3/3 Running 7 3d1h

    View Slide

  5. The containers are restarting.
    What’s going on ?
    On Kubernetes, one should inspect the suspicious pod
    $ kubectl describe pod my-pod-5759f56c55-cjv57
    ...
    State: Running
    Started: Mon, 06 Jun 2020 13:39:40 +0200
    Last State: Terminated
    Reason: OOMKilled
    Exit Code: 137
    Started: Thu, 06 Jun 2020 09:20:21 +0200
    Finished: Mon, 06 Jun 2020 13:39:38 +0200

    View Slide

  6. My container gets oomkilled

    View Slide

  7. 🔥 🔥
    🔥🔥
    🔥
    🔥
    🔥
    🚨 Crisis mode 🚨
    If containers are oomkilled
    Just increase the container memory limits
    and investigate later

    View Slide

  8. Monitor and setup alerting

    View Slide

  9. Monitor the oomkills
    In Kubernetes cluster monitor the terminations with metrics
    ● kube_pod_container_status_last_terminated_reason, if the exit
    code is 137, the attached reason label will be set to OOMKilled
    ● Trigger an alert by coupling with
    kube_pod_container_status_restarts_total

    View Slide

  10. Monitor the resident memory of a process
    RSS
    Heap Max
    Heap Liveset
    memory limit

    View Slide

  11. Monitor the resident memory of a process
    Depending on the telemetry libraries (eg Micrometer) you may have those
    ● Heap Max : jvm_memory_max_bytes
    ● Heap Live : jvm_memory_bytes_used
    ● Process RSS : process_memory_rss_bytes
    And system ones, eg Kubernetes metrics
    ● Container RSS : container_memory_rss
    ● Memory limit : kube_pod_container_resource_limits_memory_bytes

    View Slide

  12. 💡 Pay attention to the unit
    Difference between 1 MB and 1 MiB ?

    View Slide

  13. 💡 Pay attention to the unit
    The SI notation, decimal based :
    1 MB reads as megabyte and means 1000² bytes
    The IEC notation, binary based :
    1 MiB reads as mebibyte and means 1024² bytes
    ⚠ The JVM uses the binary notation,
    but uses the legacy units KB, MB, etc.
    OS command line tools generally use
    the binary notation.
    https://en.wikipedia.org/wiki/Binary_prefix#/media/File:Binaryvdecimal.svg
    At gigabyte scale
    the difference is almost 7%
    1GB ≃ 0.93 GiB

    View Slide

  14. Oomkilled ?

    View Slide

  15. Oomkilled ?
    Is it a memory leak ?
    Is it misconfiguration ?

    View Slide

  16. Linux Oomkiller
    ● Out Of Memory Killer
    Linux mechanism employed to kill processes when the memory is critically
    low
    ● For regular processes the oomkiller selects the bad ones.
    ● Within a restrained container, i.e. with memory limits,
    ○ If available memory reaches 0 in this container then the oomkiller
    terminates all processes
    ○ There is usually a single process in container

    View Slide

  17. Linux oomkiller
    Oomkills can be reproduced synthetically
    docker run --memory-swap=100m --memory=100m \
    --rm -it azul/zulu-openjdk:11 \
    java -Xms100m -XX:+AlwaysPreTouch --version

    View Slide

  18. Linux oomkiller
    And in the system logs
    $ tail -50 -f $HOME/Library/Containers/com.docker.docker/Data/log/vm/console.log
    ...
    [ 6744.445271] java invoked oom-killer: gfp_mask=0xcc0(GFP_KERNEL), order=0, oom_score_adj=0
    ...
    [ 6744.451951] Memory cgroup out of memory: Killed process 4379 (java) total-vm:3106656kB,
    anon-rss:100844kB, file-rss:15252kB, shmem-rss:0kB, UID:0 pgtables:432kB oom_score_adj:0
    [ 6744.473995] oom_reaper: reaped process 4379 (java), now anon-rss:0kB, file-rss:32kB, shmem-rss:0kB
    ...

    View Slide

  19. Oomkilled ?
    Is it a memory leak ?
    or …
    Is it misconfiguration ?

    View Slide

  20. Memory of a process

    View Slide

  21. Memory of a JVM process

    View Slide

  22. Memory
    As JVM based developers
    ● Used to think about JVM Heap sizing, mostly -Xms, -Xmx, …
    ● Possibly some deployment use container-aware flags:
    -XX:MinRAMPercentage, -XX:MaxRAMPercentage, …
    JVM Heap
    Xmx or MaxRAMPercentage

    View Slide

  23. Why should I be concerned by native?
    ● But ignoring other memory zones
    💡 Referred to as native memory,
    Or on the JVM as off-heap memory

    View Slide

  24. Why should I be concerned by native?
    JDK9 landed container support!
    Still need to need to make the cross multiplication yourself.

    View Slide

  25. Why should I be concerned by native?
    Still have no idea what is happening off-heap
    JVM Heap

    View Slide

  26. Why should I be concerned by native?
    Still have no idea what is happening off-heap
    JVM Heap
    https://giphy.com/gifs/bitcoin-crypto-blockchain-trN9ht5RlE3Dcwavg2

    View Slide

  27. If you don’t know what’s there, …
    How can you size properly the heap or the container ?
    JVM Heap

    View Slide

  28. JVM Memory Breakdown
    Running A JVM requires memory:
    ● The Java Heap

    View Slide

  29. JVM Memory Breakdown
    Running A JVM requires memory:
    ● The Java Heap
    ● …

    View Slide

  30. JVM Memory Breakdown
    Running A JVM requires memory:
    ● The Java Heap
    ● The Meta Space (pre-JDK 8 the Permanent Generation)
    ● …

    View Slide

  31. JVM Memory Breakdown
    Running A JVM requires memory:
    ● The Java Heap
    ● The Meta Space (pre-JDK 8 the Permanent Generation)
    ● Direct byte buffers
    ● Code cache (compiled code)
    ● Garbage Collector (like card table)
    ● Compiler (C1/C2)
    ● Symbols
    ● etc.

    View Slide

  32. JVM Memory Breakdown
    Running A JVM requires memory:
    ● The Java Heap
    ● The Meta Space (pre-JDK 8 the Permanent Generation)
    ● Direct byte buffers
    ● Code cache (compiled code)
    ● Garbage Collector (like card table)
    ● Compiler (C1/C2)
    ● Threads
    ● Symbols
    ● etc.
    JVM subsystems

    View Slide

  33. JVM Memory Breakdown
    Except a few flags for meta space, code cache, or direct memory
    There’s no control over memory consumption of the other components
    But
    It is possible to get their size at runtime.

    View Slide

  34. Let’s try first to monitor

    View Slide

  35. Let’s try first to monitor
    Eg with micrometer
    time series
    ● jvm_memory_used_bytes
    ● jvm_memory_committed_bytes
    ● jvm_memory_max_bytes
    Dimensions
    ● area : heap or nonheap
    ● id : memory zone, depends on GC and
    JVM
    jvm_memory_used_bytes{area="nonheap",id="CodeHeap 'profiled nmethods'",} 8231168.0
    jvm_memory_used_bytes{area="heap",id="G1 Survivor Space",} 5242880.0
    jvm_memory_used_bytes{area="heap",id="G1 Old Gen",} 1.164288E7
    jvm_memory_used_bytes{area="nonheap",id="Metaspace",} 4.180964E7
    jvm_memory_used_bytes{area="nonheap",id="CodeHeap 'non-nmethods'",} 1233536.0
    jvm_memory_used_bytes{area="heap",id="G1 Eden Space",} 1.2582912E7
    jvm_memory_used_bytes{area="nonheap",id="Compressed Class Space",} 5207416.0
    jvm_memory_used_bytes{area="nonheap",id="CodeHeap 'non-profiled nmethods'",} 1590528.0

    View Slide

  36. Let’s try first to monitor
    Don’t forget the JVM native buffers
    ● jvm_buffer_total_capacity_bytes

    View Slide

  37. Monitor them

    View Slide

  38. Monitor them
    RSS
    k8s memory limit
    Heap max

    View Slide

  39. Monitor them
    Eden
    Old gen

    View Slide

  40. Monitor them
    JVM off-heap pools
    Not really practical to
    look at

    View Slide

  41. Monitor them
    💡Stack the pools (if supported by your observability tool)
    Missing Data
    RSS
    Stacked
    pools

    View Slide

  42. Monitoring is only as good as data is there
    Observability metrics rely on MBean to get memory areas
    Most JVM don’t export metrics for everything that uses memory

    View Slide

  43. Time to investigate the footprint
    With diagnostic tools

    View Slide

  44. RSS is the real footprint
    $ ps o pid,rss -p $(pidof java)
    PID RSS
    6 4701120

    View Slide

  45. jcmd – a swiss knife
    Who knows ?
    Who used it already ?

    View Slide

  46. jcmd – a swiss knife
    Get the actual flag values
    $ jcmd $(pidof java) VM.flags | tr ' ' '\n'
    6:
    ...
    -XX:InitialHeapSize=4563402752
    -XX:InitialRAMPercentage=85.000000
    -XX:MarkStackSize=4194304
    -XX:MaxHeapSize=4563402752
    -XX:MaxNewSize=2736783360
    -XX:MaxRAMPercentage=85.000000
    -XX:MinHeapDeltaBytes=2097152
    -XX:NativeMemoryTracking=summary
    ...
    PID
    Xms
    Xmx

    View Slide

  47. JVM’s Native Memory Tracking
    1. Start the JVM with -XX:NativeMemoryTracking=summary
    2. Later run jcmd $(pidof java) VM.native_memory
    Modes
    ● summary
    ● detail
    ● baseline/
    diff

    View Slide

  48. $ jcmd $(pidof java) VM.native_memory
    6:
    Native Memory Tracking:
    Total: reserved=7168324KB, committed=5380868KB
    - Java Heap (reserved=4456448KB, committed=4456448KB)
    (mmap: reserved=4456448KB, committed=4456448KB)
    - Class (reserved=1195628KB, committed=165788KB)
    (classes #28431)
    ( instance classes #26792, array classes #1639)
    (malloc=5740KB #87822)
    (mmap: reserved=1189888KB, committed=160048KB)
    ( Metadata: )
    ( reserved=141312KB, committed=139876KB)
    ( used=135945KB)
    ( free=3931KB)
    ( waste=0KB =0.00%)
    ( Class space:)
    ( reserved=1048576KB, committed=20172KB)
    ( used=17864KB)
    ( free=2308KB)
    ( waste=0KB =0.00%)
    - Thread (reserved=696395KB, committed=85455KB)
    (thread #674)
    (stack: reserved=692812KB, committed=81872KB)
    (malloc=2432KB #4046)
    (arena=1150KB #1347)
    - Code (reserved=251877KB, committed=105201KB)
    (malloc=4189KB #11718)
    (mmap: reserved=247688KB, committed=101012KB)
    - GC (reserved=230739KB, committed=230739KB)
    (malloc=32031KB #63631)
    (mmap: reserved=198708KB, committed=198708KB)
    - Compiler (reserved=5914KB, committed=5914KB)
    (malloc=6143KB #3281)
    (arena=180KB #5)
    - Internal (reserved=24460KB, committed=24460KB)
    (malloc=24460KB #13140)
    - Other (reserved=267034KB, committed=267034KB)

    View Slide

  49. $ jcmd $(pidof java) VM.native_memory
    6:
    Native Memory Tracking:
    Total: reserved=7168324KB, committed=5380868KB
    - Java Heap (reserved=4456448KB, committed=4456448KB)
    (mmap: reserved=4456448KB, committed=4456448KB)
    - Class (reserved=1195628KB, committed=165788KB)
    (classes #28431)
    ( instance classes #26792, array classes #1639)
    (malloc=5740KB #87822)
    (mmap: reserved=1189888KB, committed=160048KB)
    ( Metadata: )
    ( reserved=141312KB, committed=139876KB)
    ( used=135945KB)
    ( free=3931KB)
    ( waste=0KB =0.00%)
    ( Class space:)
    ( reserved=1048576KB, committed=20172KB)
    ( used=17864KB)
    ( free=2308KB)
    ( waste=0KB =0.00%)
    - Thread (reserved=696395KB, committed=85455KB)
    (thread #674)
    (stack: reserved=692812KB, committed=81872KB)
    (malloc=2432KB #4046)
    (arena=1150KB #1347)
    - Code (reserved=251877KB, committed=105201KB)
    (malloc=4189KB #11718)
    (mmap: reserved=247688KB, committed=101012KB)
    - GC (reserved=230739KB, committed=230739KB)
    (malloc=32031KB #63631)
    (mmap: reserved=198708KB, committed=198708KB)
    - Compiler (reserved=5914KB, committed=5914KB)
    (malloc=6143KB #3281)
    (arena=180KB #5)
    - Internal (reserved=24460KB, committed=24460KB)
    (malloc=24460KB #13140)
    - Other (reserved=267034KB, committed=267034KB)
    (classes #28431)
    (thread #674)
    Java Heap (reserved=4456448KB, committed=4456448KB)

    View Slide

  50. $ jcmd $(pidof java) VM.native_memory
    6:
    Native Memory Tracking:
    Total: reserved=7168324KB, committed=5380868KB
    - Java Heap (reserved=4456448KB, committed=4456448KB)
    (mmap: reserved=4456448KB, committed=4456448KB)
    - Class (reserved=1195628KB, committed=165788KB)
    (classes #28431)
    ( instance classes #26792, array classes #1639)
    (malloc=5740KB #87822)
    (mmap: reserved=1189888KB, committed=160048KB)
    ( Metadata: )
    ( reserved=141312KB, committed=139876KB)
    ( used=135945KB)
    ( free=3931KB)
    ( waste=0KB =0.00%)
    ( Class space:)
    ( reserved=1048576KB, committed=20172KB)
    ( used=17864KB)
    ( free=2308KB)
    ( waste=0KB =0.00%)
    - Thread (reserved=696395KB, committed=85455KB)
    (thread #674)
    (stack: reserved=692812KB, committed=81872KB)
    (malloc=2432KB #4046)
    (arena=1150KB #1347)
    - Code (reserved=251877KB, committed=105201KB)
    (malloc=4189KB #11718)
    (mmap: reserved=247688KB, committed=101012KB)
    - GC (reserved=230739KB, committed=230739KB)
    (malloc=32031KB #63631)
    (mmap: reserved=198708KB, committed=198708KB)
    - Compiler (reserved=5914KB, committed=5914KB)
    (malloc=6143KB #3281)
    (arena=180KB #5)
    - Internal (reserved=24460KB, committed=24460KB)
    (malloc=24460KB #13140)
    - Other (reserved=267034KB, committed=267034KB)
    (malloc=267034KB #631)
    - Symbol (reserved=28915KB, committed=28915KB)
    (malloc=25423KB #330973)
    (arena=3492KB #1)
    - Native Memory Tracking (reserved=8433KB, committed=8433KB)
    (malloc=117KB #1498)
    (tracking overhead=8316KB)
    - Arena Chunk (reserved=217KB, committed=217KB)
    (malloc=217KB)
    - Logging (reserved=7KB, committed=7KB)
    (malloc=7KB #266)
    - Arguments (reserved=19KB, committed=19KB)
    (malloc=19KB #521)
    Total: reserved=7168324KB, committed=5380868KB
    Class (reserved=1195628KB, committed=165788KB)
    Thread (reserved=696395KB, committed=85455KB)
    Code (reserved=251877KB, committed=105201KB)
    GC (reserved=230739KB, committed=230739KB)
    Compiler (reserved=5914KB, committed=5914KB)
    Internal (reserved=24460KB, committed=24460KB)
    Other (reserved=267034KB, committed=267034KB)

    View Slide

  51. Direct byte buffers
    Those are the memory segments that are allocated outside the Java heap.
    Unused buffers are only freed upon GC.
    Netty for example use them.
    ● < JDK 11, they are reported in the Internal section
    ● ≥ JDK 11, they are reported in the Other section
    Internal (reserved=24460KB, committed=24460KB)
    Other (reserved=267034KB, committed=267034KB)

    View Slide

  52. Garbage Collection
    GC is actually more than only taking care of the garbage.
    It’s a full blown memory management for the Java Heap, and it requires memory
    for its internal data structures (E.g. for G1 regions, remembered sets, etc.)
    On small containers this might be a thing to consider
    GC (reserved=230739KB, committed=230739KB)

    View Slide

  53. Threads
    Threads also appear to take some space
    Thread (reserved=696395KB, committed=85455KB)
    (thread #674)
    (stack: reserved=692812KB, committed=81872KB)
    (malloc=2432KB #4046)
    (arena=1150KB #1347)

    View Slide

  54. Native Memory Tracking
    👍 Good insights on the JVM sub-systems

    View Slide

  55. Native Memory Tracking
    Good insights on the JVM sub-systems, but
    Does NMT show everything ?
    Is NMT data correct ?
    ⚠ Careful about the overhead!
    Measure if this is important for you !

    View Slide

  56. Huh what virtual, committed, reserved memory?
    virtual memory : memory management
    technique that provides an "idealized abstraction
    of the storage resources that are actually
    available on a given machine" which "creates
    the illusion to users of a very large memory".
    reserved memory : Contiguous chunk of
    memory from the virtual memory that the
    program requested to the OS.
    committed memory : writable subset of
    reserved memory, might be backed by physical
    storage

    View Slide

  57. Native Memory Tracking
    Basically what NMT show is this

    View Slide

  58. Native Memory Tracking
    Basically what NMT show is this

    View Slide

  59. Native Memory Tracking
    Basically what NMT show is this

    View Slide

  60. Huh, what virtual, committed, reserved memory?
    used heap : amount of memory occupied by live
    objects and to a certain extent object that are
    unreachable but not yet collected by the GC
    committed heap : the size of the writable heap
    memory where the JVM can write objects. This
    value seats between -Xms and -Xmx values
    heap max size : the limit of the heap (-Xmx)
    #JVM

    View Slide

  61. Native Memory Tracking
    Basically what NMT show is :
    how the JVM subsystems are using the available space

    View Slide

  62. Native Memory Tracking
    Good insights on the JVM sub-systems, but
    Does NMT show everything ?
    Is NMT data correct ?

    View Slide

  63. So virtual memory ?

    View Slide

  64. Virtual memory ?
    Virtual memory implies memory management.
    It is a OS feature
    ● to maximize the utilization of the physical RAM
    ● to reduce the complexity of handling shared access to physical RAM
    By providing processes an abstraction of the available memory

    View Slide

  65. Virtual memory
    On Linux memory is split in
    pages (usually 4 KiB)
    Never used pages
    remain virtual, that is
    without physical storage
    Used pages is called
    Resident memory

    View Slide

  66. Virtual memory
    The numbers shown in
    NMT are actually about
    what the JVM asked for.
    Total: reserved=7168324KB, committed=5380868KB

    View Slide

  67. Virtual memory
    Not the real memory usage Total: reserved=7168324KB, committed=5380868KB

    View Slide

  68. Native Memory Tracking
    Good insights on the JVM sub-systems, but
    Does NMT show everything ? Nope
    Is NMT data correct ? Yes, but not for resident memory usage

    View Slide

  69. What does it means with JVM flags ?
    For the Java heap, -Xms / -Xmx
    ⇒ indication of how much memory heap memory is reserved

    View Slide

  70. What does it means with JVM flags ?
    For the Java heap, -Xms / -Xmx
    ⇒ indication of how much memory heap memory is reserved
    Also -XX:MaxPermSize, -XX:MaxMetaspaceSize, -Xss,
    -XX:MaxDirectMemorySize
    ⇒ indication of how much memory heap memory is/can be reserved
    These flags do have a big impact on JVM
    subsystems, as they may trigger or not some
    behaviors, like :
    - GC if metaspace is too small
    - Heap resizing ig Xms ≠ Xmx
    - …

    View Slide

  71. 💡Memory mapped files
    They are not reported by Native Memory Tracking, yet
    They can be accounted in the RSS.

    View Slide

  72. 💡Memory mapped files
    In Java, using FileChannel.read alone,
    ⇒ Rely on the native OS read method (in unistd.h)
    ⇒ Use the OS page cache

    View Slide

  73. 💡Memory mapped files
    In Java, using FileChannel.read alone,
    ⇒ Rely on the native OS read method (in unistd.h)
    ⇒ Use the OS page cache
    But using FileChannel.map(MapMode, pos, length)
    ⇒ Rely on the mmap OS method (in sys/mman.h)
    ⇒ Load the requested content into the addressable space of the process

    View Slide

  74. pmap
    To really deep dive you need to explore the memory mapping
    ● Via /proc/{pid}/smaps
    ● Or via pmap [-x|-X] {pid}
    Address Kbytes RSS Dirty Mode Mapping
    ...
    00007fe51913b000 572180 20280 0 r--s- large-file.tar.xz
    ...

    View Slide

  75. How to configure memory requirement
    preprod prod-asia prod-eu prod-us
    jvm-service jvm-service jvm-service jvm-service

    View Slide

  76. How to configure memory requirement
    Is it possible to extract a formula ?

    View Slide

  77. How to configure memory requirement
    Different environments
    ⇒ different load, different subsystem behavior
    E.g.
    preprod : 100 req/s
    👉 40 java threads total
    👉 mostly liveness endpoints
    👉 low versatility in data
    👉 low GC activity requirement
    prod-us : 1000 req/s
    👉 200 java threads total
    👉 mostly business endpoints
    👉 variance in data
    👉 higher GC requirements

    View Slide

  78. How to configure memory requirement
    Is it possible to extract a formula ?
    Not that straightforward.
    Some might point to -XX:*RAMPercentage flags, it sets the Java heap size as a
    function of the available physical memory. It works.
    ⚠ -XX:InitialRAMPercentage ⟹ -Xms
    mem < 96MiB -XX:MinRAMPercentage ⟹ -Xmx
    mem > 96MiB -XX:MaxRAMPercentage ⟹ -Xmx

    View Slide

  79. How to configure memory requirement
    Is it possible to extract a formula ?
    1 GiB
    4 GiB
    prod-us
    preprod
    MaxRAMPercentage = 85
    Java heap
    Java heap

    View Slide

  80. How to configure memory requirement
    Is it possible to extract a formula ?
    1 GiB
    4 GiB
    prod-us
    preprod
    Java heap
    MaxRAMPercentage = 85
    Java heap

    View Slide

  81. How to configure memory requirement
    Is it possible to extract a formula ?
    1 GiB
    4 GiB
    prod-us
    preprod Java heap ≃ 850 MiB
    Java heap ≃ 3.40 GiB
    MaxRAMPercentage = 85

    View Slide

  82. How to configure memory requirement
    Is it possible to extract a formula ?
    1 GiB
    4 GiB
    prod-us
    preprod Java heap ≃ 850 MiB
    Java heap ≃ 3.4 GiB
    MaxRAMPercentage = 85
    ~ 150 MiB for every subsystems
    Maybe OK for quiet workloads
    ~ 600 MiB for every subsystems
    Likely not enough for loaded systems
    ⟹ leads to oomkill

    View Slide

  83. How to configure memory requirement
    Traffic, Load are not linear, and do not have linear effects
    ● MaxRAMPercentage is a linear function of the container available RAM
    ● Too low MaxRAMPercentage ⟹ waste of space
    ● Too high MaxRAMPercentage ⟹ risk of oomkills
    ● Requires to find the sweet spot for all deployments
    ● Requires to adjust if load changes
    ● Need to convert back a percentage to raw value

    View Slide

  84. How to configure memory requirement
    -XX:*RAMPercentage flags sort of works,
    Its drawbacks don’t make this quite compelling.
    ✅ Prefer -Xms / -Xmx

    View Slide

  85. How to configure memory requirement
    Let’s have a look at the actual measures
    RSS

    View Slide

  86. How to configure memory requirement
    If Xms and Xmx have the same size, heap is fixed,
    so focus on “native” memory
    RSS
    ● GC internals
    ● Threads
    ● Direct memory buffers
    ● Mapped file buffers
    ● Metaspace
    ● Code cache
    ● …

    View Slide

  87. How to configure memory requirement
    It is very hard to predict the actual requirement to for all these.
    Can we add the values of these zones?
    Yes but it’s not really maintainable.
    Don’t mess with until you actually need to!
    E.g. for each JVM subsystem, you’ll need to
    understand to predict the actual size.
    It’s hard, and requires deep knowledge of the JVM.
    Just don’t !

    View Slide

  88. How to configure memory requirement
    In our experience it’s best to actually retrofit. What does it mean ?
    Give a larger memory limit to the container, much higher than the max heap size.
    Heap
    Container memory limit at 5 GiB

    View Slide

  89. How to configure memory requirement
    In our experience it’s best to actually retrofit. What does it mean ?
    Give a larger memory limit to the container, much higher than the max heap size.
    1. Observe the RSS evolution
    Heap
    RSS
    Container memory limit at 5 GiB

    View Slide

  90. How to configure memory requirement
    In our experience it’s best to actually retrofit. What does it mean ?
    Give a larger memory limit to the container, much higher than the max heap size.
    1. Observe the RSS evolution
    2. If RSS stabilizes after some time
    Heap
    RSS
    RSS stabilizing
    Container memory limit at 5 GiB

    View Slide

  91. How to configure memory requirement
    In our experience it’s best to actually retrofit. What does it mean ?
    Give a larger memory limit to the container, much higher than the max heap size.
    1. Observe the RSS evolution
    2. If RSS stabilizes after some time
    3. Set the new memory limit with enough leeway (eg 200 MiB)
    Heap
    RSS
    New memory limit
    With some leeway for
    RSS increase
    Container memory limit at 5 GiB

    View Slide

  92. How to configure memory requirement
    If the graphs show this
    RSS less than Heap size 🧐
    RSS

    View Slide

  93. How to configure memory requirement
    If the graphs show this
    RSS less than Heap size 🧐
    Remember virtual memory!
    If a page has not been used, then it’s virtual
    RSS
    Java heap untouched
    RSS

    View Slide

  94. How to configure memory requirement
    ⚠ If the Java heap is not fully used (as in RSS),
    the RSS measure to get the max memory utilisation will be wrong
    To avoid the virtual memory pitfall use -XX:+AlwaysPreTouch
    All Java heap pages touched
    RSS

    View Slide

  95. Memory consumption still look too big 😩

    View Slide

  96. Memory consumption still look too big 😩
    Case in hand with Netty

    View Slide

  97. Case in hand : Netty Buffers
    ● Handles pool of DirectByteBuffers (simplified)
    ● Allocates large chunks and subdivides to satisfy allocations
    Problem:
    the more requests to handle
    the more it may allocate buffers & consume direct memory (native)
    If not capped ⟹ OOMKill

    View Slide

  98. Controlling Netty Buffers
    ● JVM options -XX:MaxDirectMemorySize
    Hard limit on direct ByteBuffers total size
    Throws OutOfMemoryError
    ● Property io.netty.maxDirectMemory to control only Netty buffers?
    ⇒ No, it’s more complicated

    View Slide

  99. Controlling Netty Buffers
    Properties controlling Netty Buffer Pool
    ThreadLocal Caches! Depends on the number of thread in EventLoops
    ● io.netty.allocator.cacheTrimInterval
    ● io.netty.allocator.useCacheForAllThreads
    ● io.netty.allocation.cacheTrimIntervalMillis
    ● io.netty.allocator.maxCachedBufferCapacity
    ● io.netty.allocator.numDirectArenas

    View Slide

  100. Controlling Netty Buffers
    ThreadLocal Caches! Depends on the number of thread in EventLoops
    private static EventLoopGroup getBossGroup(boolean useEpoll) {
    if (useEpoll) {
    return new EpollEventLoopGroup(NB_THREADS);
    } else {
    return new NioEventLoopGroup(NB_THREADS);
    }
    }

    View Slide

  101. Shaded Netty Buffers
    Beware of multiple shaded Netty libraries
    They share the same properties!

    View Slide

  102. Controlling Netty Buffers

    View Slide

  103. Case in hand : native allocator
    Small but
    steady RSS
    increase

    View Slide

  104. Case in hand : native allocator
    If something doesn’t add up : check the native allocator, but why ?
    To get memory any program must either
    ● Call the OS asking for a memory mapping via mmap function
    ● Call the C standard library malloc function
    On Linux, standard library = glibc

    View Slide

  105. Case in hand : native allocator
    The glibc’s malloc is managing memory via technic called
    Arena memory management
    Unfortunately there’s no serviceability tooling around glibc arena management
    (unless modifying the program to call C API)
    It may be possible to extrapolate things using a tool like pmap

    View Slide

  106. Case in hand : native allocator
    Analyzing memory mapping
    00007fe164000000 2736 2736 2736 rw--- [ anon ]
    00007fe1642ac000 62800 0 0 ----- [ anon ]
    Virtual
    64 MiB
    RSS ~ 2.6 MiB

    View Slide

  107. Case in hand : native allocator
    Analyzing memory mapping
    00007fe164000000 2736 2736 2736 rw--- [ anon ]
    00007fe1642ac000 62800 0 0 ----- [ anon ]
    Virtual
    64 MiB
    x 257 ⟹ RSS ~1.2 GiB
    RSS ~ 2.6 MiB

    View Slide

  108. Case in hand : native allocator
    ● Glibc reacts to CPUs, application threads
    ● On each access there’s a lock
    ● Higher number of threads ⟹ higher contention on the arenas ⟹ lead glibc to
    create more arenas
    ● There are some tuning options in particular MALLOC_ARENA_MAX,
    M_MMAP_THRESHOLD, …
    ⚠ Significant understanding of how glibc’s malloc work, allocation size, etc

    View Slide

  109. Case in hand : native allocator
    Better solution, change the application native allocator
    ● tcmalloc from Google’s gperftools
    ● jemalloc from Facebook
    ● minimalloc from Microsoft
    LD_PRELOAD=/usr/lib/x86_64-linux-gnu/libtcmalloc.so

    View Slide

  110. Case in hand : native allocator

    View Slide

  111. Case in hand : native allocator
    If using tcmalloc or jemalloc,
    one step away from native allocation profiling.
    Useful to narrow native memory leak.

    View Slide

  112. My Container gets re-spawn

    View Slide

  113. Container Restarted

    View Slide

  114. Demo minikube + Petclinic

    View Slide

  115. Quick Fix
    Increase Probe liveness timeout (either initial delay or interval)
    livenessProbe:
    httpGet:
    path: /
    port: 8080
    initialDelaySeconds: 60
    periodSeconds: 10

    View Slide

  116. JIT Compilation

    View Slide

  117. Troubleshooting Compile Time
    Use jstat -compiler to see cumulated compilation time (in s)
    $ jstat -compiler 1
    Compiled Failed Invalid Time FailedType FailedMethod
    6002 0 0 101.16 0

    View Slide

  118. Troubleshooting using JFR
    Use
    java -XX:StartFlightRecording
    jcmd 1 JFR.dump name=1 filename=petclinic.jfr
    jfr print --events jdk.CompilerStatistics petclinic.jfr

    View Slide

  119. Troubleshooting using JFR

    View Slide

  120. Measuring startup time
    docker run --cpus= -ti spring-petclinic
    CPUs JVM Startup
    time (s)
    Compile time
    (s)
    4 8.402 17.36
    2 8.458 10.17
    1 15.797 20.22
    0.8 20.731 21.71
    0.4 41.55 46.51
    0.2 86.279 92.93

    View Slide

  121. C1 vs C2
    C1 + C2 C1 only
    # compiled methods 6,117 5,084
    # C1 compiled methods 5,254 5,084
    # C2 compiled methods 863 0
    Total Time (ms) 21,678 1,234
    Total Time in C1 (ms) 2,071 1,234
    Total Time in C2 (ms)
    19,607 0

    View Slide

  122. TieredCompilation
    Interpreter C1 + Profiling C2
    Compilation Level 0 3 4

    View Slide

  123. TieredCompilation queues
    C2
    C1
    C2
    C2
    M1
    M2
    M3
    M4
    M5

    View Slide

  124. TieredCompilation Heuristics
    Level transitions:
    ● 0 ➟ 2 ➟ 3 ➟ 4 (C2 Q too long)
    ● 0 ➟ (3 ➟ 2) ➟ 4 (C1 Q too long, change level in-Q)
    ● 0 ➟ (3 or 2) ➟ 1 (trivial method or can’t compiled in C2)
    ● 0 ➟ 4 (can’t compiled in C1)
    Note: level 3 is 30% slower than level 2
    Interpreter C1 + Profiling C2
    Comp Level
    0 3 4
    C1
    1
    C1 + Limited
    Profiling
    2

    View Slide

  125. Compiler Settings
    To only use C1 JIT compiler:
    -XX:TieredStopAtLevel=1
    To adjust C2 compiler threads:
    -XX:CICompilerCount=

    View Slide

  126. Measuring startup time
    docker run --cpus= -ti spring-petclinic
    CPUs JVM Startup time (s) Compile time (s) JVM Startup time (s)
    XX:TieredStopAtLevel=1
    Compile time (s)
    4 8.402 17.36 6.908 (-18%) 1.47
    2 8.458 10.17 6.877 (-19%) 1.41
    1 15.797 20.22 8.821 (-44%) 1.74
    0.8 20.731 21.71 10.857 (-48%) 2.08
    0.4 41.55 46.51 22.225 (-47%) 3.67
    0.2 86.279 92.93 45.706 (-47%) 6.95

    View Slide

  127. GC

    View Slide

  128. Troubleshooting GC
    Use -Xlog:gc / -XX:+PrintGCDetails

    View Slide

  129. Troubleshooting GC with JFR/JMC

    View Slide

  130. Settings properly GC: Metadata Threshold
    To avoid Full GC for loading more class anre Metaspace resize:
    Set initial Metaspace size high enough to load all your required classes
    -XX:MetaspaceSize=512M

    View Slide

  131. Settings properly GC
    Use a fixed heap size :
    -Xms = -Xmx
    -XX:InitialHeapSize = -XX:MaxHeapSize
    Heap resize done during Full GC for SerialGC & Parallel GC.
    G1 is able to resize without FullGC (regions, not the metaspace)

    View Slide

  132. GC ergonomics: GC selection
    To verify in log GC (-Xlog:gc):
    CPU Memory GC
    < 2 < 2GB Serial
    ≥ 2 < 2GB Serial
    < 2 ≥ 2GB Serial
    ≥ 2 ≥ 2 GB Parallel([0.004s][info][gc] Using G1

    View Slide

  133. GC ergonomics: # threads selection
    -XX:ParallelGCThreads=
    Used for Parallelizing work during STW phases
    # physical cores ParallelGCThreads
    ≤ 8 # cores
    > 8 8 + ⅝ * (# cores - 8)

    View Slide

  134. GC ergonomics: # threads selection
    -XX:ConcGCThreads=
    Used for concurrent work while application is running
    G1 Shenandoah ZGC
    Max(ParallelGCThreads + 2 / 4, 1) ¼ # cores ¼ if dynamic or ⅛ # cores

    View Slide

  135. CPU resource tuning

    View Slide

  136. CPU Resources
    shares, quotas ?

    View Slide

  137. CPU shares
    Sharing cpu among containers of a node
    Correspond to Requests for Kubernetes
    Allow to use all the CPUs if needed sharing with all others containers
    $ cat /sys/fs/cgroup/cpu.weight
    20
    $ cat /sys/fs/cgroup/cpu.weight
    10
    resources:
    requests:
    cpu: 500m
    resources:
    requests:
    cpu: 250m

    View Slide

  138. CPU quotas
    Fixing limits of CPU used by a container
    Correspond to Limits to kubernetes
    resources:
    limits:
    cpu: 500m
    resources:
    limits:
    cpu: 250m
    $ cat /sys/fs/cgroup/cpu.max
    50000 100000
    $ cat /sys/fs/cgroup/cpu.max
    25000 100000

    View Slide

  139. Shares / Quotas
    CPU is shared among multiple process.
    Ill processes could consume all the computing bandwidth.
    Cgroups help prevent that but require to define boundaries.
    A
    100%
    A
    100%
    A
    100%
    A
    100%
    C waiting be scheduled
    B waiting be scheduled
    🚦

    View Slide

  140. Shares / Quotas
    The lower bound of a CPU request is called shares.
    A CPU core is divided in 1024 “slices”.
    A host with 4 CPU will have 4096 shares.

    View Slide

  141. Shares / Quotas
    Programs also have the notion of shares.
    The OS will distributes these computing slices propertionnally.
    Process asking for 1432 shares (~1.4 CPU)
    Process asking for 2048 shares (2 CPU)
    Process asking for 616 shares
    = 4096
    Each are guaranteed to have what
    they asked for.

    View Slide

  142. Shares / Quotas
    Programs also have the notion of shares.
    The OS will distributes these computing slices propertionnally.
    Process asking for 1432 shares (~1.4 CPU)
    Process asking for 2048 shares (2 CPU)
    Process asking for 616 shares
    = 4096
    Each are guaranteed to have what
    they asked for.
    💡 Upper bounds are not enforced, if
    there’s CPU available a process can
    burst

    View Slide

  143. Shares / Quotas
    Programs also have the notion of shares.
    The OS will distributes these computing slices propertionnally.
    Process asking for 1432 shares (~1.4 CPU)
    Process asking for 2048 shares (2 CPU)
    Process asking for 616 shares
    = 4096
    Each are guaranteed to have what
    they asked for.
    💡 Pod schedulers like Kubernetes,
    use this mechanism to place a pod
    were enough computation is
    available
    💡 Upper bounds are not enforced, if
    there’s CPU available a process can
    burst

    View Slide

  144. Shares / Quotas
    Different mechanism used to limit a process.
    CPU is split in periods of 100 ms (by default)
    A fraction of a CPU is called millicore, and it’s a thousandth
    Exemple : 100 * ( 500 / 1000 ) = 50ms
    resources:
    limits:
    cpu: 500m
    50 ms per period of 100 ms
    Period millicores cpu fraction

    View Slide

  145. Shares / Quotas
    Now
    Indeed, it means the limit applies to all accounted cores :
    4 CPU ⟹ 4 x 100ms = 400ms
    resources:
    limits:
    cpu: 2500m
    250 ms per period of 100 ms 🧐

    View Slide

  146. Shares / Quotas
    Shares and quota have nothing to do with a hardware socket
    resources:
    limits:
    cpu: 1
    limits:
    cpu: 1

    View Slide

  147. Shares / Quotas
    Shares and quota have nothing to do with a hardware socket
    resources:
    limits:
    cpu: 1
    limits:
    cpu: 1

    View Slide

  148. Shares / Quotas
    If the process reaches its limit, it will get throttled
    ie it will have to wait for the next period.
    Eg s process can consume a 200ms budget on
    ● 2 cores with 100ms on each
    ● 8 cores with 25ms on each

    View Slide

  149. CPU Throttling
    When you reach limit with CPU quotas, throttling happens
    Throttling ⟹ STW pauses
    Monitor throttling:
    Cgroup v1: /sys/fs/cgroup/cpu,cpuacct//cpu.stat
    Cgroup v2: /sys/fs/cgroup/cpu.stat
    ● nr_periods – number of periods that any thread in the cgroup was runnable
    ● nr_throttled – number of runnable periods in which the application used its entire quota and was
    throttled
    ● throttled_time – sum total amount of time individual threads within the cgroup were throttled

    View Slide

  150. CPU Throttling with JFR
    JFR Container event jdk.ContainerCPUThrottling

    View Slide

  151. availableProcessors ergonomics
    Setting CPU shares/quotas have a direct impact on
    Runtime.availableProcessors() API
    Shares Quotas Period availableProcessors()
    4096 -1 100 000 4 (Shares / 1024)
    1024 300 000 100 000 3 (Quotas / Period)

    View Slide

  152. availableProcessors ergonomics
    Runtime.availableProcessors() API is used to :
    ● size some concurrent structures
    ● ForkJoinPool, used for Parallel Streams, CompletableFuture, …

    View Slide

  153. Tuning CPU
    Trade-off cpu needs for startup time VS request time
    ● Adjust CPU shares / CPU quotas
    ● Adjust liveness timeout
    ● Use readiness / startup probes

    View Slide

  154. Conclusion

    View Slide

  155. Memory
    ● JVM memory is not only Java heap
    ● Native parts are less known, and difficult to monitor and estimate
    ● Yet they are important moving part to account to avoid OOMKills
    ● Bonus revise virtual memory

    View Slide

  156. Startup
    ● Containers with <2 cpus are an constraint environment for JVM
    ● Need to keep in mind that JVM subsystems like JIT or GC need to be adjusted
    for requirements
    ● To be aware of these subsystems helps to find the balance between resources
    and requirements of your application

    View Slide

  157. References

    View Slide

  158. References
    Using Jdk Flight Recorder and Jdk Mission Control
    MaxRAMPercentage is not what I whished for
    Off-Heap reconnaissance
    Startup, Containers and TieredCompilation
    Hotspot JVM performance tuning guidelines
    Application Dynamic Class Data Sharing in HotSpot JVM
    Jdk18 G1 Parallel GC Changes
    Unthrottled fixing cpu limits in the cloud
    Best Practices Java single-core containers
    Containerize your Java applications

    View Slide