$30 off During Our Annual Pro Sale. View Details »

Javaday / ParisJug 2022 - Remèdes aux oomkill, warm-ups, et lenteurs pour des conteneurs JVM

Javaday / ParisJug 2022 - Remèdes aux oomkill, warm-ups, et lenteurs pour des conteneurs JVM

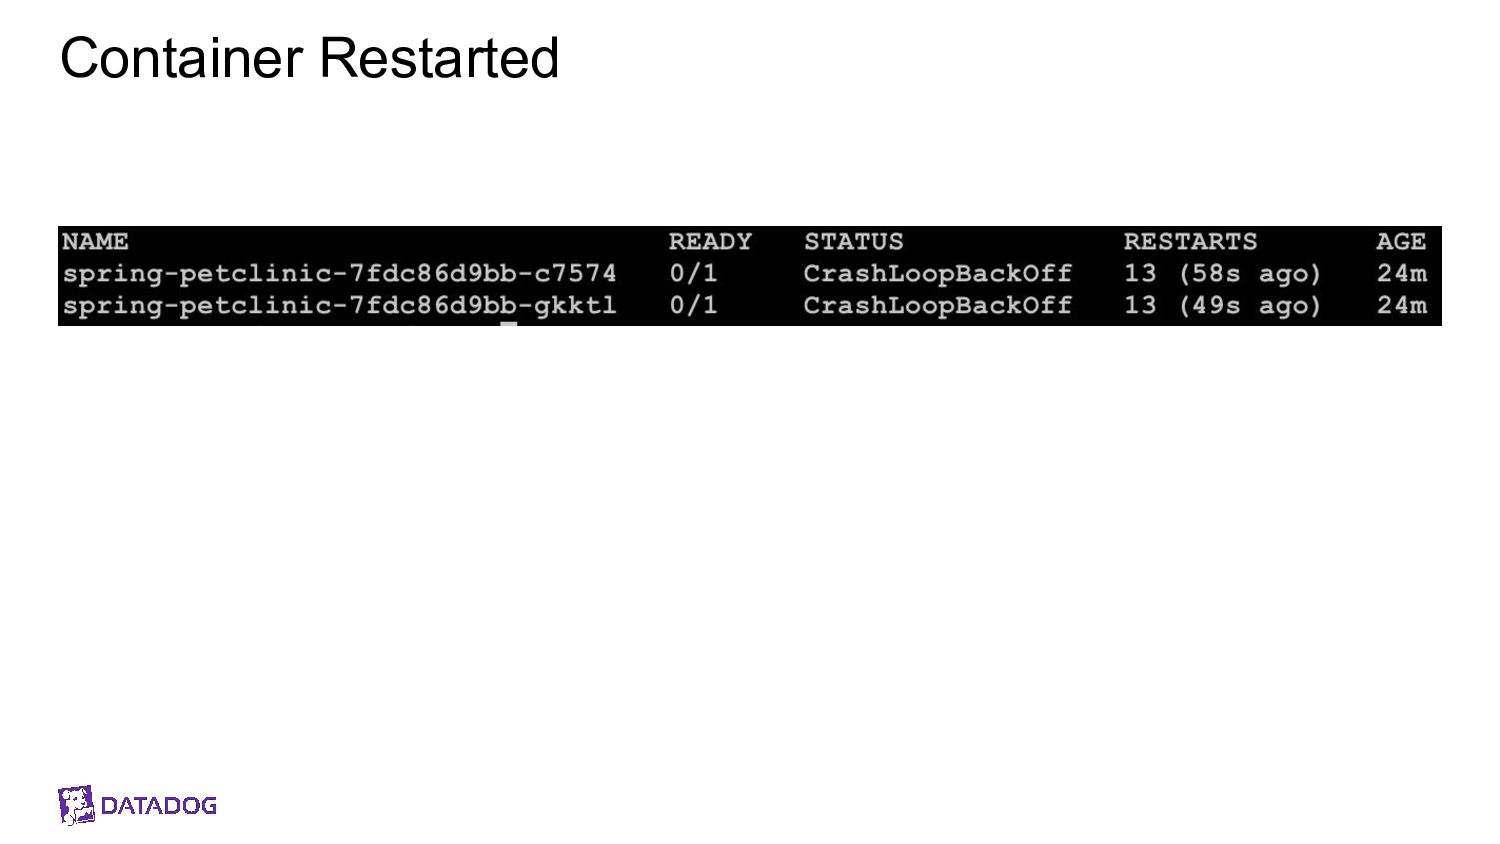
Mes conteneurs JVM sont en prod, oups ils se font _oomkill_, _oups_ le démarrage traîne en longueur, _oups_ ils sont lent en permanence. Nous avons vécu ces situations.

Ces problèmes émergent parce qu’un conteneur est par nature un milieu restreint. Sa configuration a un impact sur le process Java cependant ce process a lui aussi des besoins pour fonctionner.

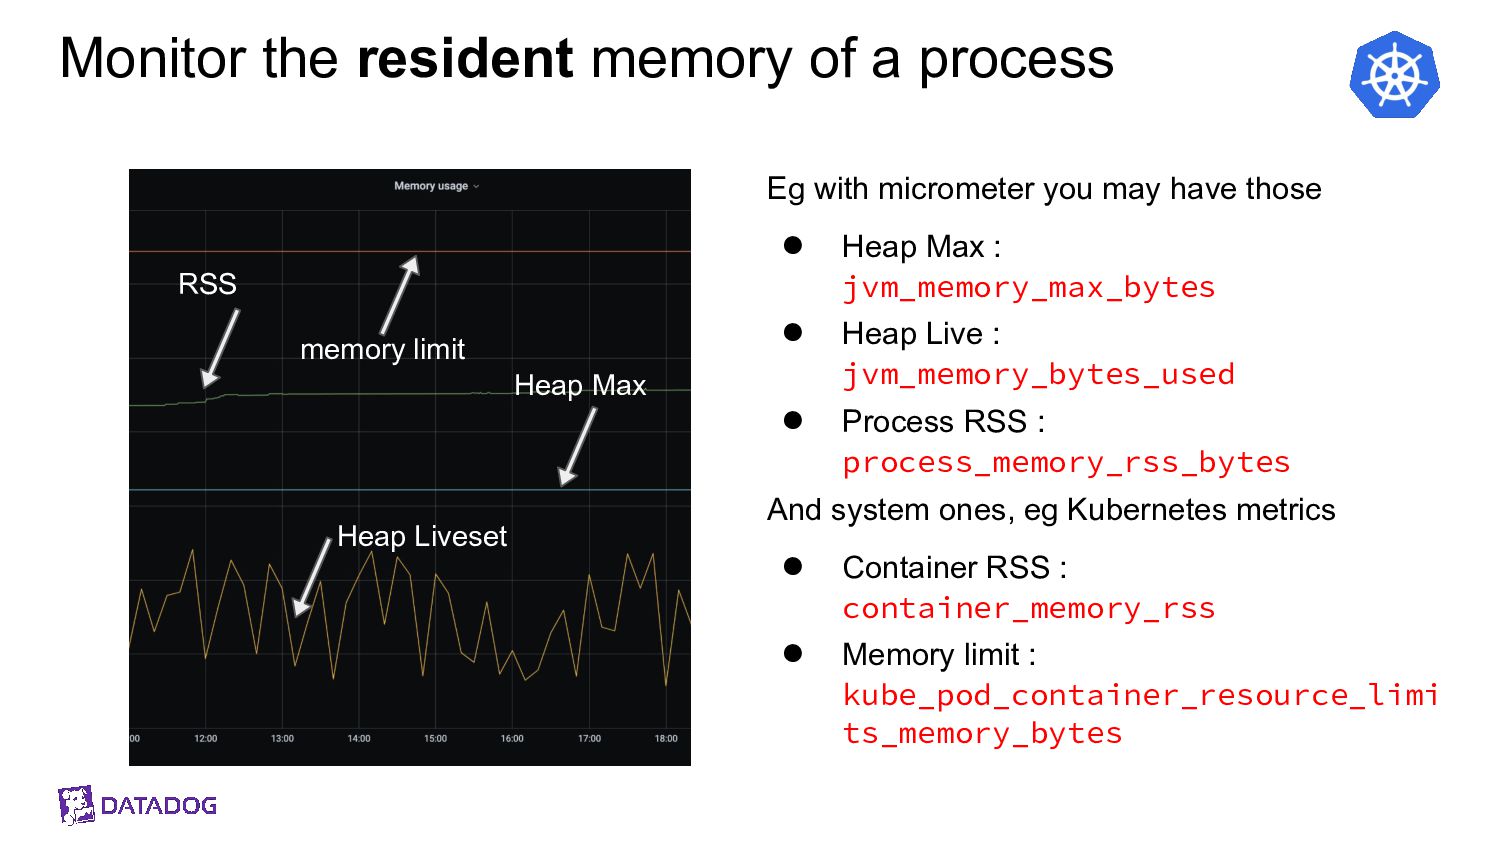
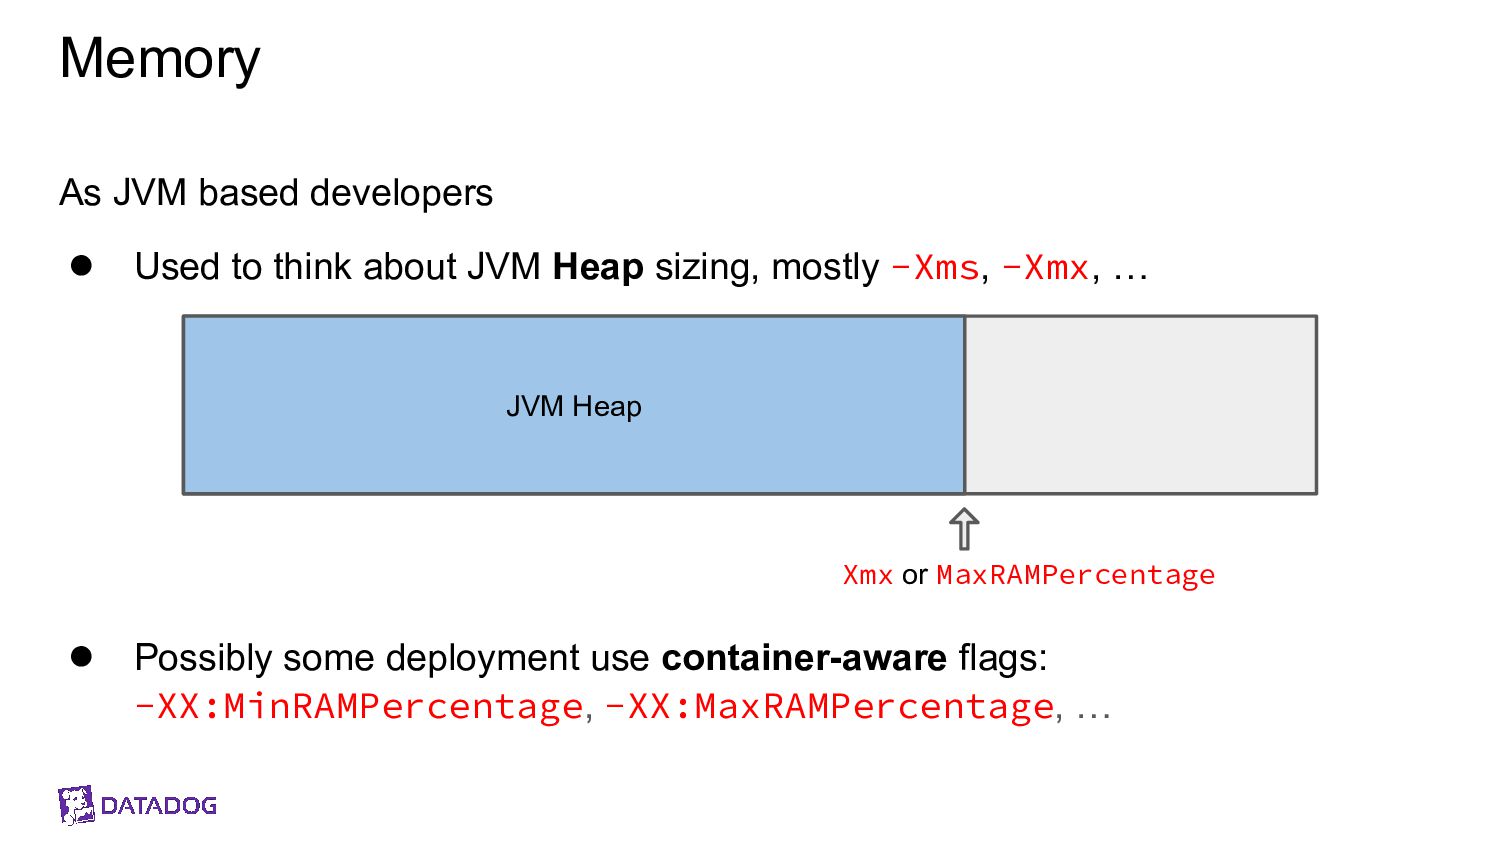
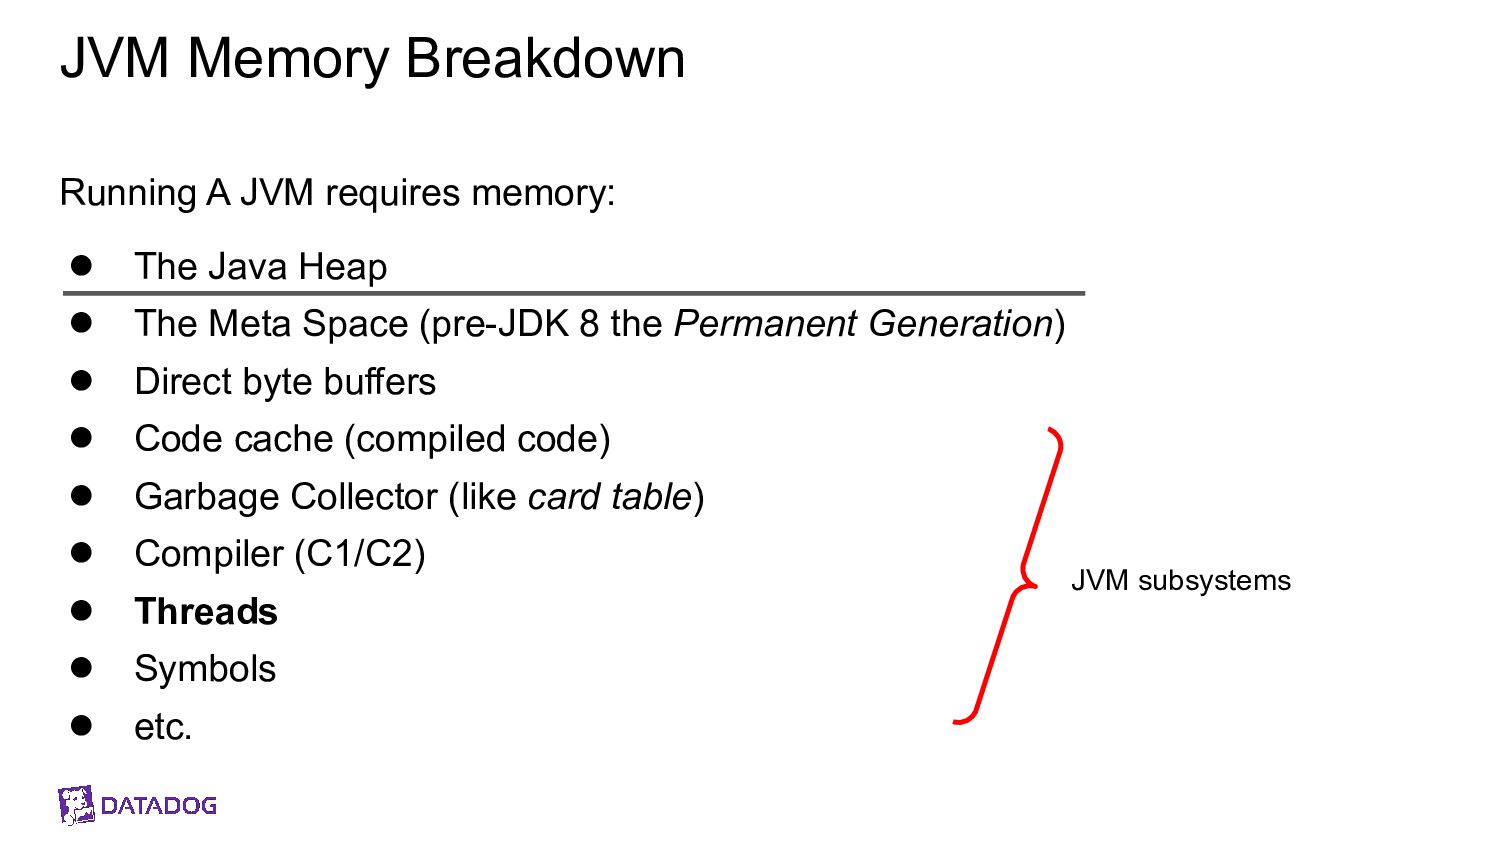
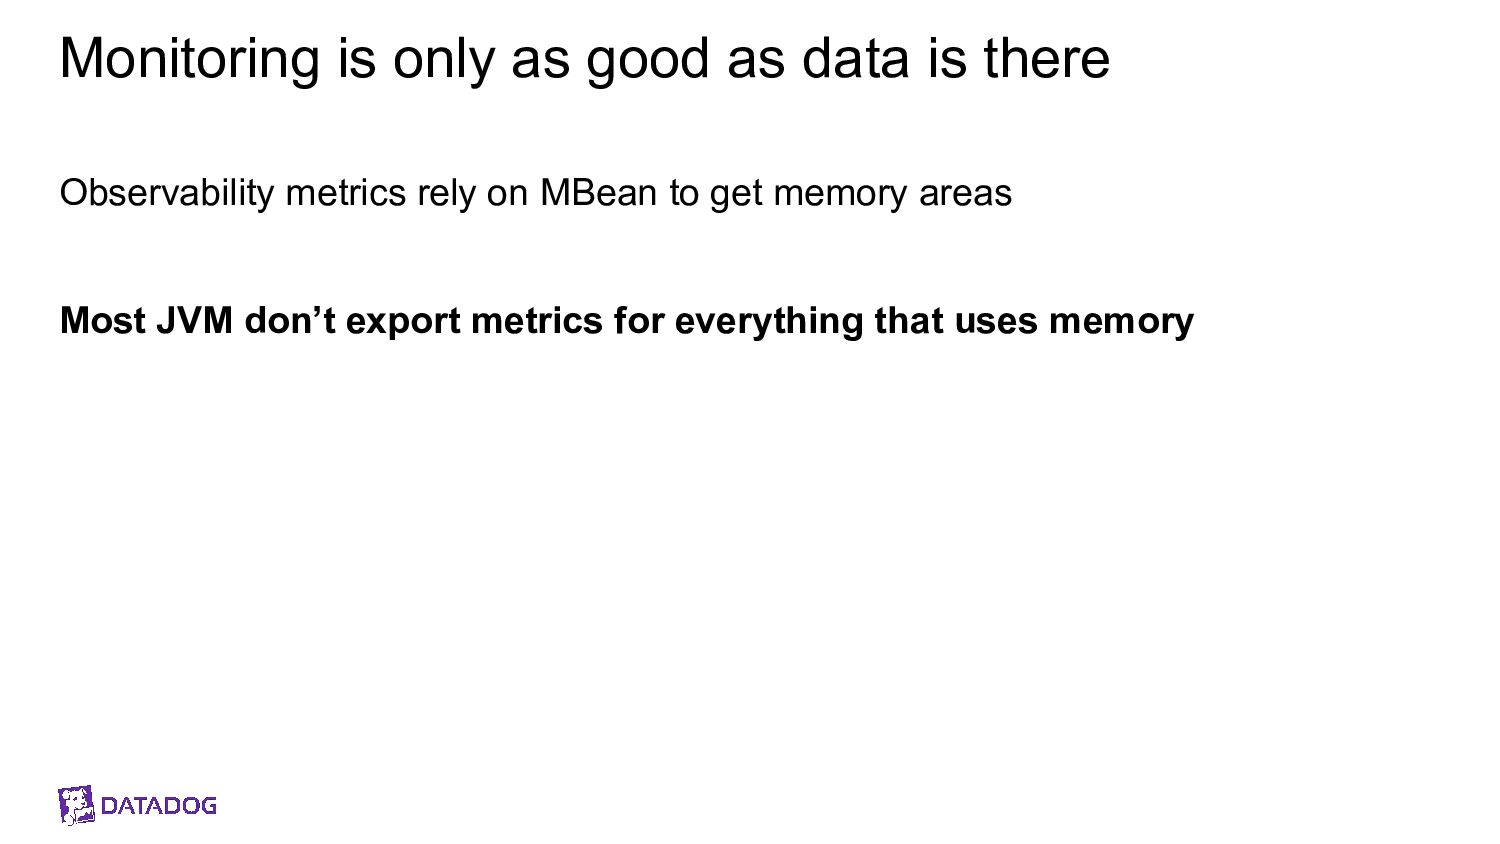
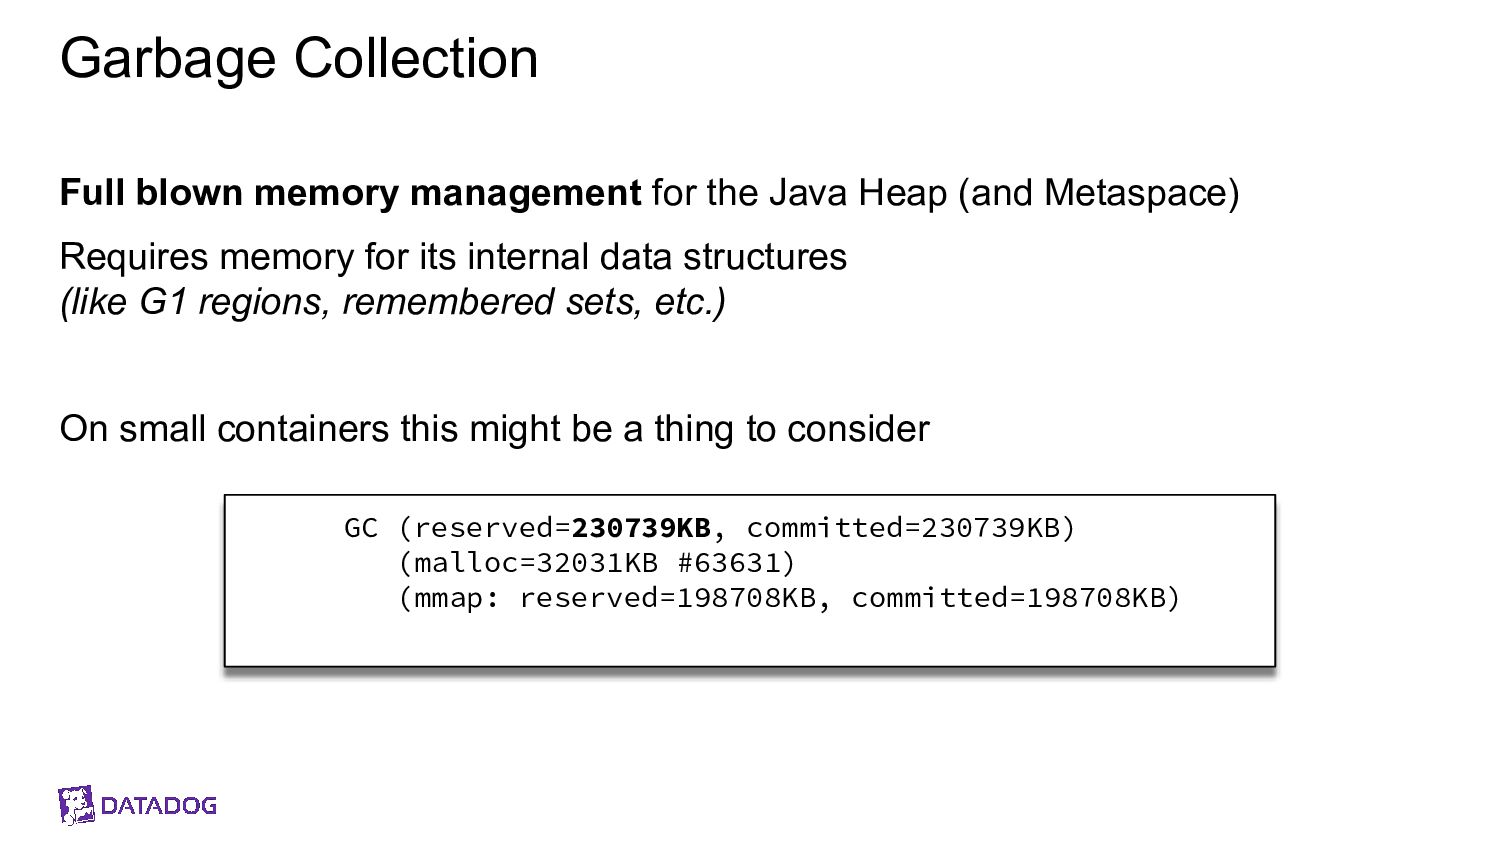
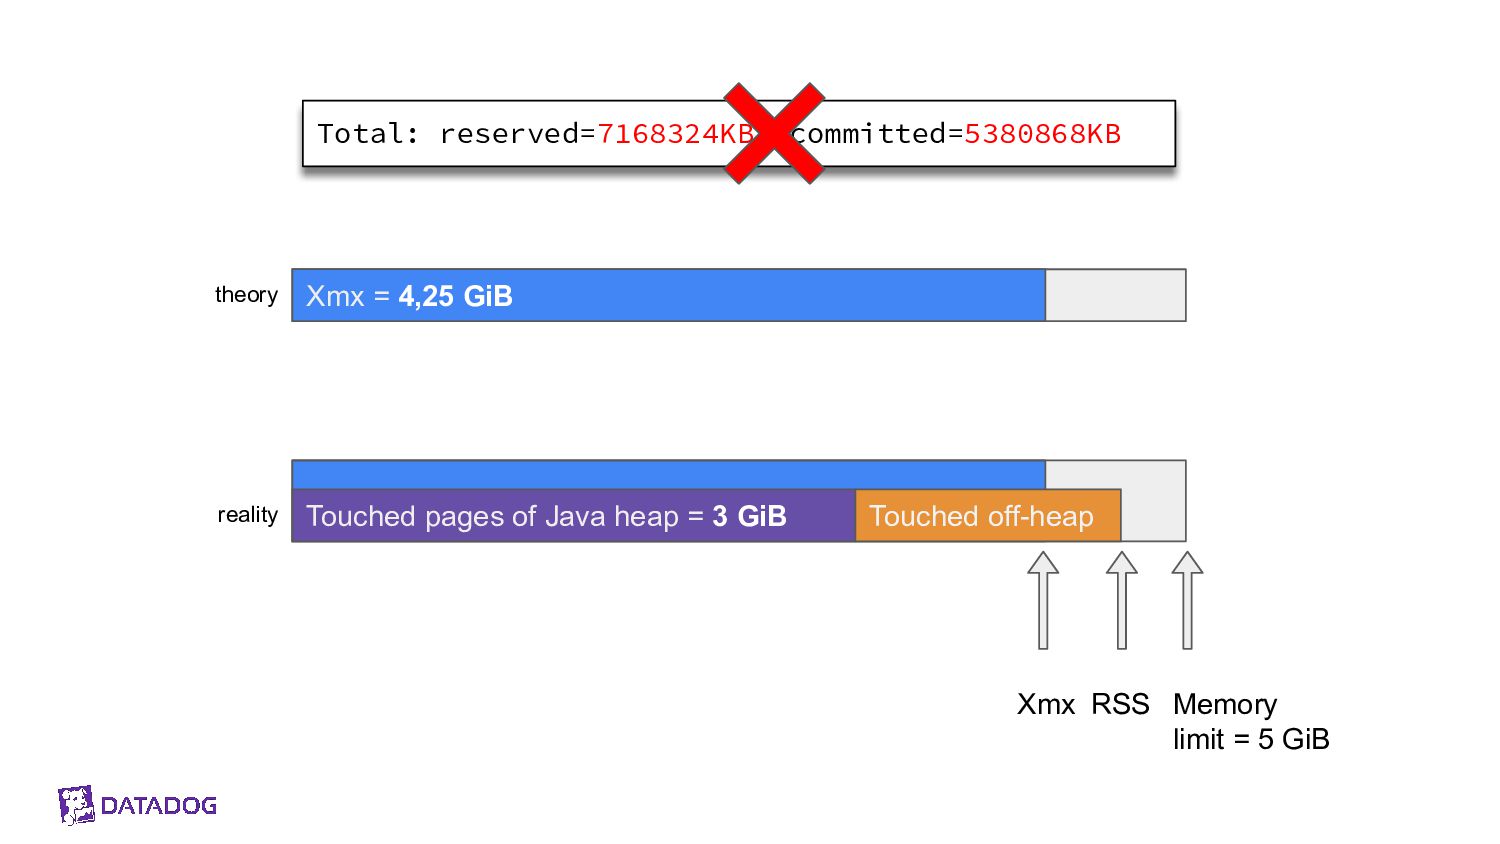
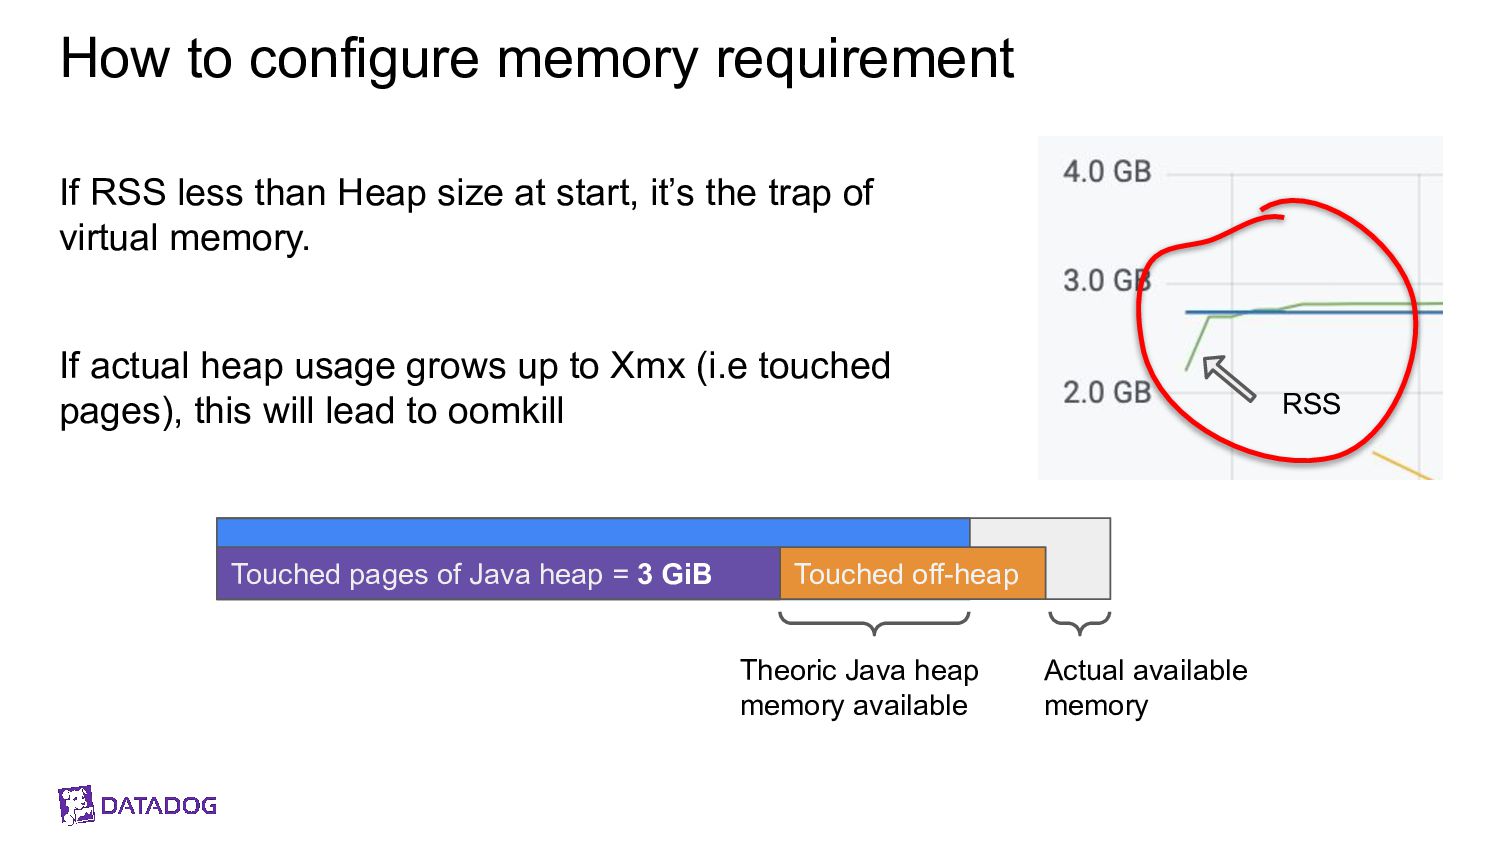
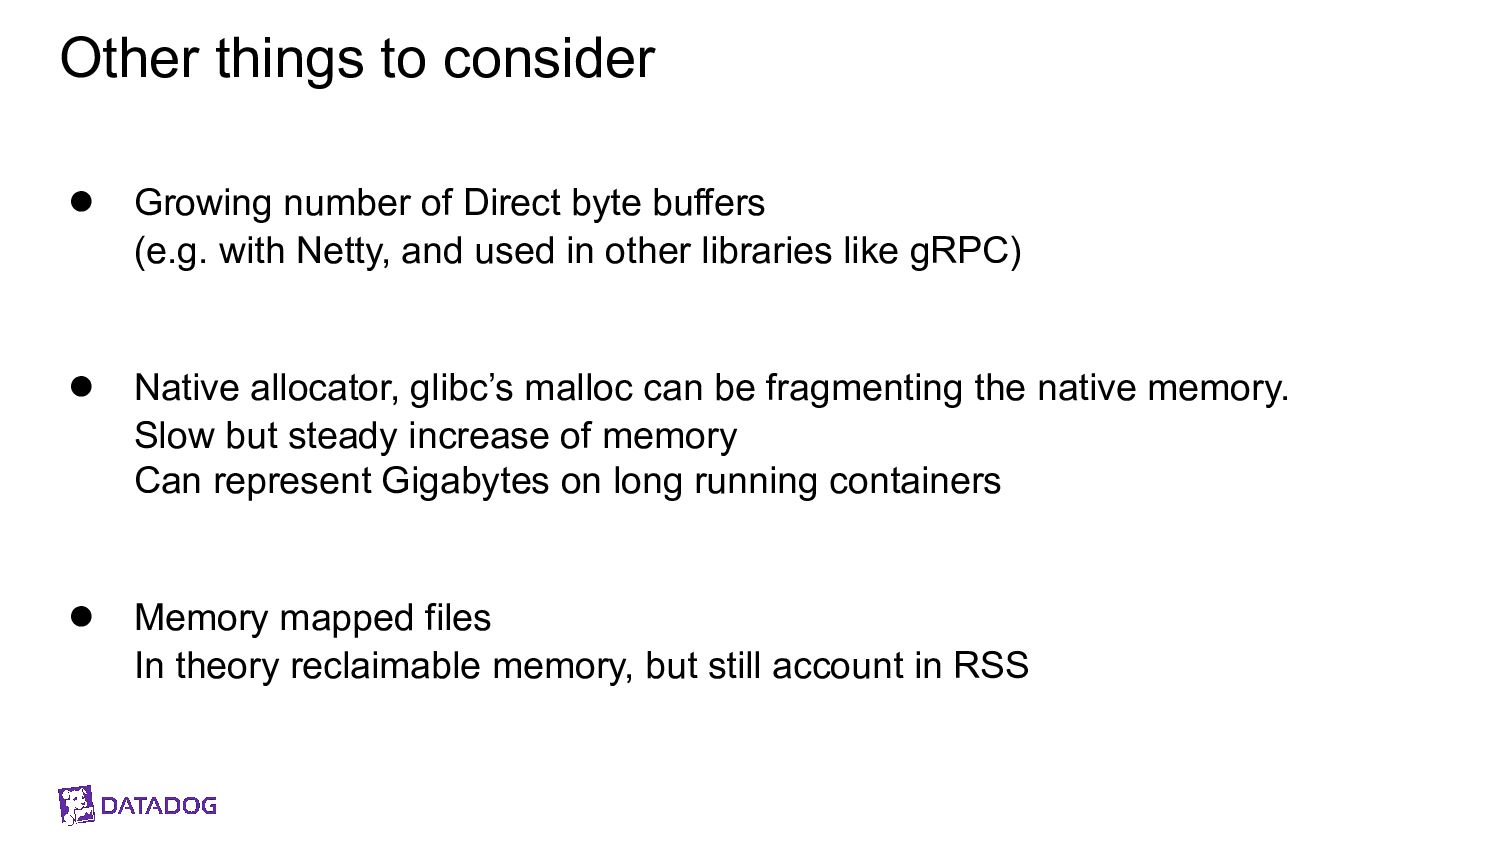
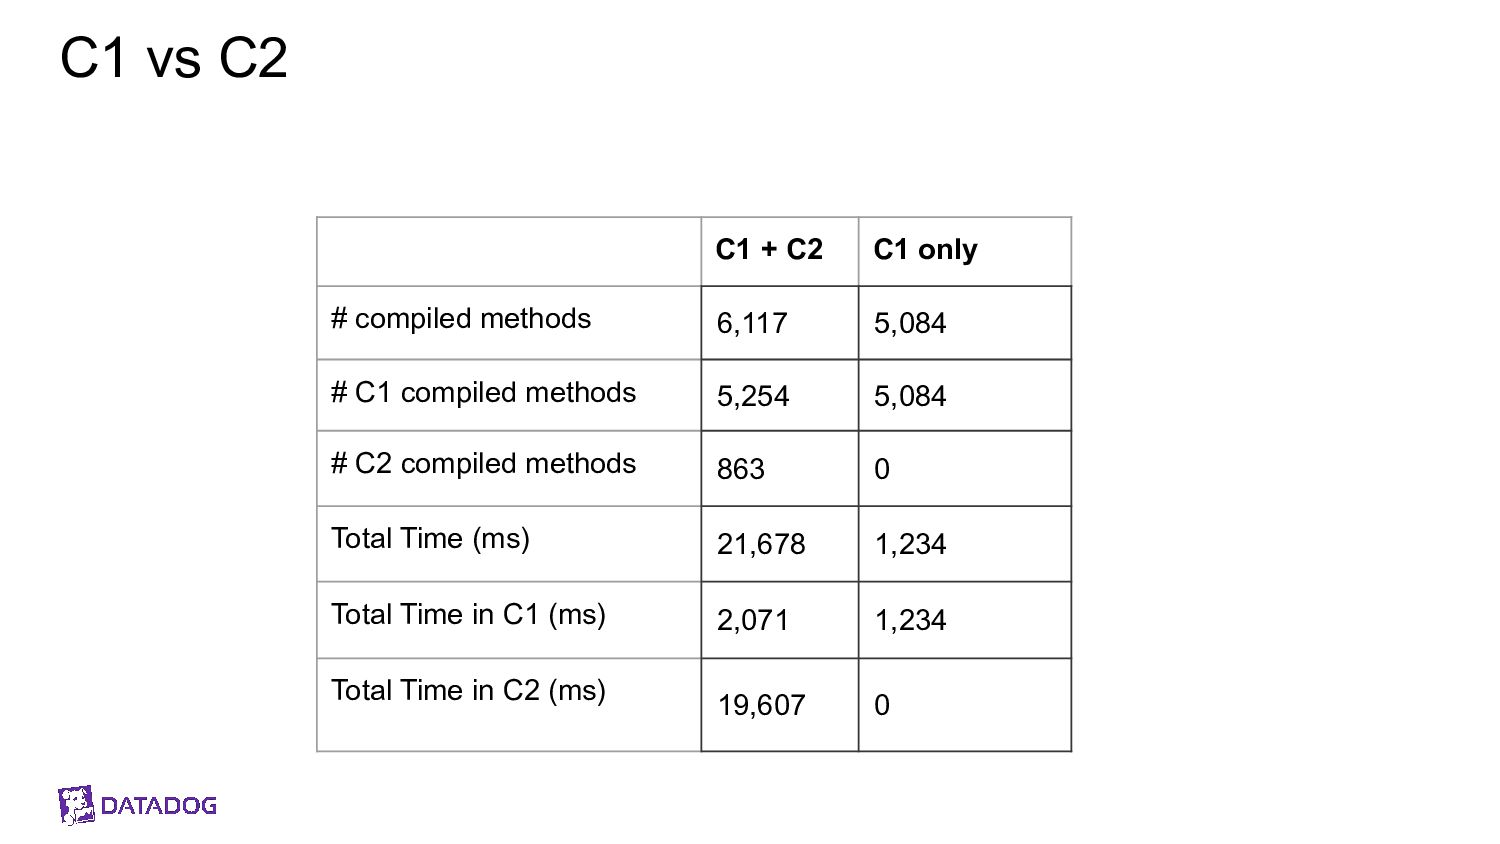
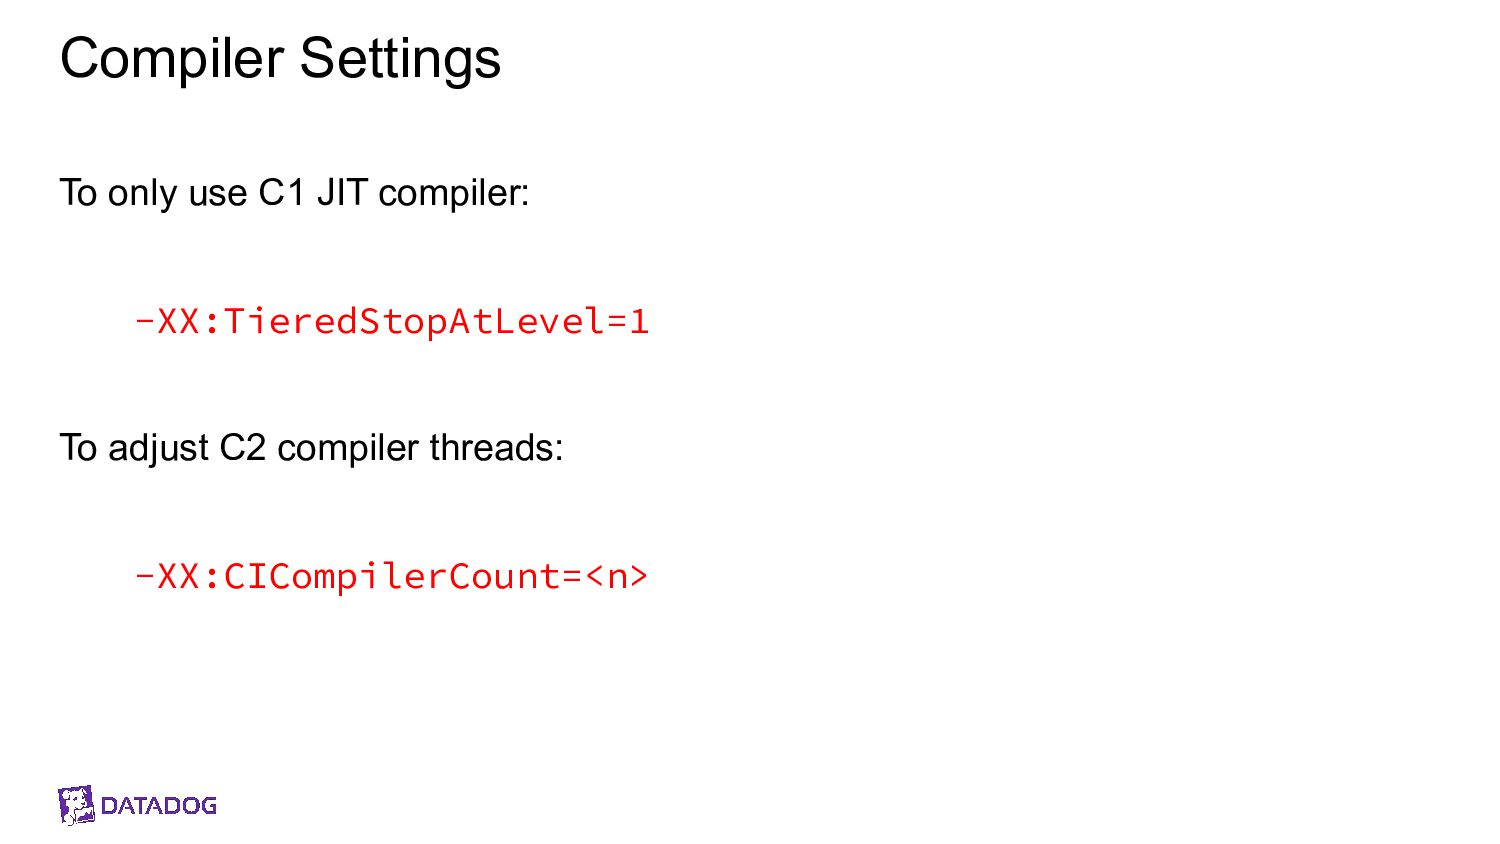
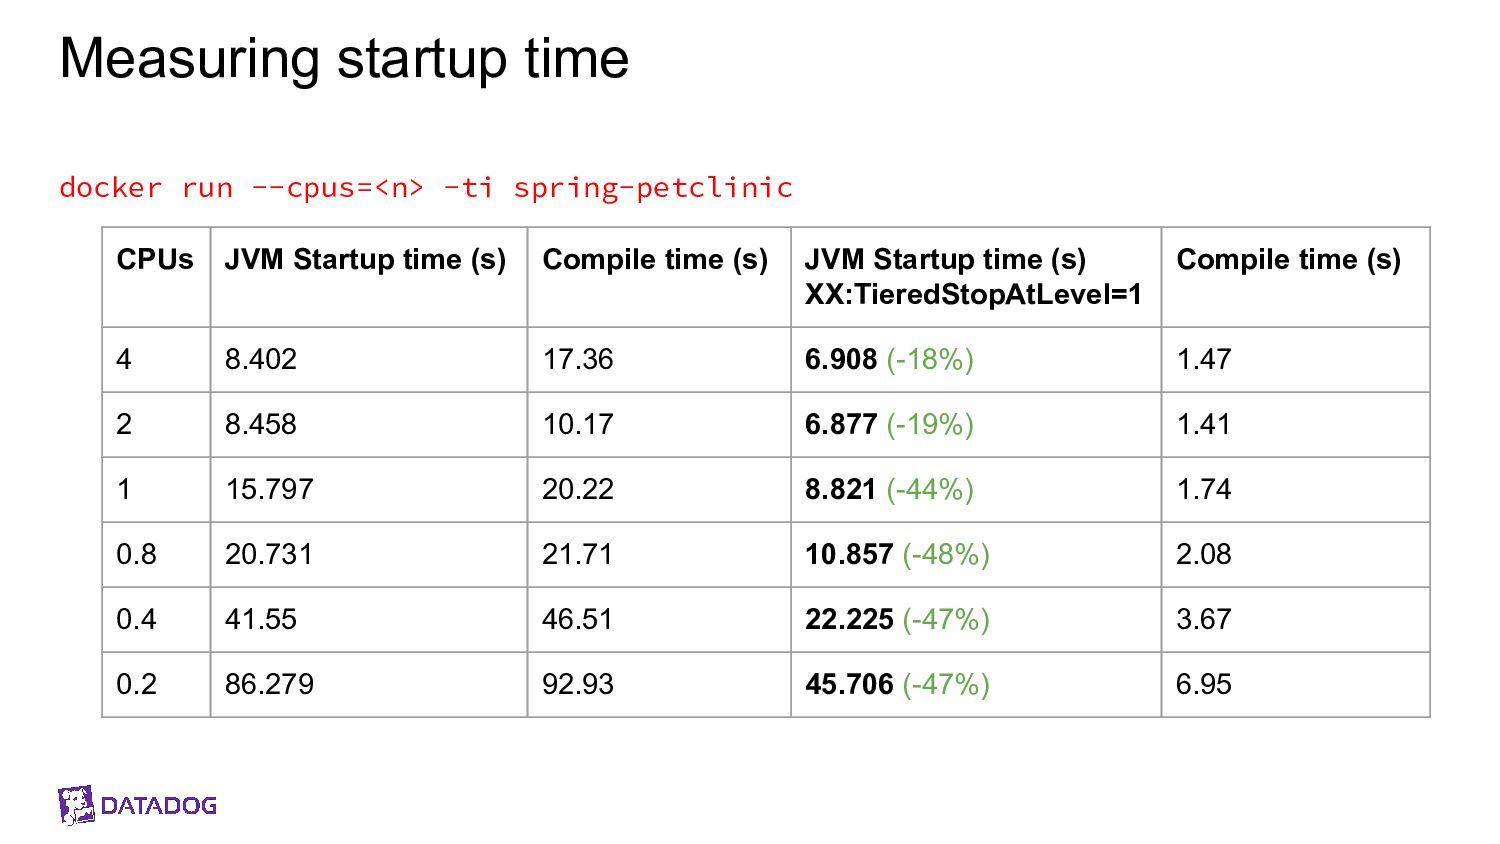
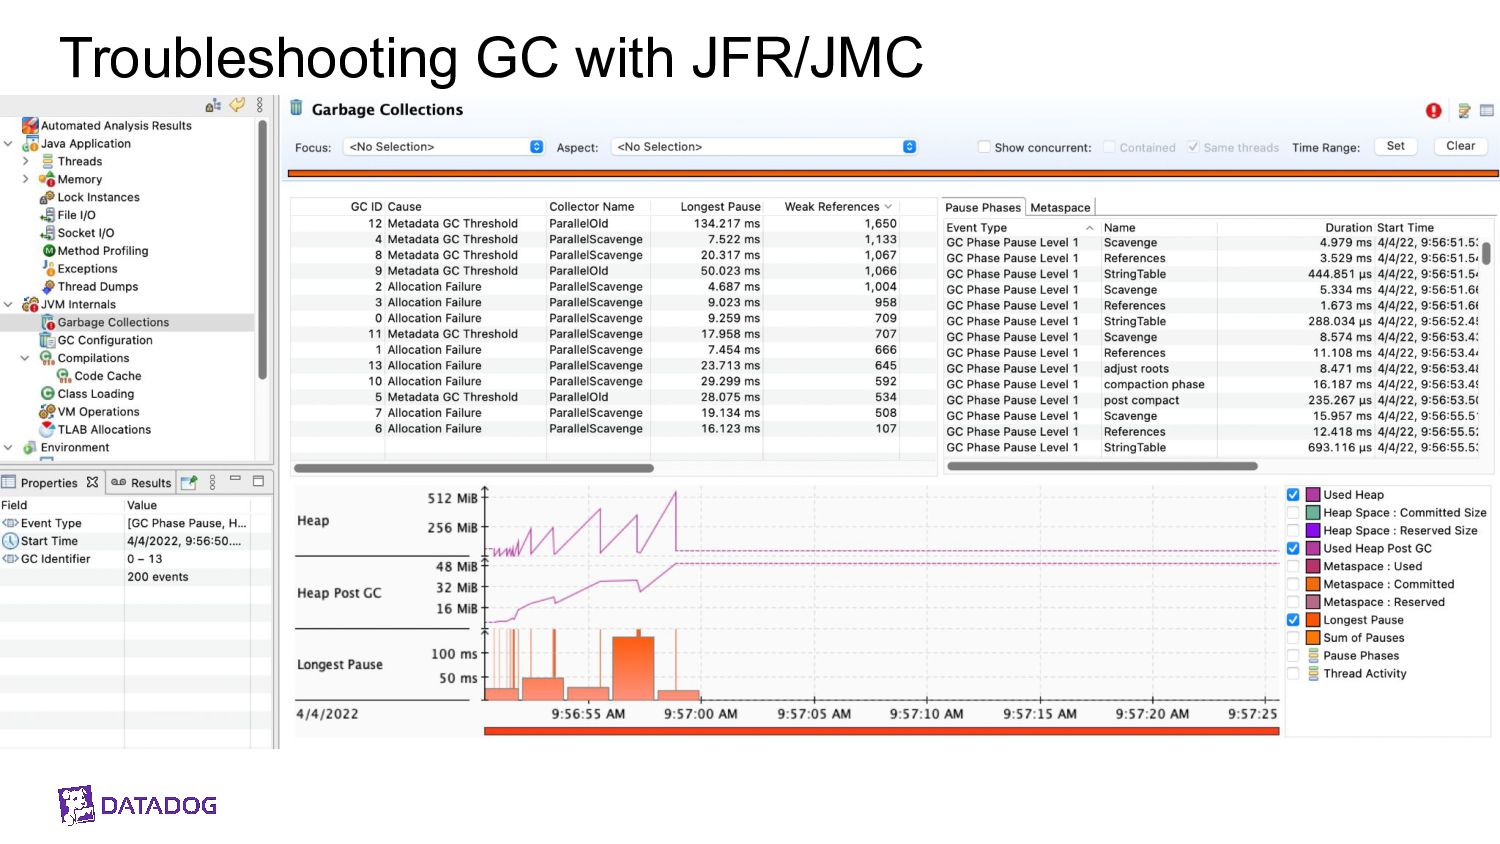
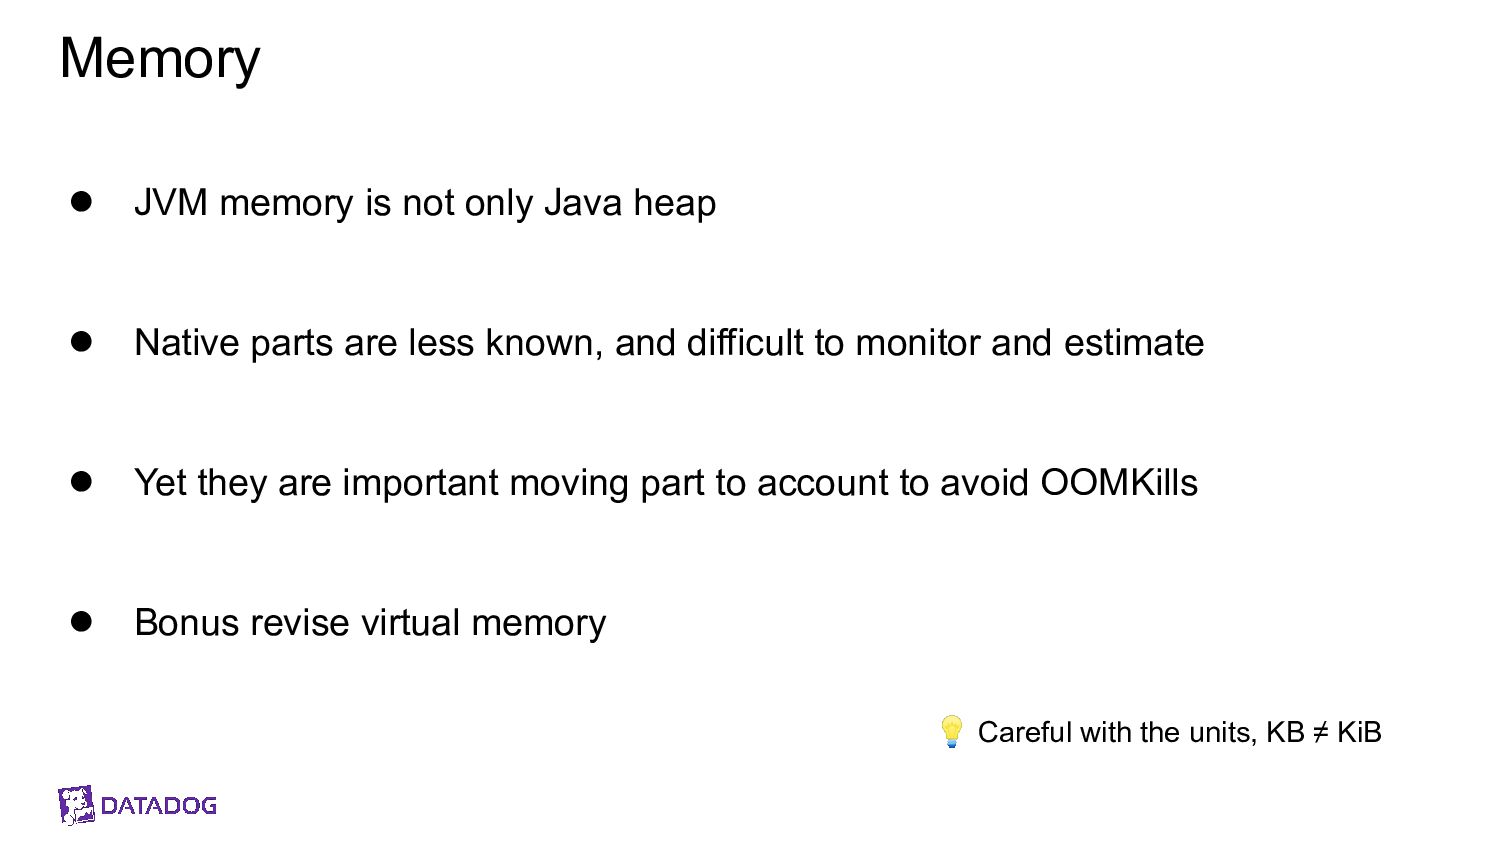
Il y a un espace entre la heap Java et le RSS : c’est la mémoire off-heap et elle se décompose en plusieurs zones. À quoi servent-elles ? Comment les prendre en compte ? La configuration du CPU impacte la JVM sur divers aspects : Quelles sont les influences entre le GC et le CPU ? Que choisir entre la rapidité ou la consommation CPU au démarrage ?

Au cours de cette université nous verrons comment diagnostiquer, comprendre et remédier à ces problèmes.

Brice Dutheil

June 22, 2022
Tweet

More Decks by Brice Dutheil

Other Decks in Programming

Transcript

  1. Remèdes
    aux oomkill, warm-ups,
    et lenteurs pour des conteneurs JVM
    Redux

    View Slide

  2. Orateurs
    Brice Dutheil
    @BriceDutheil
    Jean-Philippe Bempel
    @jpbempel

    View Slide

  3. Agenda
    My container gets oomkilled
    How does the memory actually work
    Some case in hands
    Container gets respawned
    Things that slow down startup
    Break

    View Slide

  4. My container gets oomkilled

    View Slide

  5. The containers are restarting.
    What’s going on ?
    $ kubectl get pods
    NAME READY STATUS RESTARTS AGE
    my-pod-5759f56c55-cjv57 3/3 Running 7 3d1h
    $ kubectl describe pod my-pod-5759f56c55-cjv57
    ...
    State: Running
    Started: Mon, 06 Jun 2020 13:39:40 +0200
    Last State: Terminated
    Reason: OOMKilled
    Exit Code: 137
    Started: Thu, 06 Jun 2020 09:20:21 +0200
    Finished: Mon, 06 Jun 2020 13:39:38 +0200

    View Slide

  6. 🔥 🔥
    🔥🔥
    🔥
    🔥
    🔥
    🚨 Crisis mode 🚨
    If containers are oomkilled
    Just increase the container memory limits
    and investigate later

    View Slide

  7. Linux Oomkiller
    ● Out Of Memory Killer
    Linux mechanism employed to kill processes when the memory is critically
    low
    ● For regular processes the oomkiller selects the bad ones.
    ● Within a restrained container, i.e. with memory limits,
    ○ If available memory reaches 0 in this container then the oomkiller
    terminates all processes
    ○ There is usually a single process in container

    View Slide

  8. Linux oomkiller and containers
    Monitor it
    ● kube_pod_container_status_last_terminated_reason, if the exit
    code is 137, the attached reason label will be set to OOMKilled
    ● Trigger an alert by coupling with
    kube_pod_container_status_restarts_total
    Synthetic oomkill
    docker run --memory-swap=100m --memory=100m \
    --rm -it azul/zulu-openjdk:11 \
    java -Xms100m -XX:+AlwaysPreTouch --version

    View Slide

  9. Monitor the resident memory of a process
    Eg with micrometer you may have those
    ● Heap Max :
    jvm_memory_max_bytes
    ● Heap Live :
    jvm_memory_bytes_used
    ● Process RSS :
    process_memory_rss_bytes
    And system ones, eg Kubernetes metrics
    ● Container RSS :
    container_memory_rss
    ● Memory limit :
    kube_pod_container_resource_limi
    ts_memory_bytes
    RSS
    Heap Max
    Heap Liveset
    memory limit

    View Slide

  10. Memory of a JVM process

    View Slide

  11. Memory
    As JVM based developers
    ● Used to think about JVM Heap sizing, mostly -Xms, -Xmx, …
    ● Possibly some deployment use container-aware flags:
    -XX:MinRAMPercentage, -XX:MaxRAMPercentage, …
    JVM Heap
    Xmx or MaxRAMPercentage

    View Slide

  12. Why should I be concerned by native?
    Still have no idea what is happening off-heap
    How can you size properly the heap or the container ?
    JVM Heap

    View Slide

  13. JVM Memory Breakdown
    Running A JVM requires memory:
    ● The Java Heap
    ● The Meta Space (pre-JDK 8 the Permanent Generation)
    ● Direct byte buffers
    ● Code cache (compiled code)
    ● Garbage Collector (like card table)
    ● Compiler (C1/C2)
    ● Threads
    ● Symbols
    ● etc.
    JVM subsystems

    View Slide

  14. JVM Memory Breakdown
    Except a few flags for meta space, code cache, or direct memory
    There’s no control over memory consumption of the other components
    But
    It is possible to get their size at runtime.

    View Slide

  15. By monitoring
    Eg with micrometer
    Time series
    ● jvm_memory_used_bytes
    ● jvm_memory_committed_bytes
    ● jvm_memory_max_bytes
    Dimensions
    ● area : heap or nonheap
    ● id : memory zone, depends on GC and
    JVM (e.g. G1 Eden Space, Compressed
    Class Space…)

    View Slide

  16. Monitoring is only as good as data is there
    Observability metrics rely on MBean to get memory areas
    Most JVM don’t export metrics for everything that uses memory

    View Slide

  17. Time to investigate the footprint
    With diagnostic tools

    View Slide

  18. jcmd – a swiss knife
    Get the actual flag values
    $ jcmd $(pidof java) VM.flags | tr ' ' '\n'
    6:
    ...
    -XX:InitialHeapSize=4563402752
    -XX:InitialRAMPercentage=85.000000
    -XX:MarkStackSize=4194304
    -XX:MaxHeapSize=4563402752
    -XX:MaxNewSize=2736783360
    -XX:MaxRAMPercentage=85.000000
    -XX:MinHeapDeltaBytes=2097152
    -XX:NativeMemoryTracking=summary
    ...
    PID
    Xms
    Xmx

    View Slide

  19. JVM’s Native Memory Tracking
    1. Start the JVM with -XX:NativeMemoryTracking=summary
    2. Later run jcmd $(pidof java) VM.native_memory
    Modes
    ● summary
    ● detail
    ● baseline/
    diff

    View Slide

  20. $ jcmd $(pidof java) VM.native_memory
    6:
    Native Memory Tracking:
    Total: reserved=7168324KB, committed=5380868KB
    - Java Heap (reserved=4456448KB, committed=4456448KB)
    (mmap: reserved=4456448KB, committed=4456448KB)
    - Class (reserved=1195628KB, committed=165788KB)
    (classes #28431)
    ( instance classes #26792, array classes #1639)
    (malloc=5740KB #87822)
    (mmap: reserved=1189888KB, committed=160048KB)
    ( Metadata: )
    ( reserved=141312KB, committed=139876KB)
    ( used=135945KB)
    ( free=3931KB)
    ( waste=0KB =0.00%)
    ( Class space:)
    ( reserved=1048576KB, committed=20172KB)
    ( used=17864KB)
    ( free=2308KB)
    ( waste=0KB =0.00%)
    - Thread (reserved=696395KB, committed=85455KB)
    (thread #674)
    (stack: reserved=692812KB, committed=81872KB)
    (malloc=2432KB #4046)
    (arena=1150KB #1347)
    - Code (reserved=251877KB, committed=105201KB)
    (malloc=4189KB #11718)
    (mmap: reserved=247688KB, committed=101012KB)
    - GC (reserved=230739KB, committed=230739KB)
    (malloc=32031KB #63631)
    (mmap: reserved=198708KB, committed=198708KB)
    - Compiler (reserved=5914KB, committed=5914KB)
    (malloc=6143KB #3281)
    (arena=180KB #5)
    - Internal (reserved=24460KB, committed=24460KB)
    (malloc=24460KB #13140)
    - Other (reserved=267034KB, committed=267034KB)

    View Slide

  21. $ jcmd $(pidof java) VM.native_memory
    6:
    Native Memory Tracking:
    Total: reserved=7168324KB, committed=5380868KB
    - Java Heap (reserved=4456448KB, committed=4456448KB)
    (mmap: reserved=4456448KB, committed=4456448KB)
    - Class (reserved=1195628KB, committed=165788KB)
    (classes #28431)
    ( instance classes #26792, array classes #1639)
    (malloc=5740KB #87822)
    (mmap: reserved=1189888KB, committed=160048KB)
    ( Metadata: )
    ( reserved=141312KB, committed=139876KB)
    ( used=135945KB)
    ( free=3931KB)
    ( waste=0KB =0.00%)
    ( Class space:)
    ( reserved=1048576KB, committed=20172KB)
    ( used=17864KB)
    ( free=2308KB)
    ( waste=0KB =0.00%)
    - Thread (reserved=696395KB, committed=85455KB)
    (thread #674)
    (stack: reserved=692812KB, committed=81872KB)
    (malloc=2432KB #4046)
    (arena=1150KB #1347)
    - Code (reserved=251877KB, committed=105201KB)
    (malloc=4189KB #11718)
    (mmap: reserved=247688KB, committed=101012KB)
    - GC (reserved=230739KB, committed=230739KB)
    (malloc=32031KB #63631)
    (mmap: reserved=198708KB, committed=198708KB)
    - Compiler (reserved=5914KB, committed=5914KB)
    (malloc=6143KB #3281)
    (arena=180KB #5)
    - Internal (reserved=24460KB, committed=24460KB)
    (malloc=24460KB #13140)
    - Other (reserved=267034KB, committed=267034KB)
    (classes #28431)
    (thread #674)
    Java Heap (reserved=4456448KB, committed=4456448KB)

    View Slide

  22. $ jcmd $(pidof java) VM.native_memory
    6:
    Native Memory Tracking:
    Total: reserved=7168324KB, committed=5380868KB
    - Java Heap (reserved=4456448KB, committed=4456448KB)
    (mmap: reserved=4456448KB, committed=4456448KB)
    - Class (reserved=1195628KB, committed=165788KB)
    (classes #28431)
    ( instance classes #26792, array classes #1639)
    (malloc=5740KB #87822)
    (mmap: reserved=1189888KB, committed=160048KB)
    ( Metadata: )
    ( reserved=141312KB, committed=139876KB)
    ( used=135945KB)
    ( free=3931KB)
    ( waste=0KB =0.00%)
    ( Class space:)
    ( reserved=1048576KB, committed=20172KB)
    ( used=17864KB)
    ( free=2308KB)
    ( waste=0KB =0.00%)
    - Thread (reserved=696395KB, committed=85455KB)
    (thread #674)
    (stack: reserved=692812KB, committed=81872KB)
    (malloc=2432KB #4046)
    (arena=1150KB #1347)
    - Code (reserved=251877KB, committed=105201KB)
    (malloc=4189KB #11718)
    (mmap: reserved=247688KB, committed=101012KB)
    - GC (reserved=230739KB, committed=230739KB)
    (malloc=32031KB #63631)
    (mmap: reserved=198708KB, committed=198708KB)
    - Compiler (reserved=5914KB, committed=5914KB)
    (malloc=6143KB #3281)
    (arena=180KB #5)
    - Internal (reserved=24460KB, committed=24460KB)
    (malloc=24460KB #13140)
    - Other (reserved=267034KB, committed=267034KB)
    (malloc=267034KB #631)
    - Symbol (reserved=28915KB, committed=28915KB)
    (malloc=25423KB #330973)
    (arena=3492KB #1)
    - Native Memory Tracking (reserved=8433KB, committed=8433KB)
    (malloc=117KB #1498)
    (tracking overhead=8316KB)
    - Arena Chunk (reserved=217KB, committed=217KB)
    (malloc=217KB)
    - Logging (reserved=7KB, committed=7KB)
    (malloc=7KB #266)
    - Arguments (reserved=19KB, committed=19KB)
    (malloc=19KB #521)
    Total: reserved=7168324KB, committed=5380868KB
    Class (reserved=1195628KB, committed=165788KB)
    Thread (reserved=696395KB, committed=85455KB)
    Code (reserved=251877KB, committed=105201KB)
    GC (reserved=230739KB, committed=230739KB)
    Compiler (reserved=5914KB, committed=5914KB)
    Internal (reserved=24460KB, committed=24460KB)
    Other (reserved=267034KB, committed=267034KB)

    View Slide

  23. Direct byte buffers
    Those are the memory segments that are allocated outside the Java heap.
    Unused buffers are only freed upon GC.
    Netty for example use them.
    ● < JDK 11, they are reported in the Internal section
    ● ≥ JDK 11, they are reported in the Other section
    Internal (reserved=24460KB, committed=24460KB)
    Other (reserved=267034KB, committed=267034KB)

    View Slide

  24. Garbage Collection
    Full blown memory management for the Java Heap (and Metaspace)
    Requires memory for its internal data structures
    (like G1 regions, remembered sets, etc.)
    On small containers this might be a thing to consider
    GC (reserved=230739KB, committed=230739KB)
    (malloc=32031KB #63631)
    (mmap: reserved=198708KB, committed=198708KB)

    View Slide

  25. 💡Memory mapped files
    They are not reported by Native Memory Tracking, at this time
    But are be accounted in the RSS.

    View Slide

  26. Native Memory Tracking
    👍 Good insights on the JVM sub-systems, but
    Does NMT show everything ? Nope
    Is NMT data correct ? Yes, but not for resident memory usage
    ⚠ Careful about the overhead!
    Measure if this is important for you !

    View Slide

  27. Huh what virtual, committed, reserved memory?
    virtual memory : memory management technique that
    provides an "idealized abstraction of the storage resources
    that are actually available on a given machine" which "creates
    the illusion to users of a very large memory".
    reserved memory : Contiguous chunk of memory from the
    virtual memory that the program requested to the OS.
    committed memory : writable subset of reserved memory,
    might be backed by physical storage

    View Slide

  28. Xmx = 4,25 GiB
    theory
    reality Touched pages of Java heap = 3 GiB Touched off-heap
    Xmx RSS Memory
    limit = 5 GiB
    Total: reserved=7168324KB, committed=5380868KB

    View Slide

  29. RSS is the real footprint
    Only dirty memory page count for the oomkiller
    $ ps o pid,rss -p $(pidof java)
    PID RSS
    6 4701120

    View Slide

  30. What does it means with JVM flags ?
    -Xms / -Xmx for the Java heap
    -XX:MaxPermSize, -XX:MaxMetaspaceSize, -Xss,
    -XX:MaxDirectMemorySize
    ⇒ indication of how much memory heap memory is/can be reserved
    ⚠ These flags do have a big impact on JVM subsystems, bad settings may
    trigger unwanted behaviors :
    - GC if metaspace is too small
    - Heap resizing ig Xms ≠ Xmx
    - …
    Be careful

    View Slide

  31. Avoid -XX:*RAMPercentage
    Sets the Java heap size as a function of the available physical memory. It works.
    ⚠ Small containers
    -XX:InitialRAMPercentage ⟹ -Xms
    mem < 96MiB -XX:MinRAMPercentage
    mem > 96MiB -XX:MaxRAMPercentage
    ⟹ -Xmx

    View Slide

  32. Avoid -XX:*RAMPercentage
    Different environments
    ⇒ different load, different subsystem behavior
    E.g.
    preprod : 100 req/s
    👉 40 java threads total
    👉 mostly liveness endpoints
    👉 low versatility in data
    👉 low GC activity requirement
    prod-us : 1000 req/s
    👉 200 java threads total
    👉 mostly business endpoints
    👉 variance in data
    👉 higher GC requirements

    View Slide

  33. Avoid -XX:*RAMPercentage
    1 GiB
    4 GiB
    prod-us
    preprod Java heap ≃ 850 MiB
    Java heap ≃ 3.4 GiB
    MaxRAMPercentage = 85
    ~ 150 MiB for every subsystems
    Maybe OK for quiet workloads
    ~ 600 MiB for every subsystems
    Likely not enough for loaded systems
    ⟹ leads to oomkill

    View Slide

  34. Avoid -XX:*RAMPercentage
    Traffic, Load are not linear, and do not have linear effects
    ● MaxRAMPercentage is a linear function of the container available RAM
    ● Too low MaxRAMPercentage ⟹ waste of space
    ● Too high MaxRAMPercentage ⟹ risk of oomkills
    ● Requires to find the sweet spot for all deployments
    ● Requires to adjust if load changes
    ● Need to convert back a percentage to raw value

    View Slide

  35. Avoid -XX:*RAMPercentage
    -XX:*RAMPercentage flags sort of works,
    Its drawbacks don’t make this quite compelling.
    ✅ Prefer -Xms / -Xmx

    View Slide

  36. How to configure memory requirement
    Off heap memory consumption is hard to estimate with prod load
    ● Require to understand the each JVM subsystem and make predictions.
    ● Fixing some of these values may have side effect, and it needs to be
    maintained.
    We propose instead an empiric approach

    View Slide

  37. How to configure memory requirement
    In our experience it’s best to actually retrofit. What does it mean ?
    Give a larger memory limit to the container, much higher than the max heap size.
    Heap
    Container memory limit at 5 GiB

    View Slide

  38. How to configure memory requirement
    In our experience it’s best to actually retrofit. What does it mean ?
    Give a larger memory limit to the container, much higher than the max heap size.
    1. Observe the RSS evolution
    Heap
    RSS
    Container memory limit at 5 GiB

    View Slide

  39. How to configure memory requirement
    In our experience it’s best to actually retrofit. What does it mean ?
    Give a larger memory limit to the container, much higher than the max heap size.
    1. Observe the RSS evolution
    2. If RSS stabilizes after some time
    Heap
    RSS
    RSS stabilizing
    Container memory limit at 5 GiB

    View Slide

  40. How to configure memory requirement
    In our experience it’s best to actually retrofit. What does it mean ?
    Give a larger memory limit to the container, much higher than the max heap size.
    1. Observe the RSS evolution
    2. If RSS stabilizes after some time
    3. Set the new memory limit with enough leeway (eg 200 MiB)
    Heap
    RSS
    New memory limit
    With some leeway for
    RSS increase
    Container memory limit at 5 GiB

    View Slide

  41. How to configure memory requirement
    If RSS less than Heap size at start, it’s the trap of
    virtual memory.
    If actual heap usage grows up to Xmx (i.e touched
    pages), this will lead to oomkill RSS
    Touched pages of Java heap = 3 GiB Touched off-heap
    Theoric Java heap
    memory available
    Actual available
    memory

    View Slide

  42. How to configure memory requirement
    To avoid the virtual memory pitfall use -XX:+AlwaysPreTouch
    All Java heap pages touched
    RSS

    View Slide

  43. Other things to consider
    ● Growing number of Direct byte buffers
    (e.g. with Netty, and used in other libraries like gRPC)
    ● Native allocator, glibc’s malloc can be fragmenting the native memory.
    Slow but steady increase of memory
    Can represent Gigabytes on long running containers
    ● Memory mapped files
    In theory reclaimable memory, but still account in RSS

    View Slide

  44. My Container gets re-spawn

    View Slide

  45. Container Restarted

    View Slide

  46. Quick Fix
    Increase Probe liveness timeout (either initial delay or interval)
    livenessProbe:
    httpGet:
    path: /
    port: 8080
    initialDelaySeconds: 60
    periodSeconds: 10

    View Slide

  47. JIT Compilation

    View Slide

  48. Troubleshooting Compile Time
    Use jstat -compiler to see cumulated compilation time (in s)
    $ jstat -compiler 1
    Compiled Failed Invalid Time FailedType FailedMethod
    6002 0 0 101.16 0

    View Slide

  49. Troubleshooting using JFR
    Use
    java -XX:StartFlightRecording
    jcmd 1 JFR.dump name=1 filename=petclinic.jfr
    jfr print --events jdk.CompilerStatistics petclinic.jfr

    View Slide

  50. Troubleshooting using JFR

    View Slide

  51. Measuring startup time
    docker run --cpus= -ti spring-petclinic
    CPUs JVM Startup
    time (s)
    Compile time
    (s)
    4 8.402 17.36
    2 8.458 10.17
    1 15.797 20.22
    0.8 20.731 21.71
    0.4 41.55 46.51
    0.2 86.279 92.93

    View Slide

  52. C1 vs C2
    C1 + C2 C1 only
    # compiled methods 6,117 5,084
    # C1 compiled methods 5,254 5,084
    # C2 compiled methods 863 0
    Total Time (ms) 21,678 1,234
    Total Time in C1 (ms) 2,071 1,234
    Total Time in C2 (ms)
    19,607 0

    View Slide

  53. Compiler Settings
    To only use C1 JIT compiler:
    -XX:TieredStopAtLevel=1
    To adjust C2 compiler threads:
    -XX:CICompilerCount=

    View Slide

  54. Measuring startup time
    docker run --cpus= -ti spring-petclinic
    CPUs JVM Startup time (s) Compile time (s) JVM Startup time (s)
    XX:TieredStopAtLevel=1
    Compile time (s)
    4 8.402 17.36 6.908 (-18%) 1.47
    2 8.458 10.17 6.877 (-19%) 1.41
    1 15.797 20.22 8.821 (-44%) 1.74
    0.8 20.731 21.71 10.857 (-48%) 2.08
    0.4 41.55 46.51 22.225 (-47%) 3.67
    0.2 86.279 92.93 45.706 (-47%) 6.95

    View Slide

  55. GC

    View Slide

  56. Troubleshooting GC
    Use -Xlog:gc / -XX:+PrintGCDetails

    View Slide

  57. Troubleshooting GC with JFR/JMC

    View Slide

  58. Settings properly GC: Metadata Threshold
    To avoid Full GC for loading more class anre Metaspace resize:
    Set initial Metaspace size high enough to load all your required classes
    -XX:MetaspaceSize=512M

    View Slide

  59. Settings properly GC
    Use a fixed heap size :
    -Xms = -Xmx
    -XX:InitialHeapSize = -XX:MaxHeapSize
    Heap resize done during Full GC for SerialGC & Parallel GC.
    G1 is able to resize without FullGC (regions, not the metaspace)

    View Slide

  60. GC ergonomics: GC selection
    To verify in log GC (-Xlog:gc):
    CPU Memory GC
    < 2 < 2GB Serial
    ≥ 2 < 2GB Serial
    < 2 ≥ 2GB Serial
    ≥ 2 ≥ 2 GB Parallel([0.004s][info][gc] Using G1

    View Slide

  61. GC ergonomics: # threads selection
    -XX:ParallelGCThreads=
    Used for Parallelizing work during STW phases
    -XX:ConcGCThreads=
    Used for concurrent work while application is running

    View Slide

  62. CPU resource tuning

    View Slide

  63. CPU Resources
    shares, quotas ?

    View Slide

  64. CPU shares
    Sharing cpu among containers of a node
    Correspond to Requests for Kubernetes
    Allow to use all the CPUs if needed sharing with all others containers
    $ cat /sys/fs/cgroup/cpu.weight
    20
    $ cat /sys/fs/cgroup/cpu.weight
    10
    resources:
    requests:
    cpu: 500m
    resources:
    requests:
    cpu: 250m

    View Slide

  65. CPU quotas
    Fixing limits of CPU used by a container
    Correspond to Limits to kubernetes
    resources:
    limits:
    cpu: 500m
    resources:
    limits:
    cpu: 250m
    $ cat /sys/fs/cgroup/cpu.max
    50000 100000
    $ cat /sys/fs/cgroup/cpu.max
    25000 100000

    View Slide

  66. Shares / Quotas
    Shares and quota have nothing to do with a hardware socket
    resources:
    limits:
    cpu: 1
    limits:
    cpu: 1

    View Slide

  67. availableProcessors ergonomics
    Setting CPU shares/quotas have a direct impact on
    Runtime.availableProcessors() API
    Runtime.availableProcessors() API is used to :
    ● size some concurrent structures
    ● ForkJoinPool, used for Parallel Streams, CompletableFuture, …

    View Slide

  68. Tuning CPU
    Trade-off cpu needs for startup time VS request time
    ● Adjust CPU shares / CPU quotas
    ● Adjust liveness timeout
    ● Use readiness / startup probes

    View Slide

  69. Conclusion

    View Slide

  70. Memory
    ● JVM memory is not only Java heap
    ● Native parts are less known, and difficult to monitor and estimate
    ● Yet they are important moving part to account to avoid OOMKills
    ● Bonus revise virtual memory
    💡 Careful with the units, KB ≠ KiB

    View Slide

  71. Startup
    ● Containers with <2 cpus are an constraint environment for JVM
    ● Need to keep in mind that JVM subsystems like JIT or GC need to be adjusted
    for requirements
    ● To be aware of these subsystems helps to find the balance between resources
    and requirements of your application

    View Slide

  72. References

    View Slide

  73. References
    Using Jdk Flight Recorder and JDK Mission Control
    MaxRAMPercentage is not what I wished for
    Off-Heap reconnaissance
    Startup, Containers and TieredCompilation
    Hotspot JVM performance tuning guidelines
    Application Dynamic Class Data Sharing in HotSpot JVM
    Jdk18 G1 Parallel GC Changes
    Unthrottled fixing cpu limits in the cloud
    Best Practices Java single-core containers
    Containerize your Java applications
    Université à Devoxx 2022

    View Slide